How to debug a cBot
cTrader allows developers to create, modify or work with algorithms through its built-in editor. However, some developers are already familiar with a different environment or might prefer working in a professional integrated development environment (IDE).
In this article and its corresponding video, we will demonstrate how you can debug a cBot in Visual Studio.
Open a cBot in Visual Studio
Go to the Algo app in cTrader and navigate to the cBots tab. For demonstration purposes, let's debug the Sample RSI cBot.
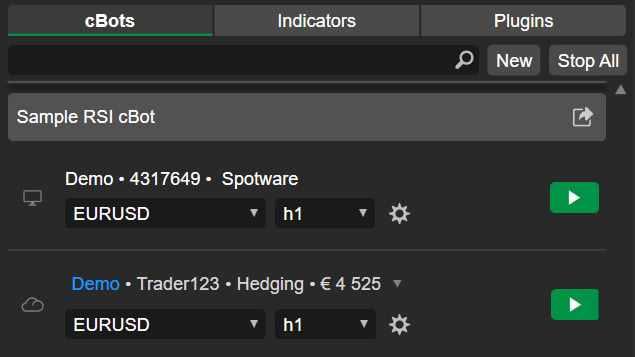
Locate Sample RSI cBot and click it. The code editor should appear on the right.
Click Edit in Visual Studio. If you have Visual Studio installed on your machine, it should open the cBot code.

Enable debugging in Visual Studio
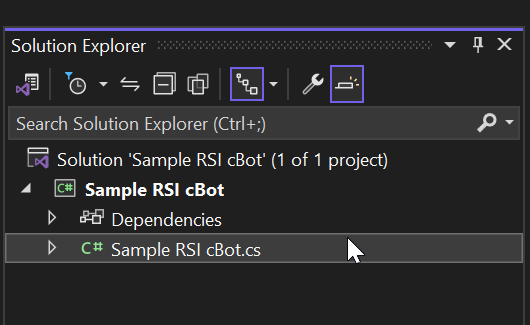
If the code editor in Visual Studio does not automatically show the cBot code, you have to locate and click the C# (.cs) file in the Sample RSI cBot solution.
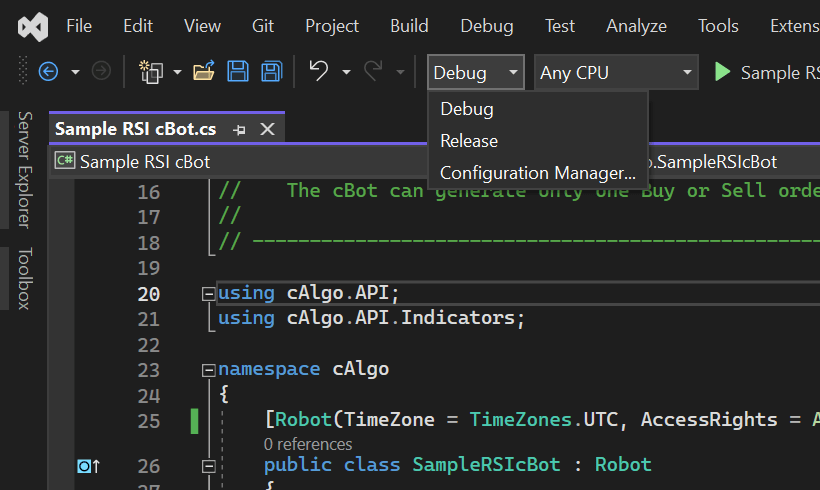
Select the Debug configuration mode.
Now, you have to modify the cBot code to allow debugging.
Start by setting the cBot AccessRights to FullAccess.
1 | |
Attach a debugger to the cBot running process by calling the System.Diagnostics.Debugger.Launch() method.
1 2 3 4 5 6 | |
At this point, the code in your Visual Studio code editor should look like this:
1 2 3 4 5 6 7 8 9 10 11 12 13 14 15 16 17 18 19 20 21 22 23 24 25 26 27 28 29 30 31 32 33 34 35 36 37 38 39 40 41 42 43 44 45 46 47 48 49 50 51 52 53 54 55 56 57 58 59 60 61 | |
Let's rebuild our cBot. Right-click the Sample RSI cBot solution and click Rebuild.
Debug the cBot
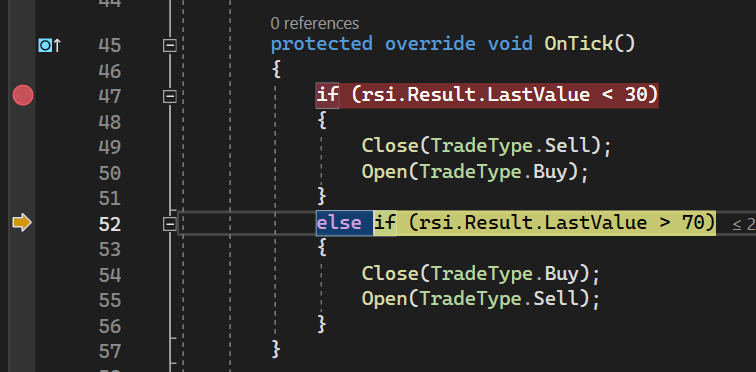
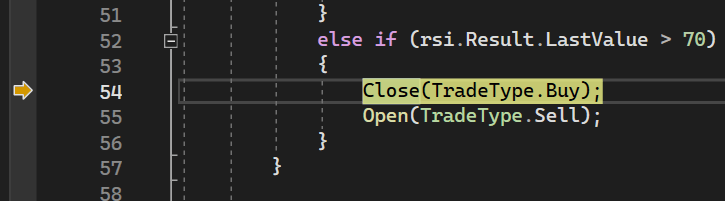
To demonstrate the debugging process, let's add a breakpoint in our OnTick() method. Right-click the if (rsi.Result.LastValue < 30) line of code, click Breakpoint and then select Insert breakpoint.
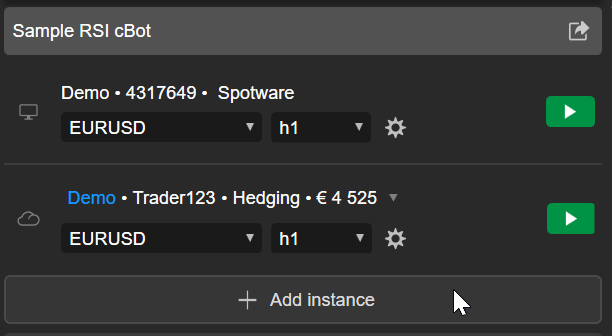
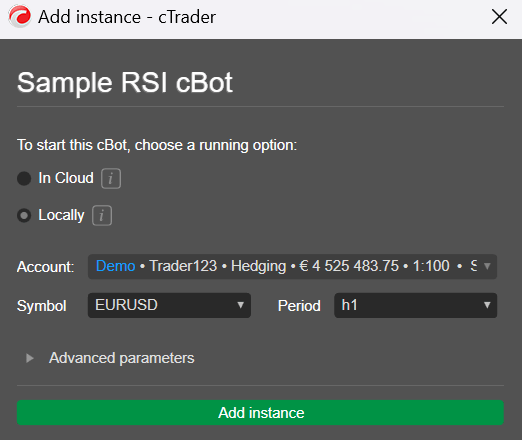
Now, you have to go back to Sample RSI cBot in cTrader. Click Add instance.
Select Locally and then click the Add instance button.
Click the Start cBot icon to run the cBot, then click the Allow button to grant it access rights.
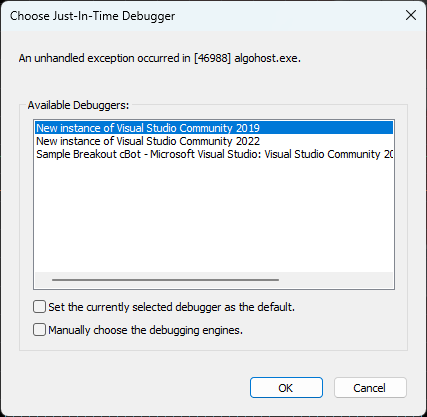
Select the Sample RSI cBot - Microsoft Visual Studio as your debugger and click the OK button.
On reaching the OnTick() event, the execution breaks by the breakpoint we set earlier.
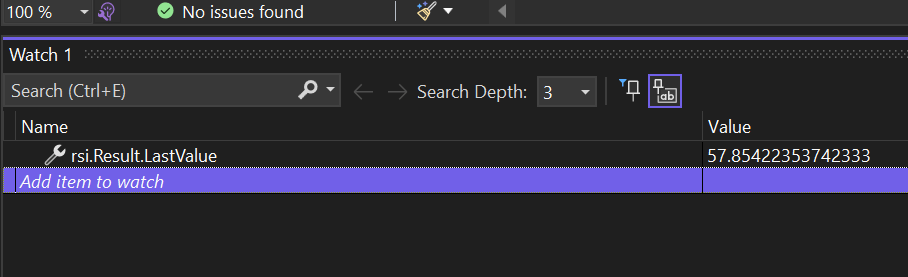
Finally, you can use all Visual Studio debugging functions. For example, you can inspect a method in the Watch window.
Additionally, you can perform the following actions:
Use the step over function to move the execution to the next line.
Drag the execution line inside another statement.
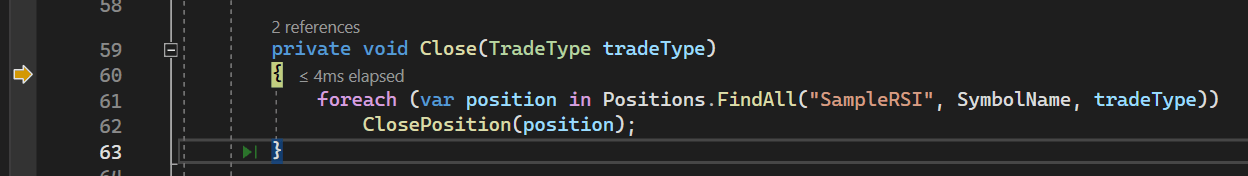
Use the step into function to step into a method and examine the execution of the code.
Summary
We hope the information in our article and video helped you debug cBots in Visual Studio. The debugging principles and operations reviewed here also apply to other professional IDEs.