Andrews' Pitchfork is a popular technical analysis tool used, sometimes with other indicators, to identify potential support and resistance levels in a trending market. These levels serve as a critical foundation for successful trading strategies, giving traders clarity, structure and confidence in their decisions.
In this article and its accompanying video, you will learn how to create a cBot that draws Andrews' Pitchfork on a chart and code the pitchfork to update itself as the chart changes.
Andrews' Pitchfork consists of a median line (centerline) and two parallel lines that form a channel. These objects help traders visualise trends, forecast price movements and identify potential entry and exit points for trades.
Andrews' Pitchfork is drawn on a price chart using three key points: a high, a low, and a subsequent high or low point. Price movement within this channel often oscillates between the upper and lower lines, while the median line serves as a reversion point.
Let’s create a cBot that draws an uptrending Andrews' Pitchfork, which typically requires two lows and a high in between. The reverse is the case for a downtrending Andrews' Pitchfork: two highs and a low in between would be needed.
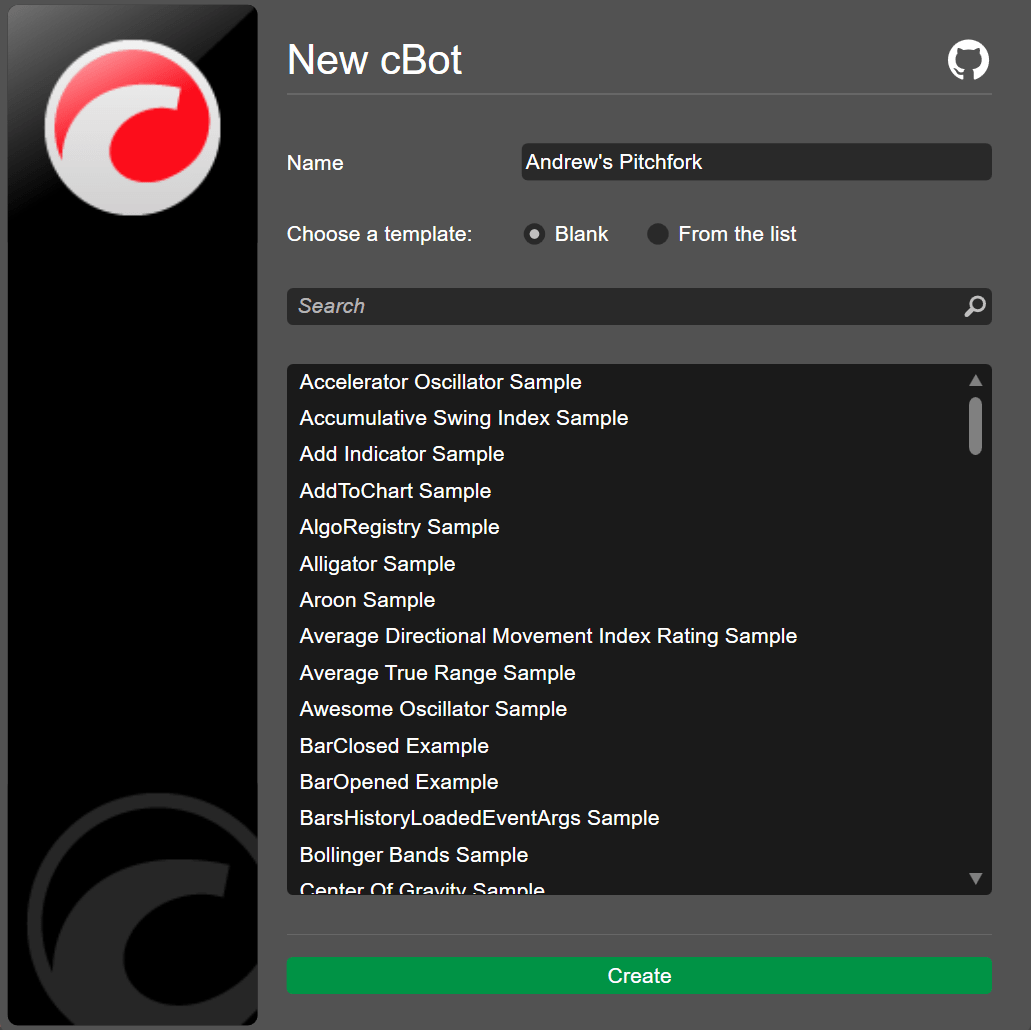
In cTrader Algo, click the 'New' button to create a cBot and input its name.
Andrews's Pitchfork requires six parameters to store the following: indices of the high and two lows, two minimum prices and a high price. Declare the six parameters.
cTrader Algo allows you to define the time location through methods providing either the absolute time or the relative bar index. The method used to draw the pitchfork on the chart introduces the relevant overrides. In this case, we chose the relative bar index.
Write the code to detect the indices of the high and low prices.
Use the Ctrl+B hotkey or click 'Build' to build the cBot.
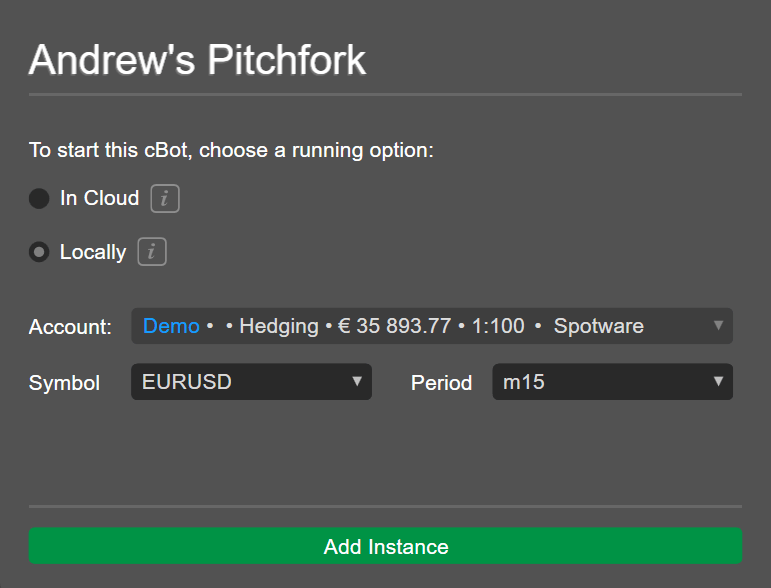
Add a local instance of the cBot by clicking 'Add Instance', selecting the 'Locally' option and then clicking 'Add Instance'.
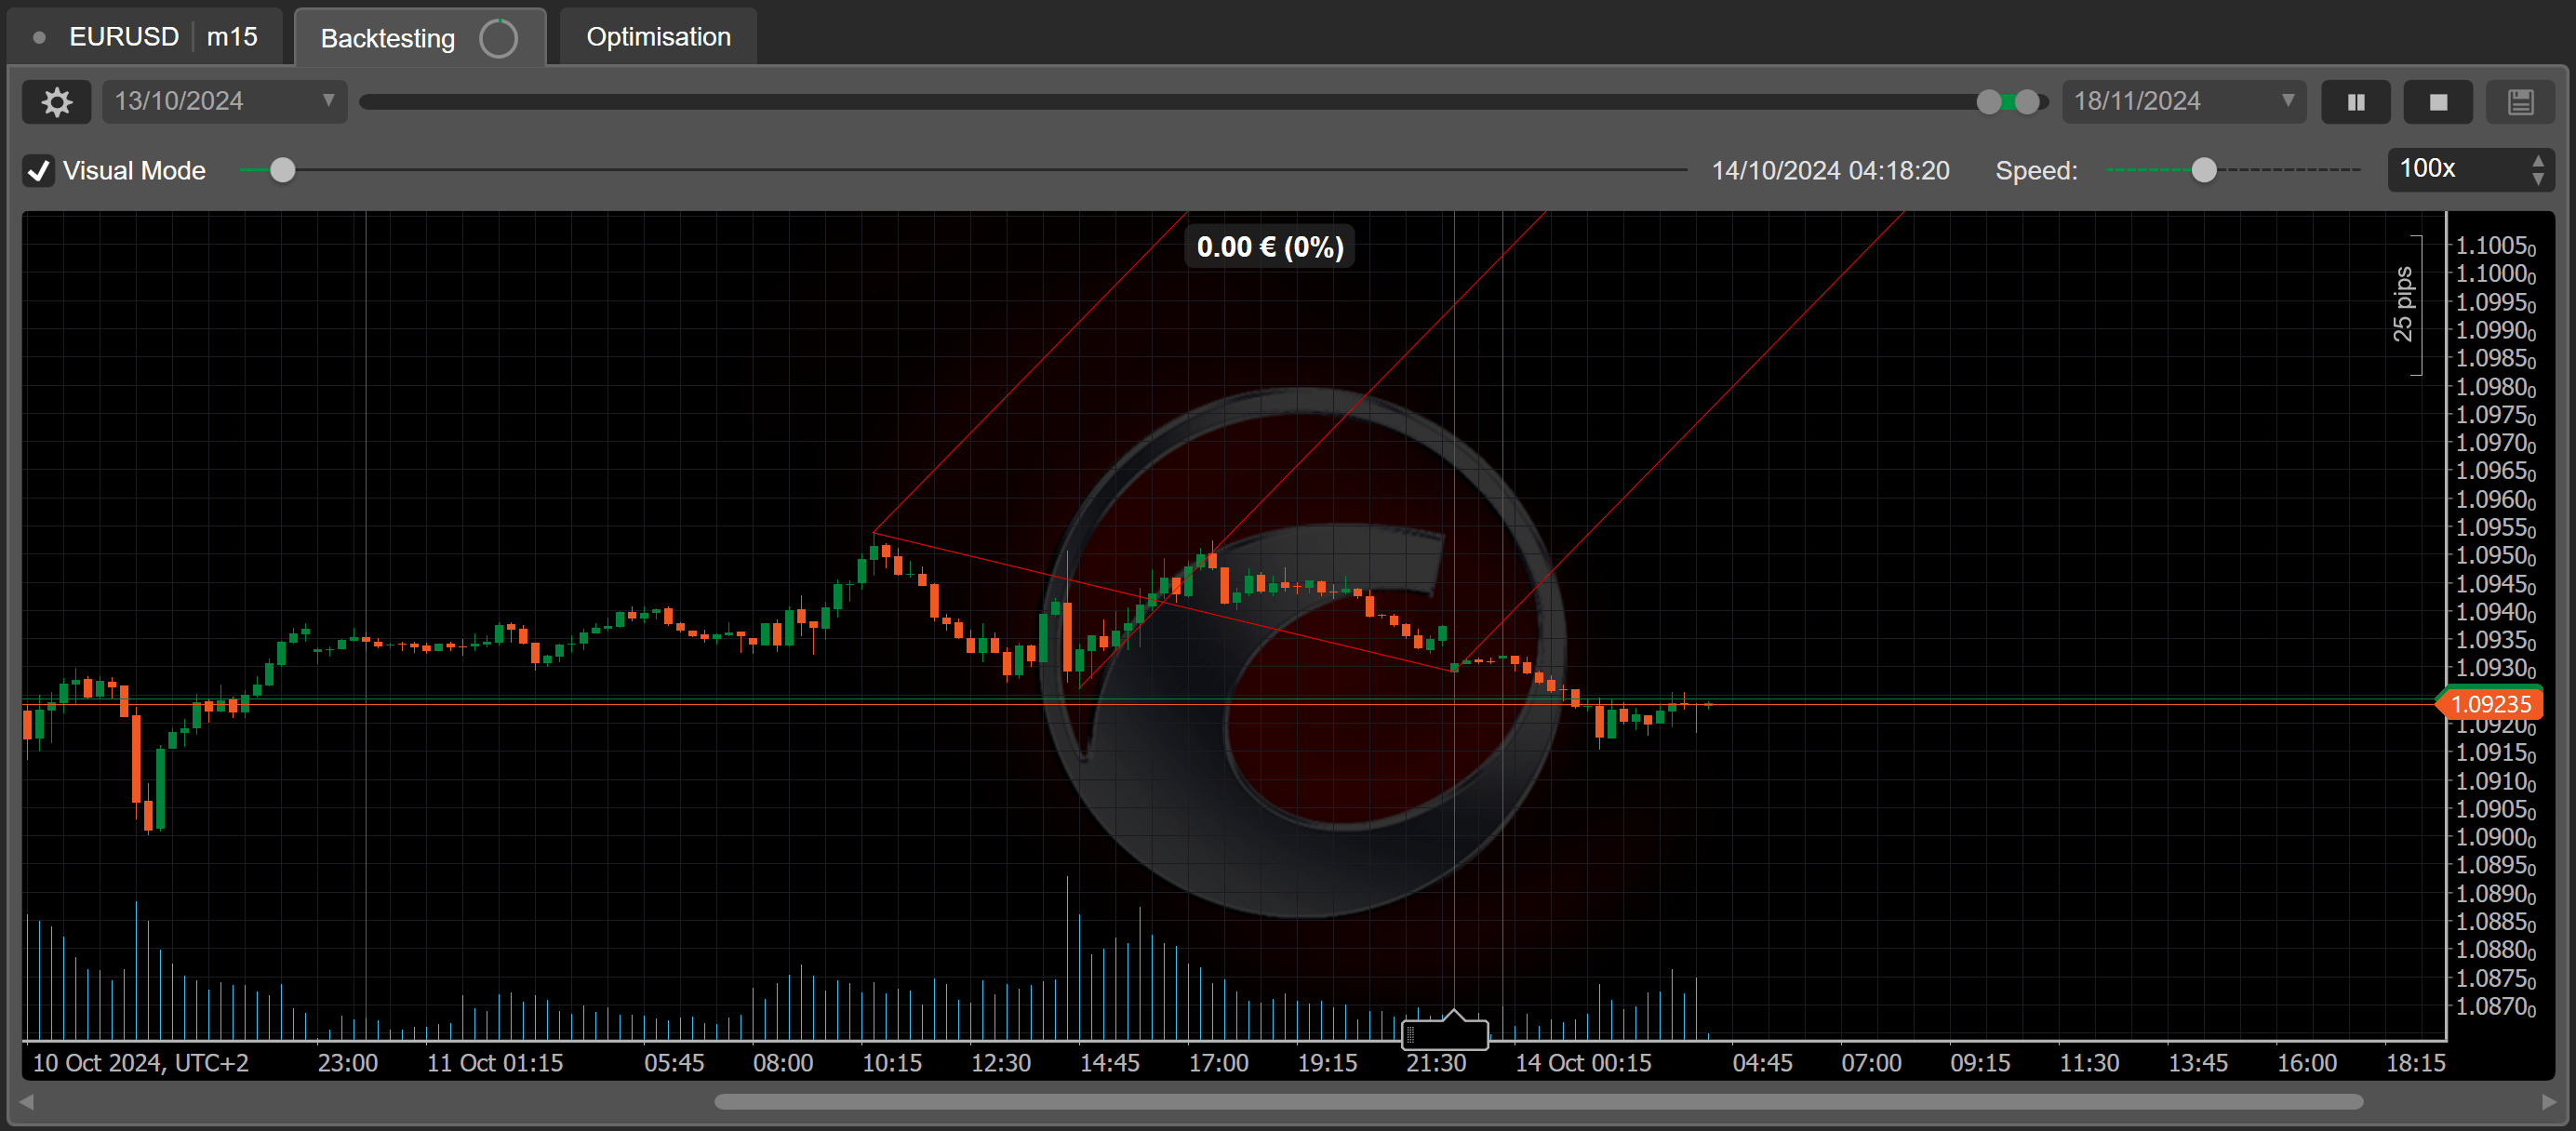
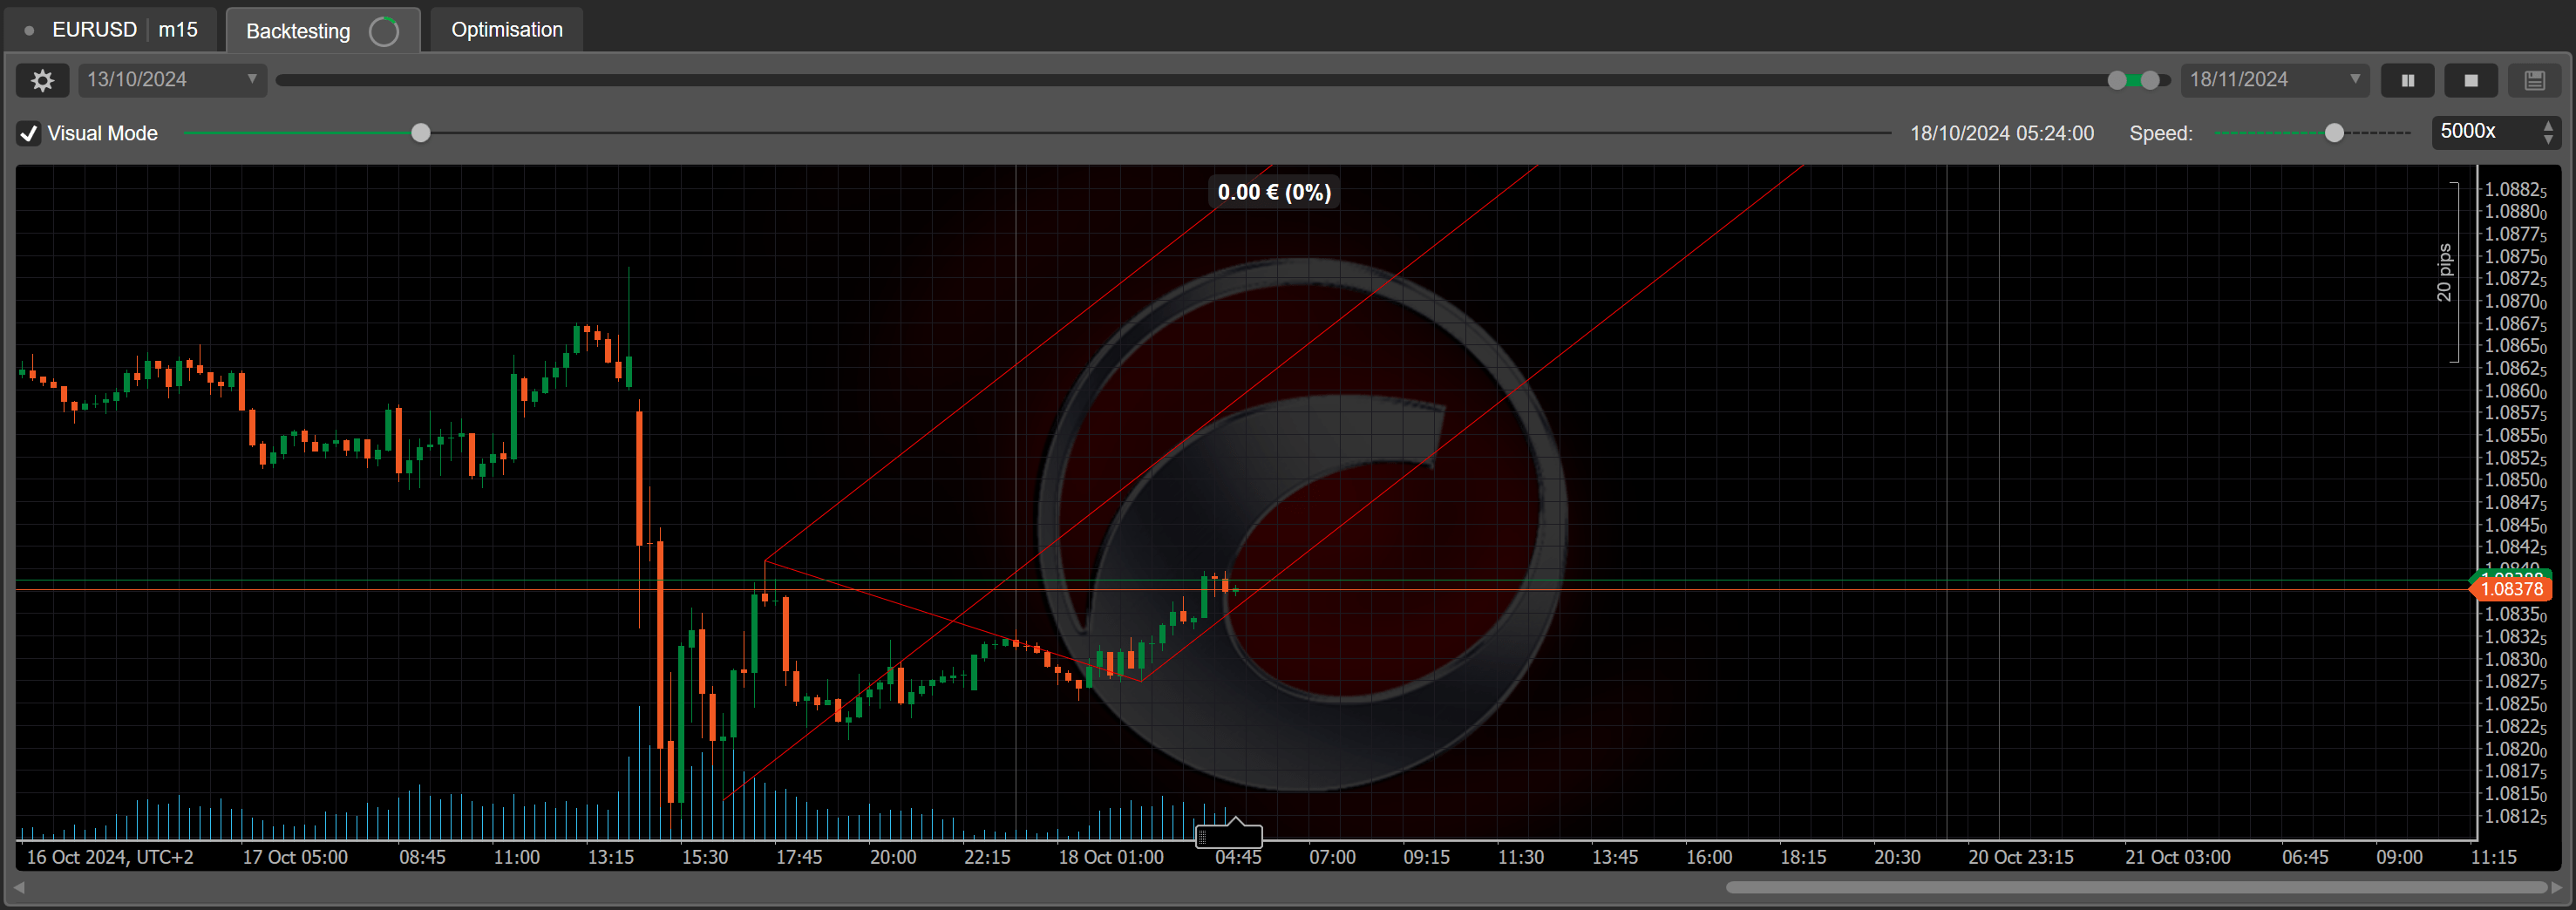
Click the instance and navigate to the 'Backtesting' tab. Select a period for the backtesting, enable the 'Visual Mode' option and then click the play icon.
You should see the Andrews' Pitchfork drawn on the chart.