How to draw Fibonacci retracements
Fibonacci Retracements are a popular technical analysis tool used to identify potential levels of support and resistance in the price of an asset. By identifying support and resistance levels, traders gain a strategic edge in timing their trades, managing risk, aligning with market trends and ultimately improving their chances of profitability.
In this article and its corresponding video, you will learn how to create a cBot that draws Fibonacci Retracements on a chart and opens positions based on retracements.
Draw Fibonacci retracement on a chart
Fibonacci Retracements implement the Fibonacci sequence, a series of numbers where each number is the sum of the two preceding ones.
Example
This is a Fibonacci sequence example: 0, 1, 1, 2, 3, 5, 8, 13, 21, 34, 55, 89, 144, …
Fibonacci Retracement levels are ratios of successive numbers derived from the Fibonacci sequence. These are the popular ratios used in technical analysis and trading: 0.236, 0.382, 0.5, 0.618 and sometimes 0.786.
We will create a cBot that draws Fibonacci Retracements on a chart. Four parameters representing the starting price, starting time, ending price and ending time will be provided in the cBot code.
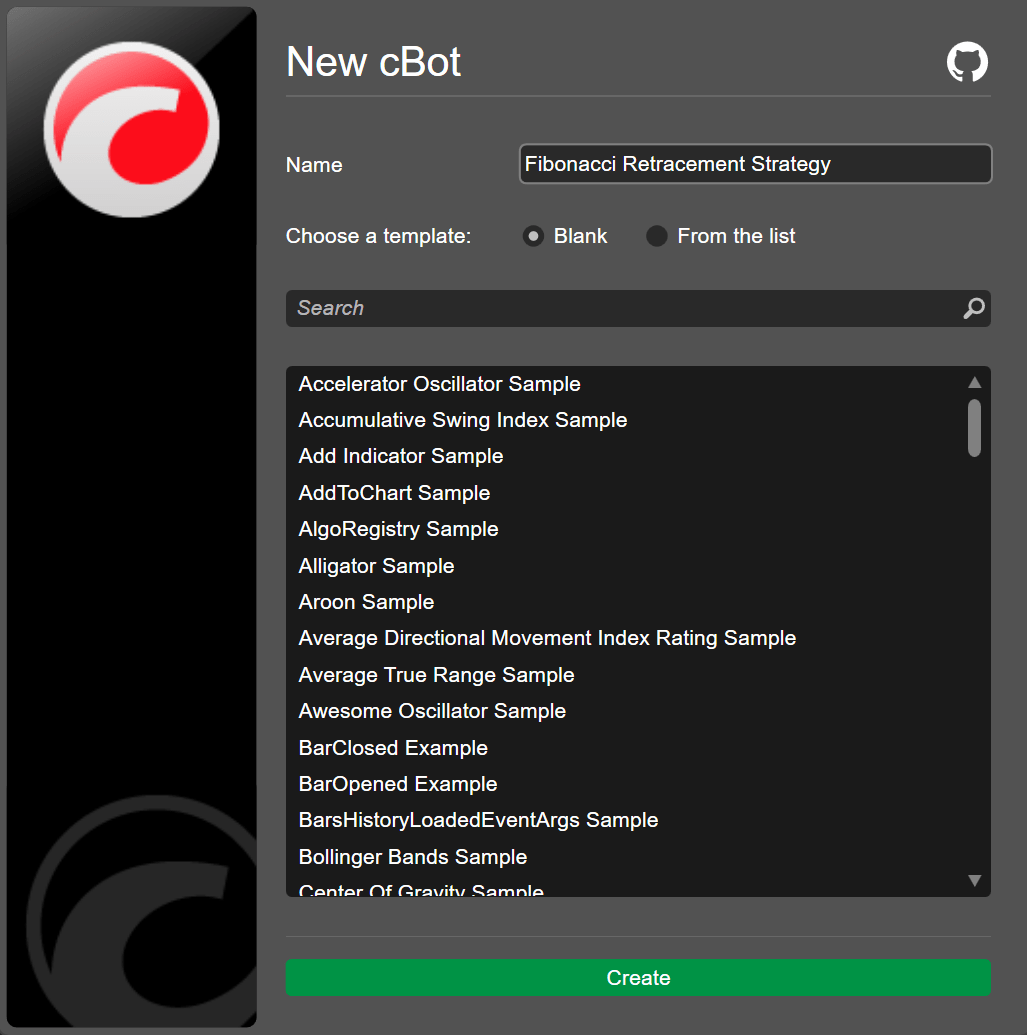
In cTrader Algo, click the New button to create a cBot and enter a name such as "Fibonaci Retracement Strategy".
Declare the four important variables.
1 2 3 4 5 | |
Code the cBot to detect the minimum and maximum prices for the last 50 bars.
1 2 | |
cTrader Algo allows users to define the time location through the absolute time or relative bar index. We will use the relative bar index to draw the Fibonacci retracement and write the code to detect the index of the high and low prices.
1 2 3 4 5 6 7 8 9 10 11 | |
Finally, the code that draws the Fibonacci Retracements on the chart can be written. The order of the high and low prices determines the direction of the Fibonacci retracement.
1 2 3 4 | |
You can copy the full code below:
1 2 3 4 5 6 7 8 9 10 11 12 13 14 15 16 17 18 19 20 21 22 23 24 25 26 27 28 29 30 31 32 33 34 35 36 37 38 39 40 41 42 43 44 45 46 47 48 49 50 51 | |
To build the cBot, use the Ctrl+B hotkey or click Build.
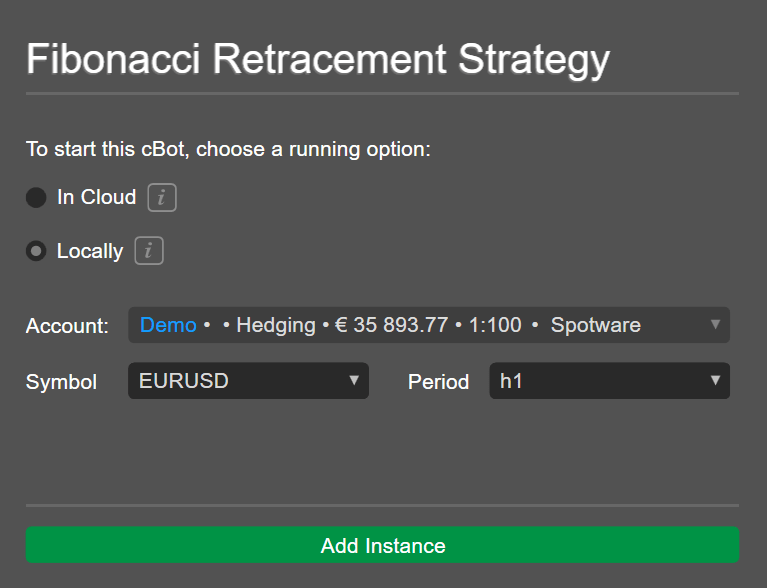
Add a local instance of the cBot: click Add instance, select the Locally option, then click Add instance.
Click the instance and navigate to the Backtesting tab. Choose a period for the backtesting and then click the play icon.
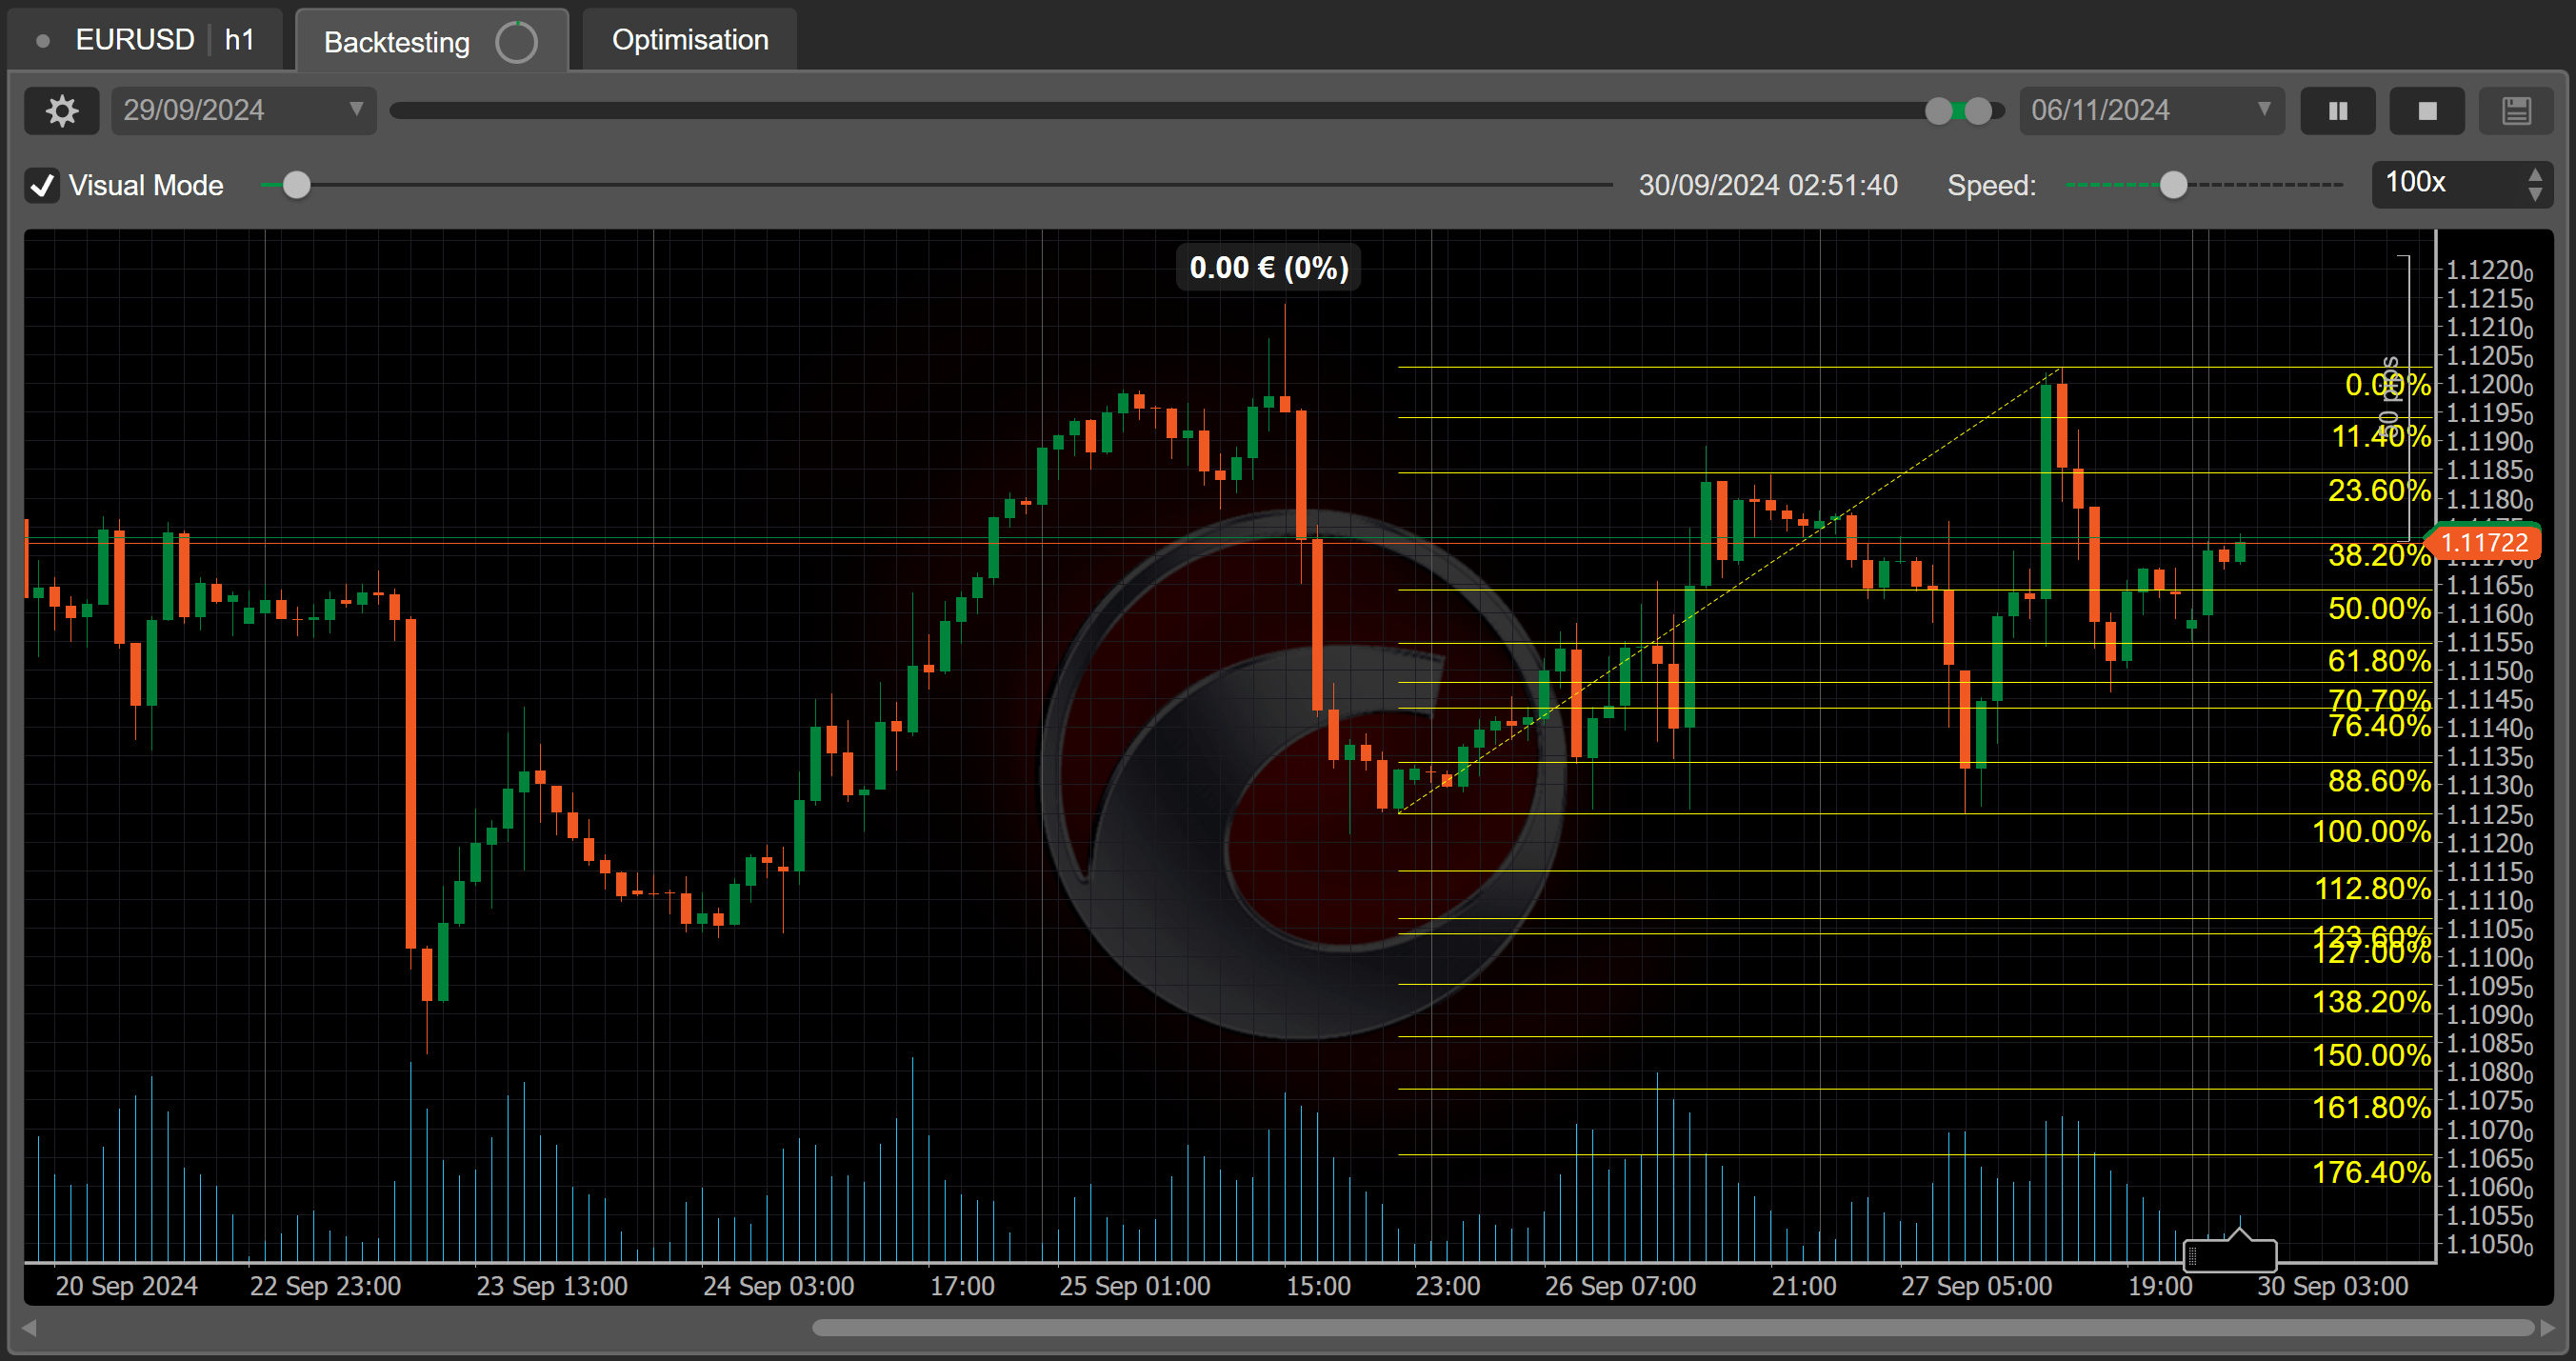
You should see the Fibonacci Retracements drawn on the chart.
Trade the Fibonacci retracement
Return to the code editor to implement a simple strategy based on the Fibonacci retracements. The strategy revolves around entering a buy position whenever the price crosses the 0.618 Fibonacci level and a bounce back is expected.
Write the code that executes the strategy in the OnTick() method.
1 2 3 4 5 | |
You can copy the full code below:
1 2 3 4 5 6 7 8 9 10 11 12 13 14 15 16 17 18 19 20 21 22 23 24 25 26 27 28 29 30 31 32 33 34 35 36 37 38 39 40 41 42 43 44 45 46 47 48 49 50 51 52 | |
Build the cBot again and then backtest it.
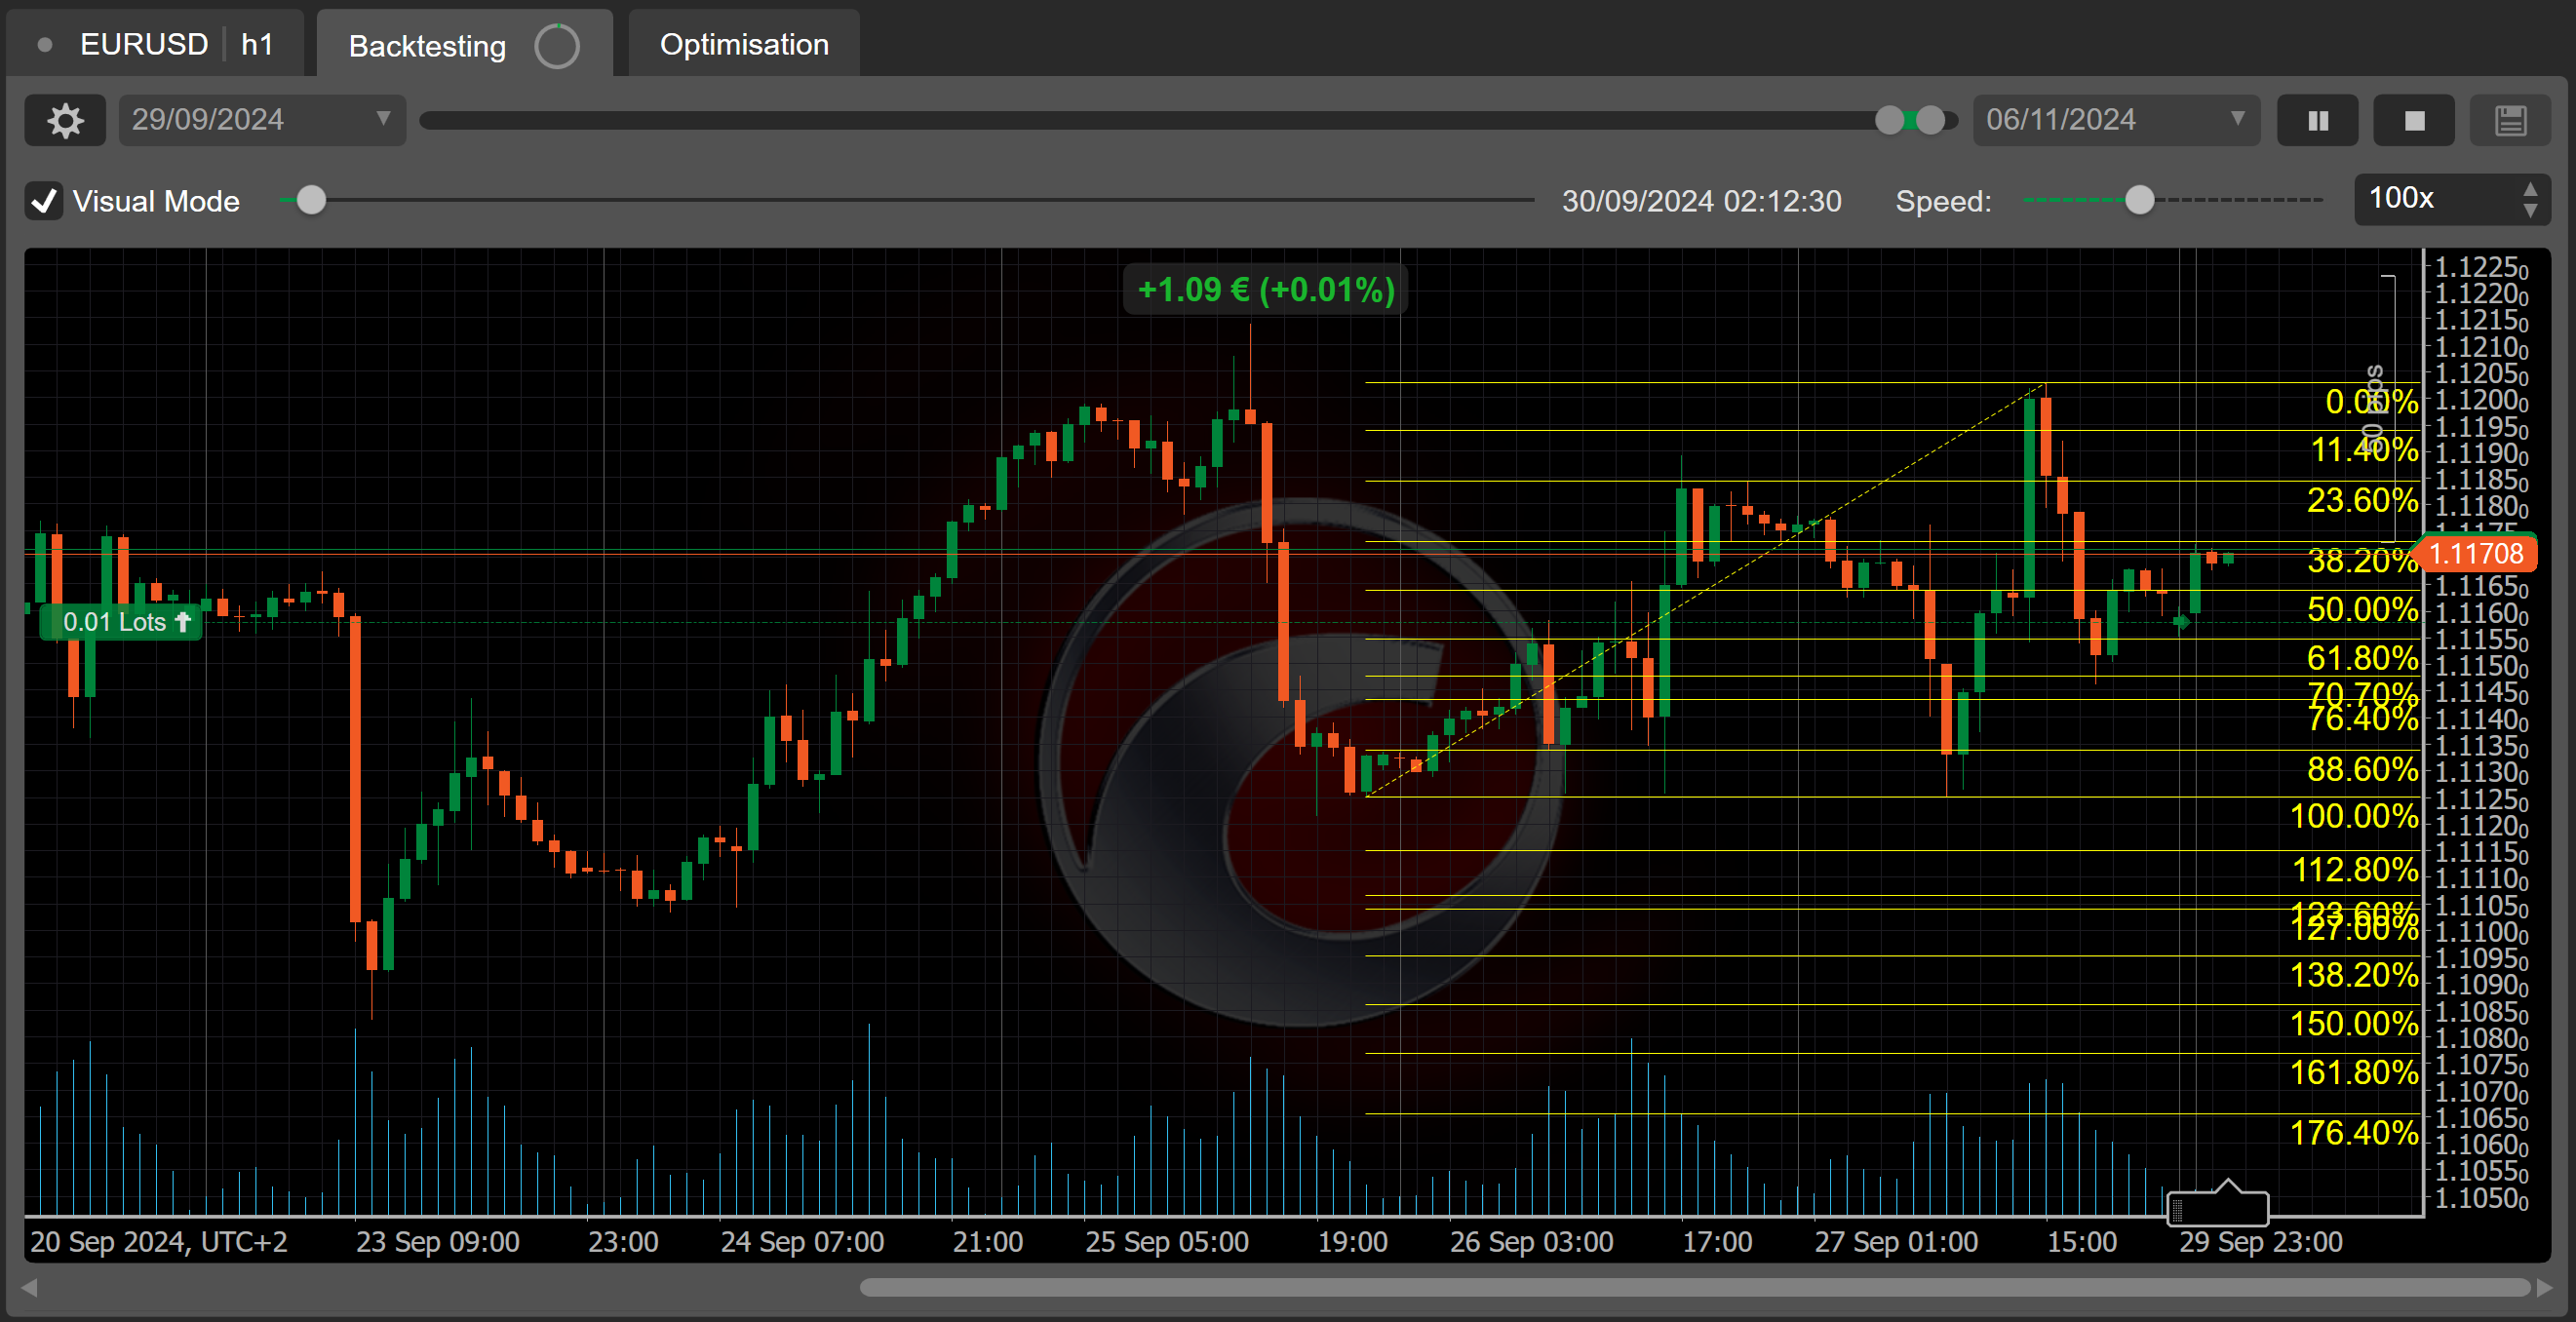
You should see positions being entered whenever the retracement level is crossed.
Summary
This article has explained how to draw Fibonacci retracements on a symbol chart and implement a trading strategy that relies on the retracements.