How to use a canvas VIDEO
The canvas control from the cTrader Algo API empowers traders to create custom visuals, including texts, shapes and images in cTrader. These drawings improve data visualisation for workflows and provide a more personalised trading experience.
In this article and its corresponding video, you will learn how to use the canvas control on a trading chart and implement customisable parameters.
Create canvas control The Canvas class can be accessed and used by all algorithm types (cBots, indicators and plugins). In addition to drawing texts, shapes and images, the canvas control can be used to add special objects such as arrows, labels or even annotations directly to charts.
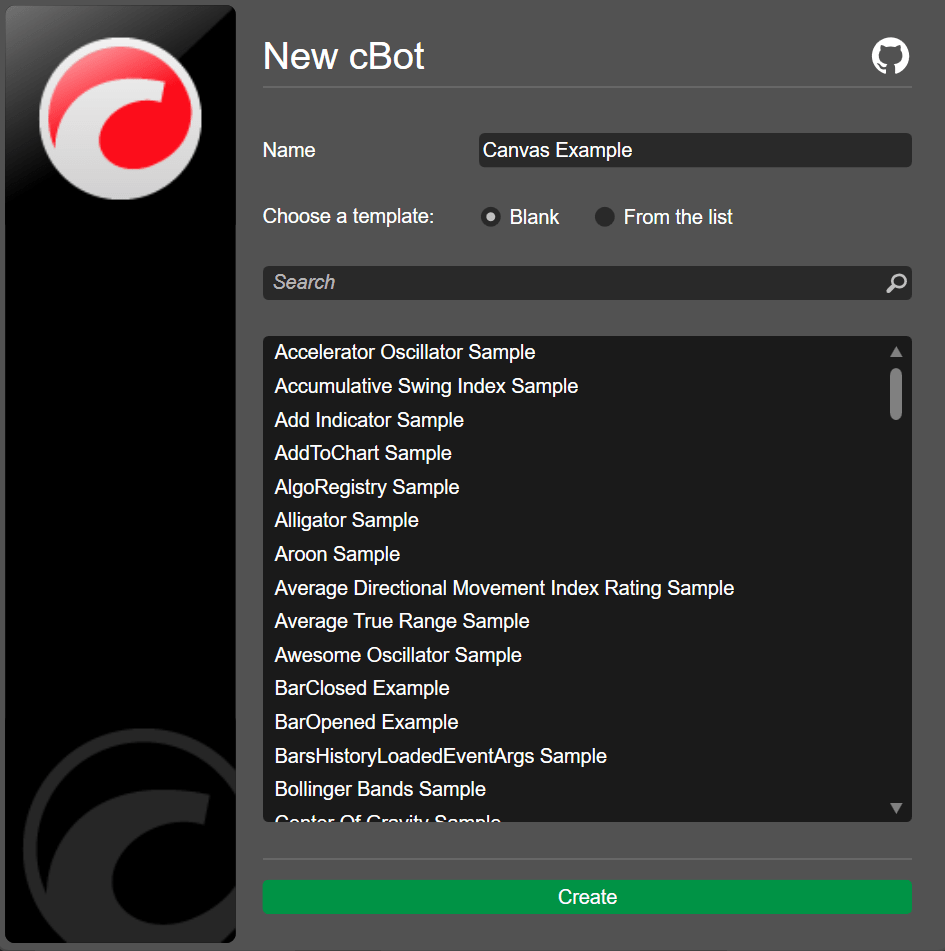
We will develop a cBot that draws a canvas on a chart. In cTrader Algo, click the New button to create a cBot, enter a name and click Create .
Declare a canvas.
Initialise the canvas and add it to a chart.
_canvas = new Canvas ();
Chart . AddControl ( _canvas );
Draw elements inside the canvas. Use the Left and Top coordinates to position the elements.
1
2
3
4
5
6
7
8
9
10
11
12
13
14
15
16
17
18
19 var rectangle = new Rectangle
{
Left = 50 ,
Top = 50 ,
Width = 100 ,
Height = 50 ,
StrokeColor = Color . Blue
};
_canvas . AddChild ( rectangle );
var text = new TextBlock
{
Left = 70 ,
Top = 70 ,
Text = "Hello Canvas!" ,
};
_canvas . AddChild ( text );
Note
The x and y axes here differ from those associated with chart objects or drawings. The x and y coordinates used by the Canvas class represent numeric values starting from (0, 0) from the top-left corner of the chart.
You can copy the full code below:
 1
 2
 3
 4
 5
 6
 7
 8
 9
10
11
12
13
14
15
16
17
18
19
20
21
22
23
24
25
26
27
28
29
30
31
32
33
34
35
36
37
38
39
40
41
42
43
44
45
46
47
48
49
50
51
52
53 using System ;
using cAlgo.API ;
using cAlgo.API.Collections ;
using cAlgo.API.Indicators ;
using cAlgo.API.Internals ;
namespace cAlgo.Robots
{
[Robot(AccessRights = AccessRights.None, AddIndicators = true)]
public class CanvasExample : Robot
{
[Parameter(DefaultValue = "Hello world!")]
public string Message { get ; set ; }
private Canvas _canvas ;
protected override void OnStart ()
{
_canvas = new Canvas ();
Chart . AddControl ( _canvas );
var rectangle = new Rectangle
{
Left = 50 ,
Top = 50 ,
Width = 100 ,
Height = 50 ,
StrokeColor = Color . Blue
};
_canvas . AddChild ( rectangle );
var text = new TextBlock
{
Left = 70 ,
Top = 70 ,
Text = "Hello Canvas!" ,
};
_canvas . AddChild ( text );
}
protected override void OnTick ()
{
// Handle price updates here
}
protected override void OnStop ()
{
// Handle cBot stop here
}
}
}
To build the cBot, use the Ctrl + B Build .
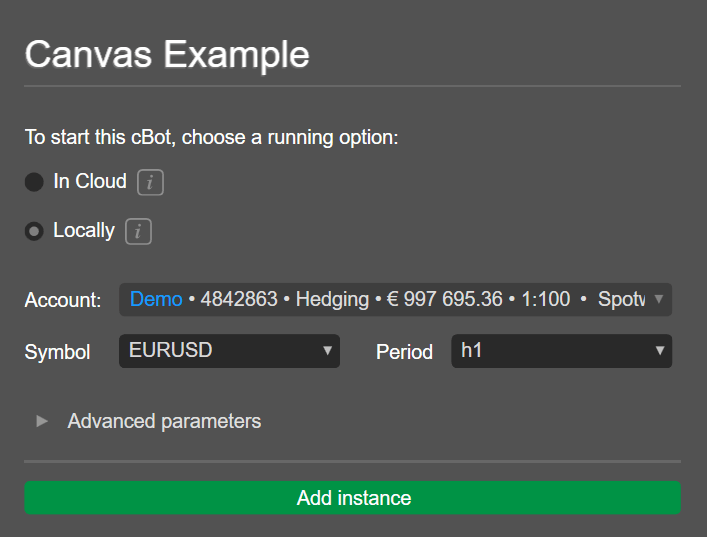
Add a local instance of the cBot by clicking Add instance , selecting the Locally option and then clicking Add instance .
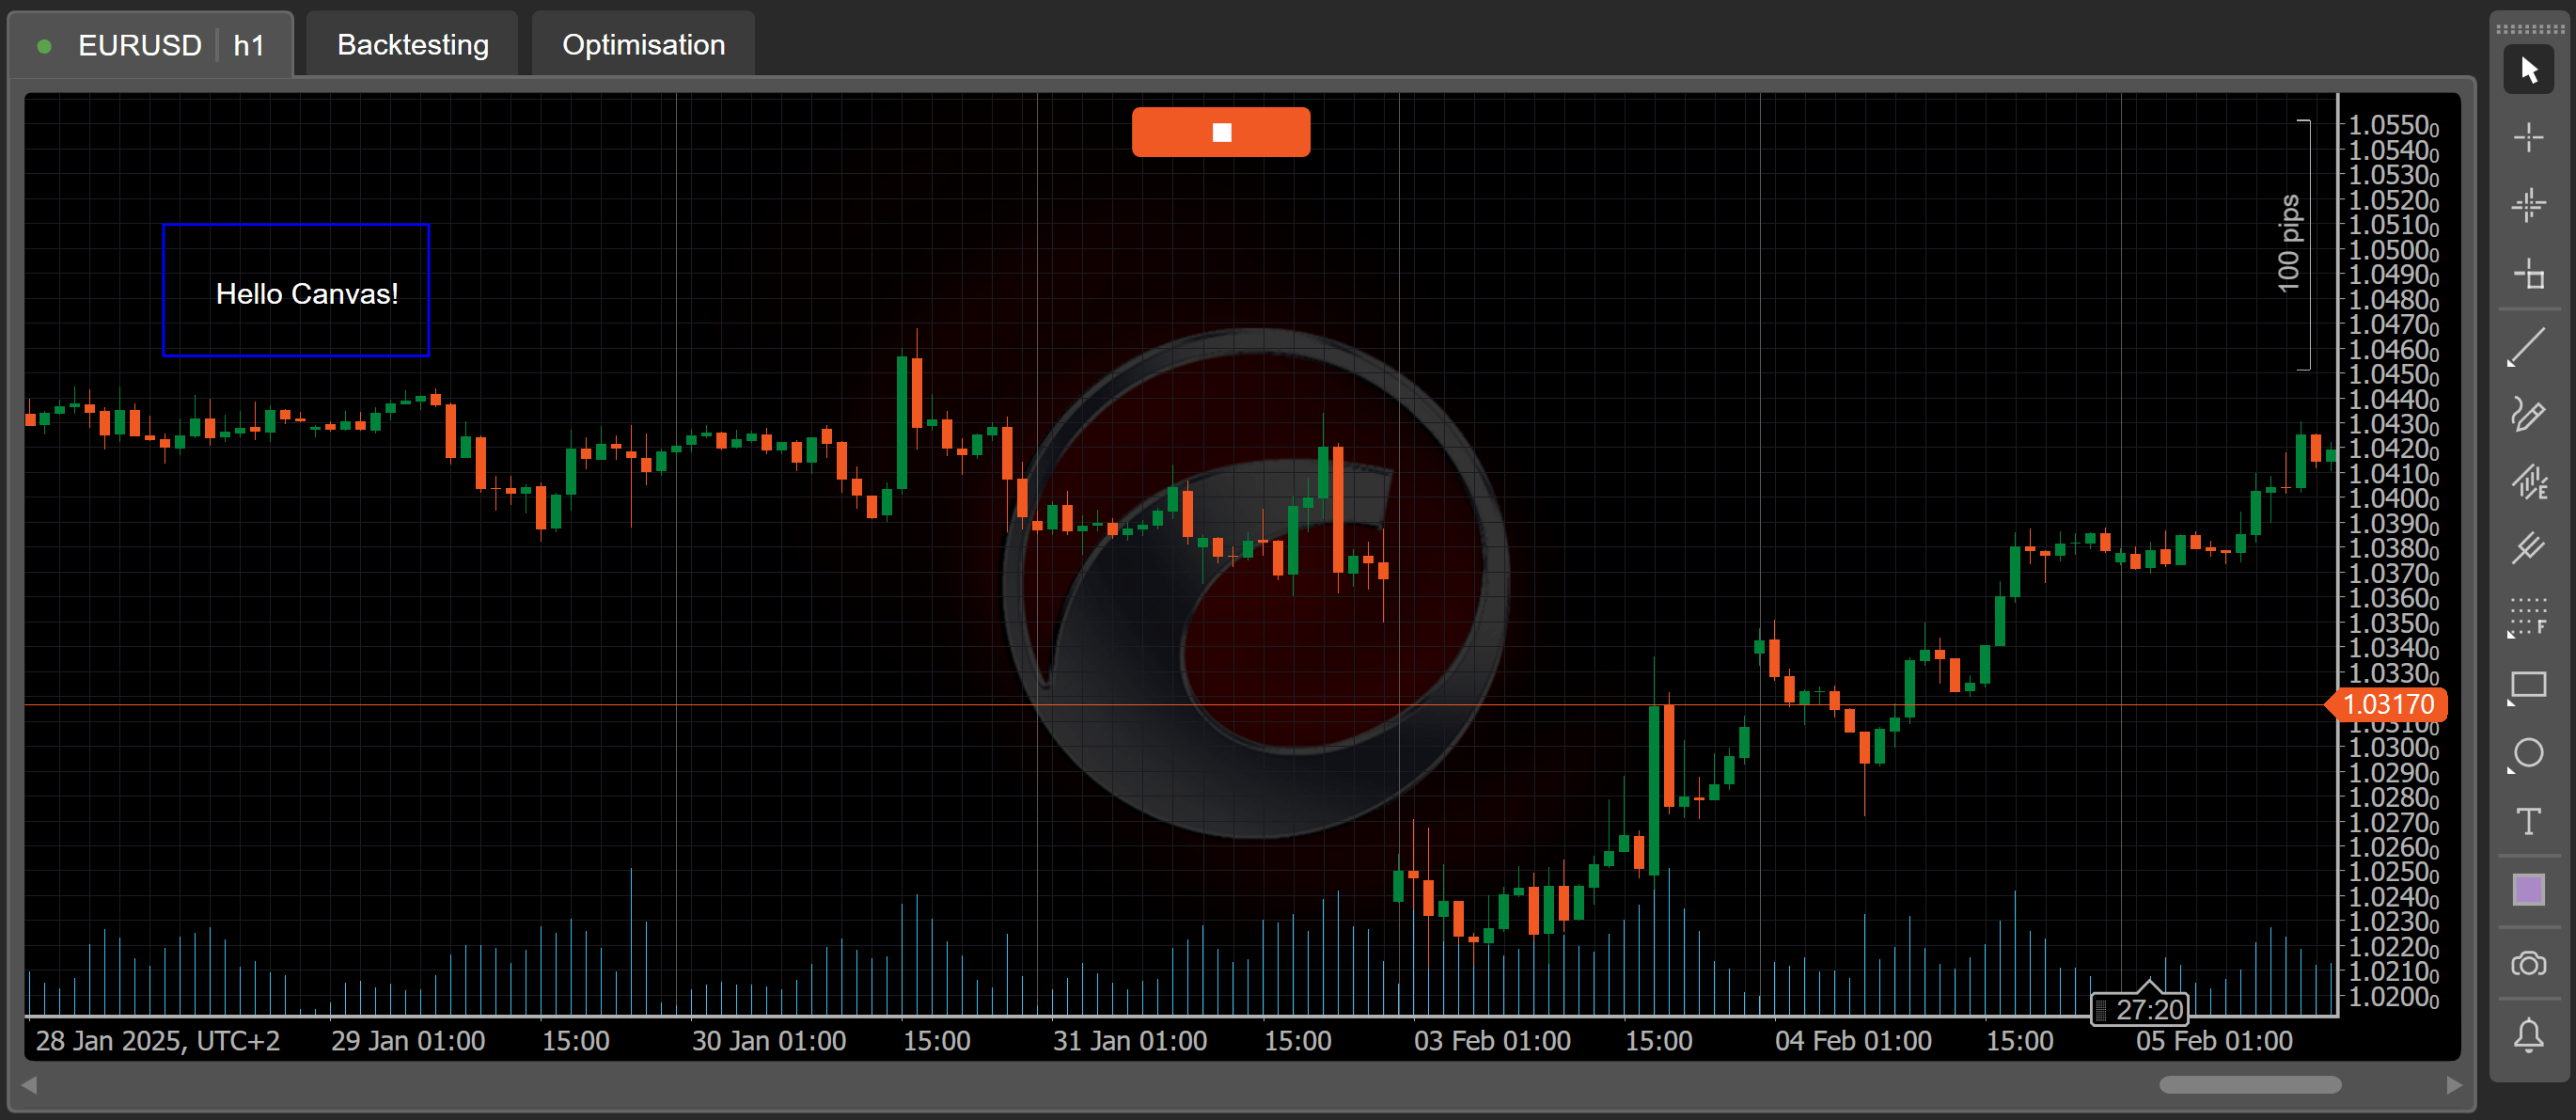
Click the play icon, and the canvas should appear on the chart. You should see how the elements are placed in relation to the canvas corners.
Add customisable parameters Return to the code editor for the cBot and make changes so that the coordinates for the objects shown on the chart become customisable parameters.
Create parameters for the x and y coordinates of the rectangle.
[Parameter("Rectangle Left", DefaultValue = 50)]
public int RectangleLeft { get ; set ; }
[Parameter("Rectangle Top", DefaultValue = 50)]
public int RectangleTop { get ; set ; }
Create parameters for the width and height of the rectangle.
[Parameter("Rectangle Width", DefaultValue = 100)]
public int RectangleWidth { get ; set ; }
[Parameter("Rectangle Height", DefaultValue = 50)]
public int RectangleHeight { get ; set ; }
Create parameters for the x and y coordinates of the text.
[Parameter("Text Left", DefaultValue = 70)]
public int TextLeft { get ; set ; }
[Parameter("Text Top", DefaultValue = 70)]
public int TextTop { get ; set ; }
Modify the rectangle code to enable it to use the new customisable parameters.
var rectangle = new Rectangle
{
Left = RectangleLeft ,
Top = RectangleTop ,
Width = RectangleWidth ,
Height = RectangleHeight ,
StrokeColor = Color . Blue
};
Modify the text code to enable it to use the new customisable parameters.
var text = new TextBlock
{
Left = TextLeft ,
Top = TextTop ,
Text = "Hello Canvas!" ,
};
You can copy the full code below:
 1
 2
 3
 4
 5
 6
 7
 8
 9
10
11
12
13
14
15
16
17
18
19
20
21
22
23
24
25
26
27
28
29
30
31
32
33
34
35
36
37
38
39
40
41
42
43
44
45
46
47
48
49
50
51
52
53
54
55
56
57
58
59
60
61
62
63
64
65
66
67
68 using System ;
using cAlgo.API ;
using cAlgo.API.Collections ;
using cAlgo.API.Indicators ;
using cAlgo.API.Internals ;
namespace cAlgo.Robots
{
[Robot(AccessRights = AccessRights.None, AddIndicators = true)]
public class CanvasExample : Robot
{
[Parameter("Rectangle Left", DefaultValue = 50 )]
public int RectangleLeft { get ; set ; }
[Parameter("Rectangle Top", DefaultValue = 50 )]
public int RectangleTop { get ; set ; }
[Parameter("Rectangle Width", DefaultValue = 100 )]
public int RectangleWidth { get ; set ; }
[Parameter("Rectangle Height", DefaultValue = 50 )]
public int RectangleHeight { get ; set ; }
[Parameter("Text Left", DefaultValue = 70 )]
public int TextLeft { get ; set ; }
[Parameter("Text Top", DefaultValue = 70 )]
public int TextTop { get ; set ; }
private Canvas _canvas ;
protected override void OnStart ()
{
_canvas = new Canvas ();
Chart . AddControl ( _canvas );
var rectangle = new Rectangle
{
Left = RectangleLeft ,
Top = RectangleTop ,
Width = RectangleWidth ,
Height = RectangleHeight ,
StrokeColor = Color . Blue
};
_canvas . AddChild ( rectangle );
var text = new TextBlock
{
Left = TextLeft ,
Top = TextTop ,
Text = "Hello Canvas!" ,
};
_canvas . AddChild ( text );
}
protected override void OnTick ()
{
// Handle price updates here
}
protected override void OnStop ()
{
// Handle cBot stop here
}
}
}
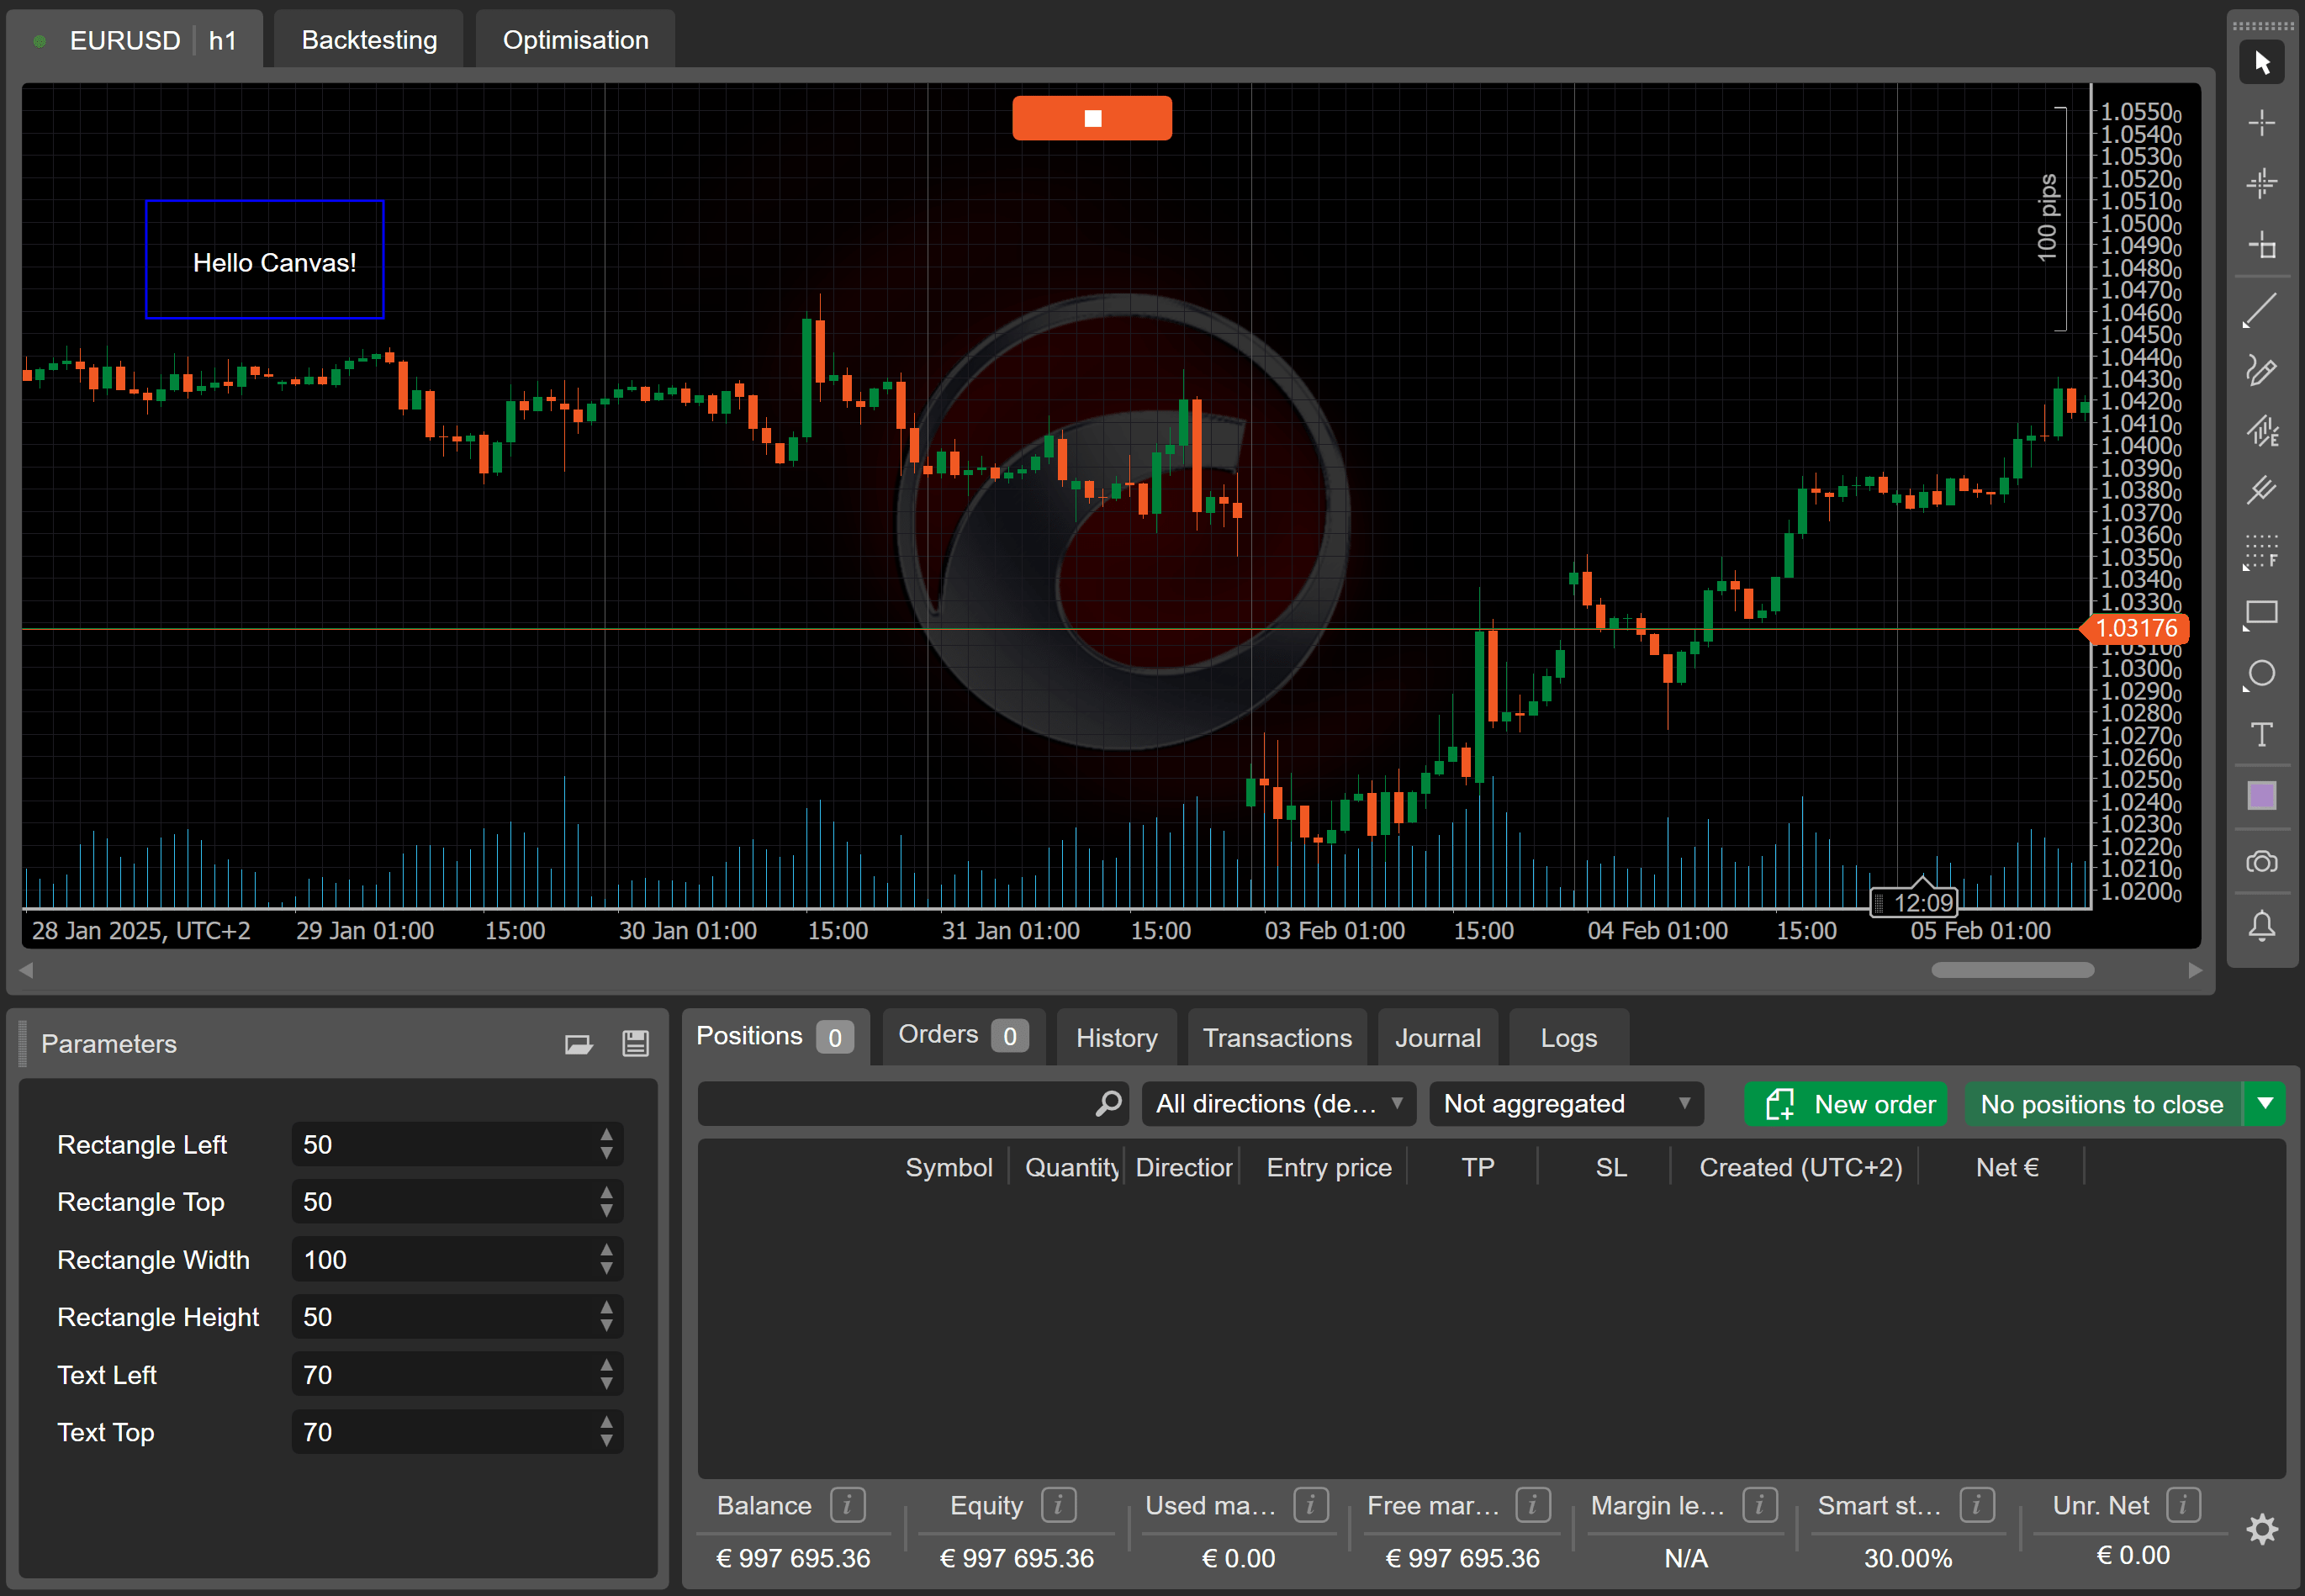
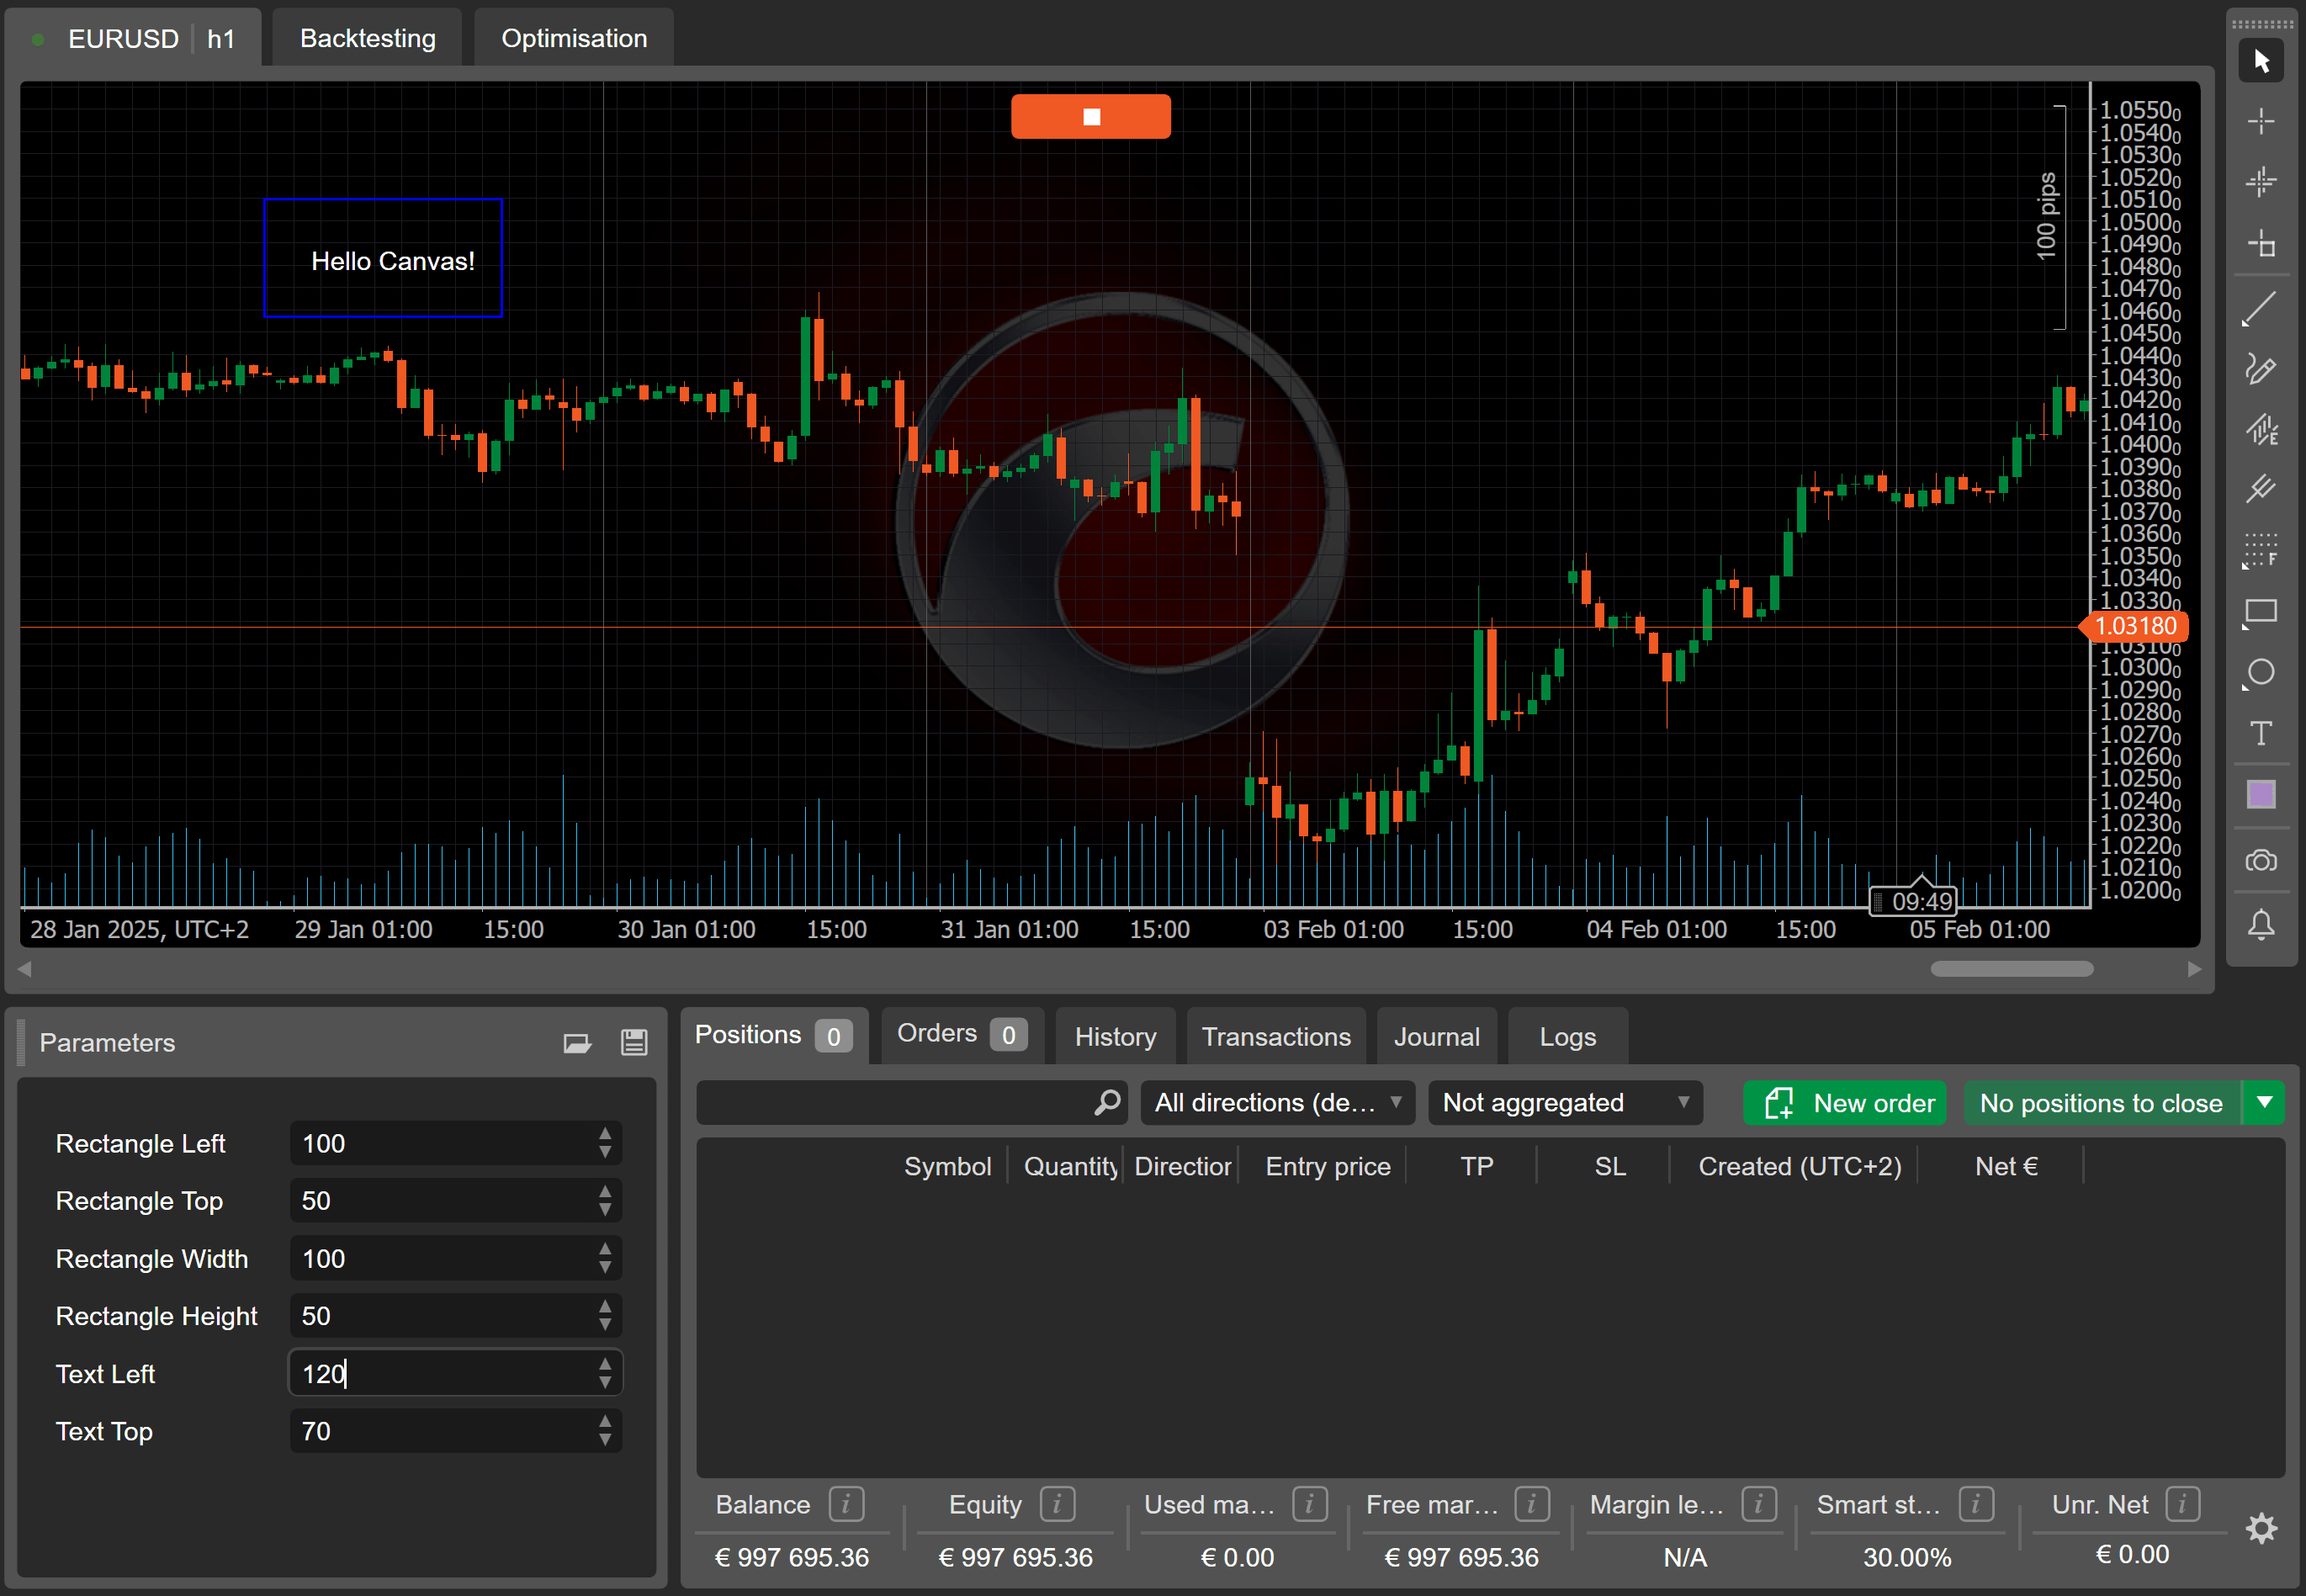
Run the cBot again, the customisable parameters for the rectangle and text should be visible.
You can enter new values for any parameter, and the changes will be reflected in the chart immediately.
Summary This article has shown you how to use the canvas control to draw objects on a trading chart and also implement customisable parameters for variables.
Subscribe to our YouTube channel