Range Bar Strategies in cTrader
A Range chart is built to represent a specified range of price movements regardless of how long it takes the price to make that movement. This filters out price movements that are smaller than the range size, making trends easier to visualise. In cTrader, the process for developing automated trading strategies that make decisions based on range bars is the same as the process for creating such strategies based on standard time-based candlesticks. In this article and its accompanying video, we will demonstrate how you can develop and backtest a simple strategy based on range bars.
Defining The Buy and Sell Signals
Let's briefly outline our trading logic.
- A 'buy' signal will occur when a bullish range bar that follows a bearish range bar and closes above the opening price of the bearish bar.
- A 'sell' signal will occur when a bearish range bar follows a bullish range bar and closes below the opening price of the bullish bar.
The interpretation of the 'buy' signal is that, when a bearish trend is met with strong resistance, it is time to buy in hopes for a rebound. The reverse setup applies to the 'sell' signal: a bullish trend is met with resistance, and we must capitalise on this by placing a 'sell' order.
Creating an Example cBot
At this point, we can start creating our cBot. We will first define the necessary parameters.
1 2 3 4 5 6 7 8 | |
We can code our 'buy' signal as follows.
1 2 3 4 | |
Our 'sell' signal looks as follows.
1 2 3 4 | |
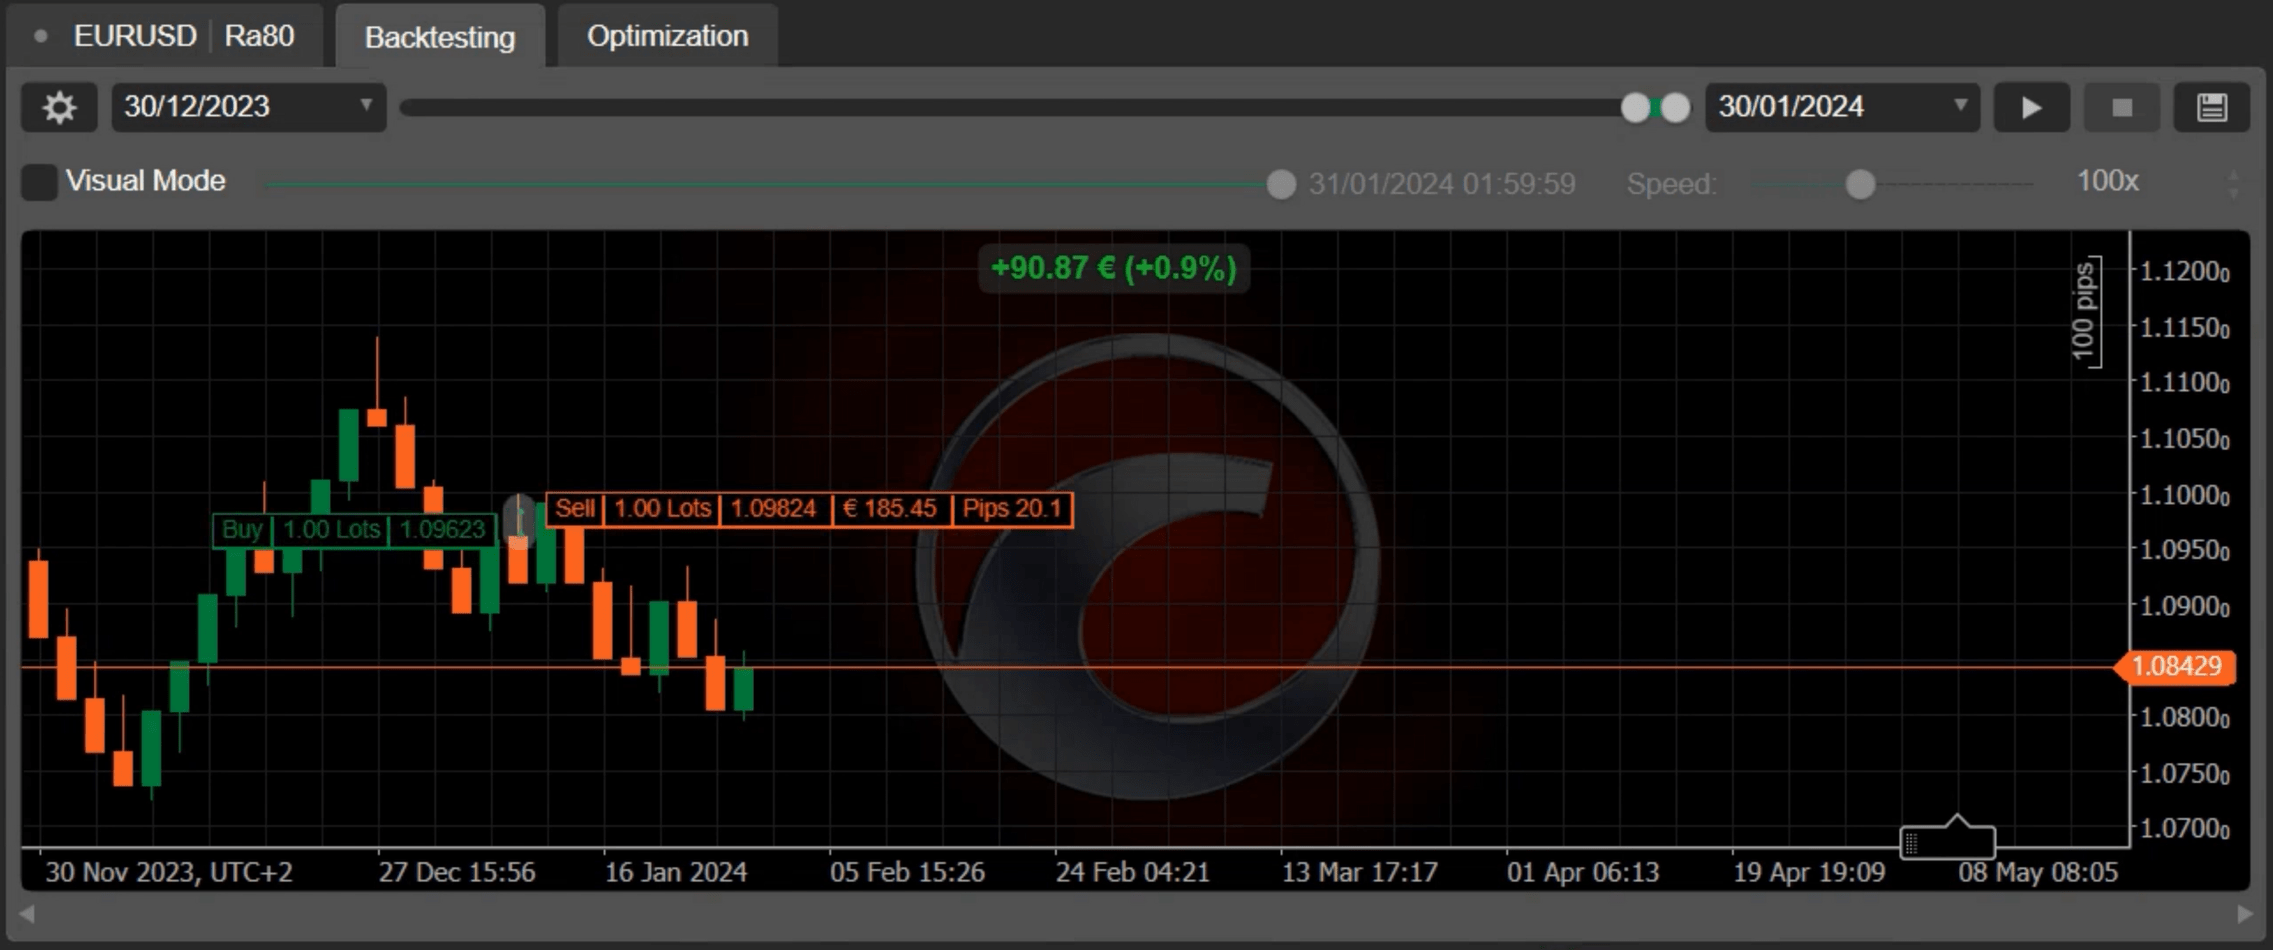
Backtesting Our Strategy
After building and backtesting our new bot, we can switch to the 'Backtesting' tab and run a backtest. Here are its results.
Note
Range bar strategies use the same data structures as strategies based on candlesticks. For example, we used the Bars collection to retrieve our range bars; we would have used the same collection when trying to retrive candlesticks. This feature of cTrader allows you to develop strategies that can be tested and run on any chart type without the need for any modifications.
In this tutorial, we demonstrated how you can quickly develop a simple strategy based on range charts. We also suggested that such strategies can be freely reused on charts containing time-based candlesticks.