Backtest a cBot in cTrader
This article explains how to backtest trading bots in cTrader Windows and Mac.
Backtesting is a tool for evaluating cBots by allowing them to trade on historical market data under certain pre-defined conditions.
When backtesting, you can run a cBot instance on past market movements. Afterward, cTrader will generate a detailed report about the trading operations performed by your cBot and the final equity/balance statistics.
Note
Any trading actions performed when backtesting cBots will not affect any of your accounts. Backtesting is not intended to deal with any real funds. Instead, this feature only exists for analysis purposes.
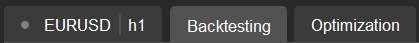
To backtest a cBot, select one of its instances and switch to the Backtesting tab.
Backtesting settings
To set up how backtesting works, click the cog icon located in the upper-left corner. cTrader should open the following menu.
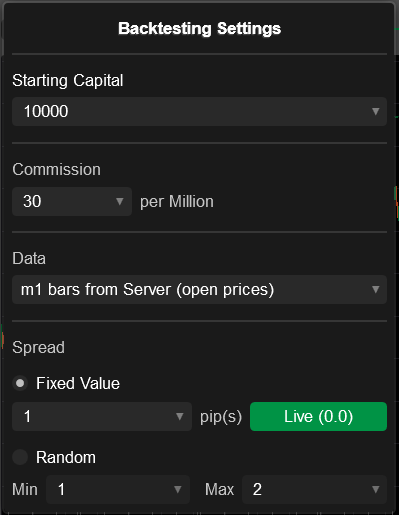
The options in this menu are defined as follows. All money-related parameters (such as the starting capital) are specified in USD.
| Option name | Action and description |
|---|---|
| Starting capital | Define the starting capital with which your cBot will operate when trading. |
| Commission | Establish the commission rate per million traded units. |
| Data | Choose which timeseries data that your cBot will be tested on. The available options are as follows.
|
| Spread | Select the spread value(s) that will be applied during backtesting. The following options are available.
|
Sample CSV M1 data
To source trading data from your local machine, make sure to create a comma-separated CSV file containing the following data:
- Date
- Time
- Open price
- High price
- Low price
- Close price
- Volume
Example
1 2 3 4 | |
Backtesting procedure and modes
Specify the backtest duration using the controls summarised below:
- Use the interactive slider at the top of the Backtesting tab.
- Select the necessary values from the calendar menus to the left and right of the slider.
- Input custom values (using the
DD:MM:YYYYformat) into the fields on both sides of the slider.

You can run backtesting using the following modes:
- Non-real-time testing: Your bot performs all of the required operations in sequence; afterwards, you only have access to the final results including trading statistics, the equity chart, etc.
- Real-time (visual mode) testing: The historical data you have provided is passed to your cBot at a certain playback speed that you can customise. As a result, you can see trading operations as they are placed. All trading statistics are also updated at the playback speed you have chosen.
Non-real-time testing
After setup is finished, click the Play button to the right of the slider. Depending on the length of the specified period (backtest duration) and your local machine specs, you may need to wait several minutes before cTrader generates the results.
Real-time (visual mode) backtesting
Specify the required settings including the testing period (backtest duration) and enable the Visual mode flag located below the calendar slider.

Adjust the data playback speed by dragging the Speed slider or using the menu to its right. After you are finished setting up, click the Play button.
cTrader will then start displaying a trading chart for the chosen period in real-time, accelerated using your playback speed setting. Note that you can adjust the playback speed dynamically as backtesting occurs.
Depending on its code, your cBot will also perform trading operations in real-time reacting to the technical analysis signals that materialise in the chart. The backtesting statistics will be automatically updated based on the actions taken by your cBot.
Depending on your chosen period and the playback speed, visual mode testing may be time-consuming. Nonetheless, if your cBot is not behaving as expected, you can test its reactions to various market conditions by using visual mode testing and custom trading data sourced from a CSV file.
Backtest using Renko charts and range bars
cTrader supports backtesting cBots on Renko and range bar charts. To perform such a backtest, create a new cBot instance and select a Renko/range bar chart as the trading chart to which it is attached.
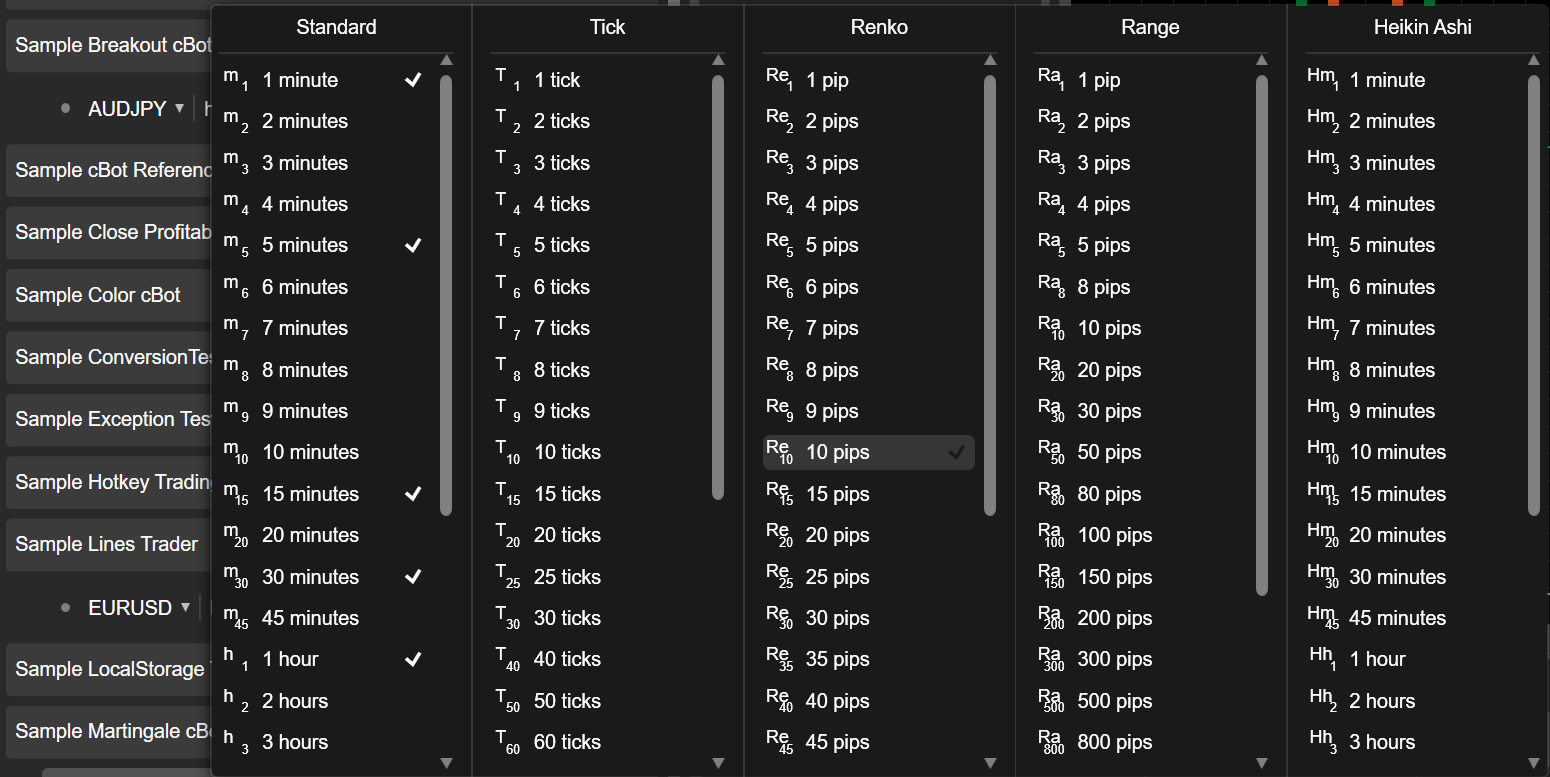
Alternatively, with a cBot instance already selected, use the chart selector menu at the top of the screen by clicking the More icon. In the menu that has appeared, select one of the available volume thresholds for generating Renko bricks or range bars.
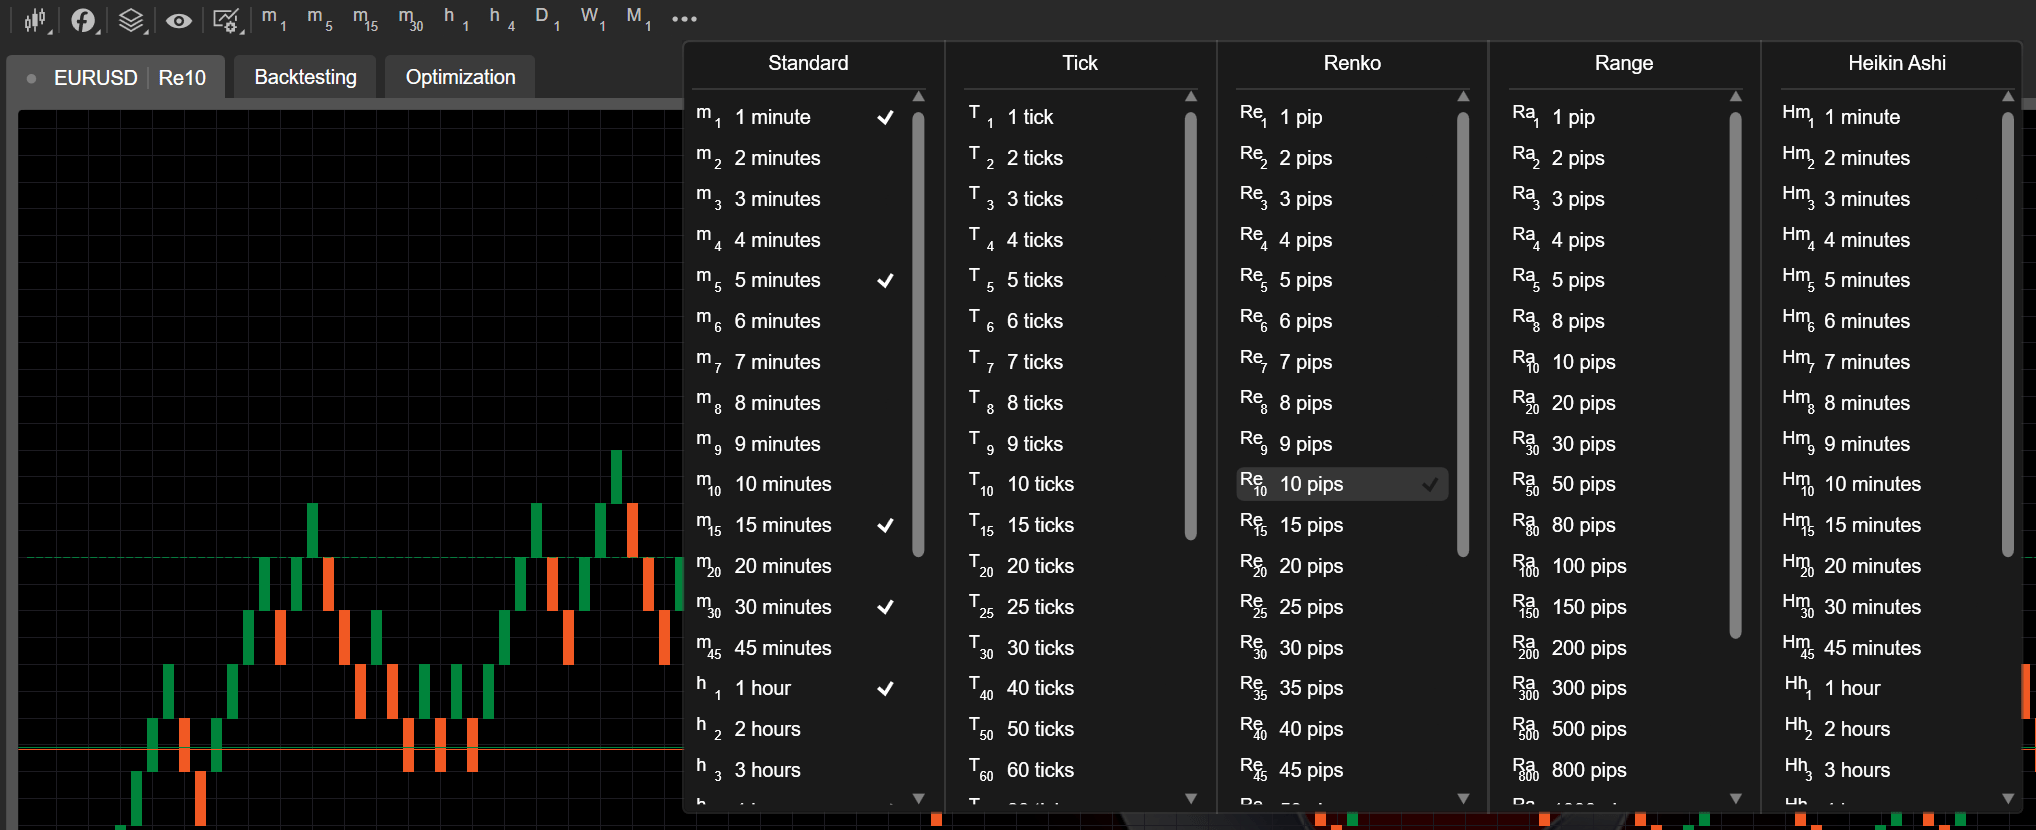
After cTrader generates a Renko/range bar chart for the chosen symbol, switch to the Backtesting tab. In it, configure the backtesting mode/settings as you normally would. Click the Play icon to perform a backtest on the chosen chart.
Backtesting results
cTrader generates several trading statistics to showcase backtesting results. To view this data, proceed to the tabs located just below the trading chart.
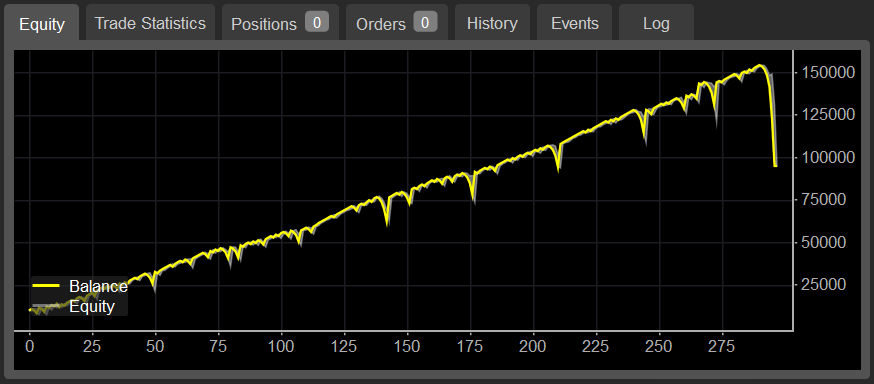
Equity
When backtesting is performed (regardless of whether you use visual mode), cTrader generates an equity chart with the number of trades on the X-axis and the account balance on the Y-axis. It contains the following statistics:
- The yellow line showcases the account balance as it changes with each trade.
- The grey zone highlights how total equity increases or decreases depending on the trades made by your bot.
To get a better idea of what the equity chart does, consider the example above. It shows that our bot has performed more than 290 trades during backtesting. With each change in the account balance, we can also see a corresponding change in total equity.
Trade statistics
The Trade statistics tab contains data on exactly how your cBot has performed throughout backtesting. It includes the following fields.
| Field name | Definition |
|---|---|
| Net profit | The total net profit of all trades. |
| Profit factor | The ratio calculated by dividing the total net profit by the total net loss. |
| Commission | The total amount of commissions paid for the trades made by your cBot. |
| Max balance drawdown | The maximum amount of the balance drop-down. |
| Max equity drawdown | The maximum amount of the equity drop-down. |
| Total trades | The total number of trades performed by your cBot. |
| Winning trades | The total number of trades that have resulted in realised profits. |
| Max consecutive winning trades | The largest number of consecutive trades that have generated realised profits. |
| Largest winning trade | The largest realised profit generated by one trade. |
| Losing trades | The total number of trades that have generated realised losses. |
| Max consecutive losing trades | The largest number of consecutive trades that have generated realised losses. |
| Largest losing trade | The large amount of realised losses generated by one trade. |
| Average trade | The average realised P&Ls generated by all trades. |
Positions
The Positions tab showcases all positions that are currently open by your cBot. It is structured similarly to the Positions tab in the regular Trade Watch display and contains the same data.
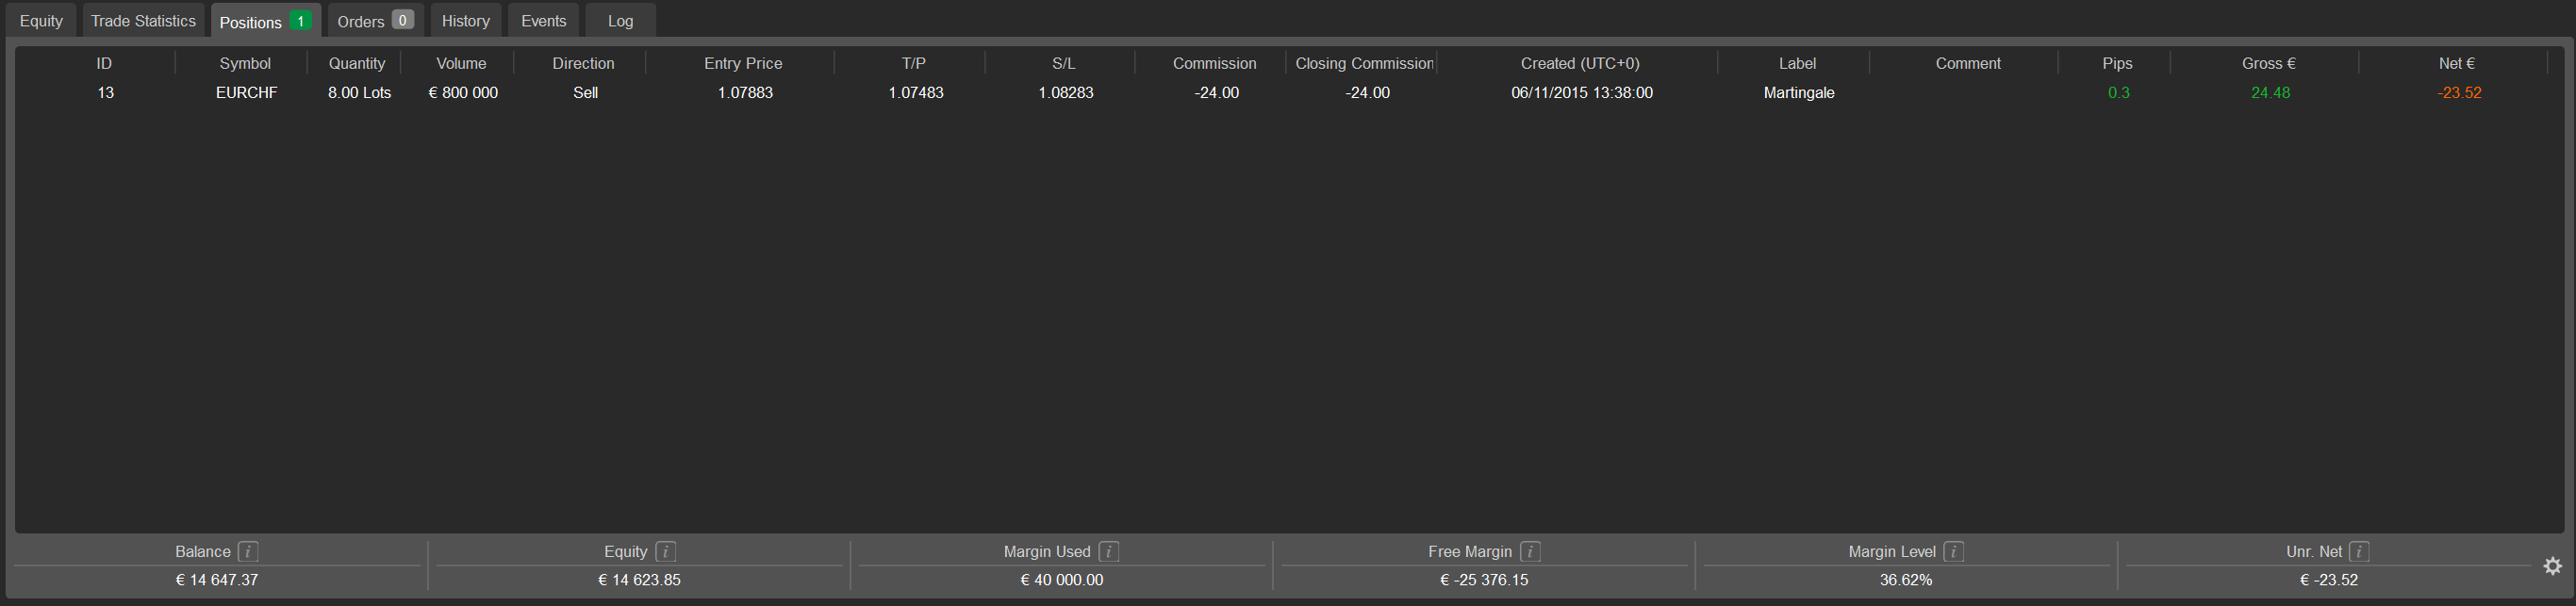
Click the cog icon in the lower-right corner to customise what data is displayed in the central table.
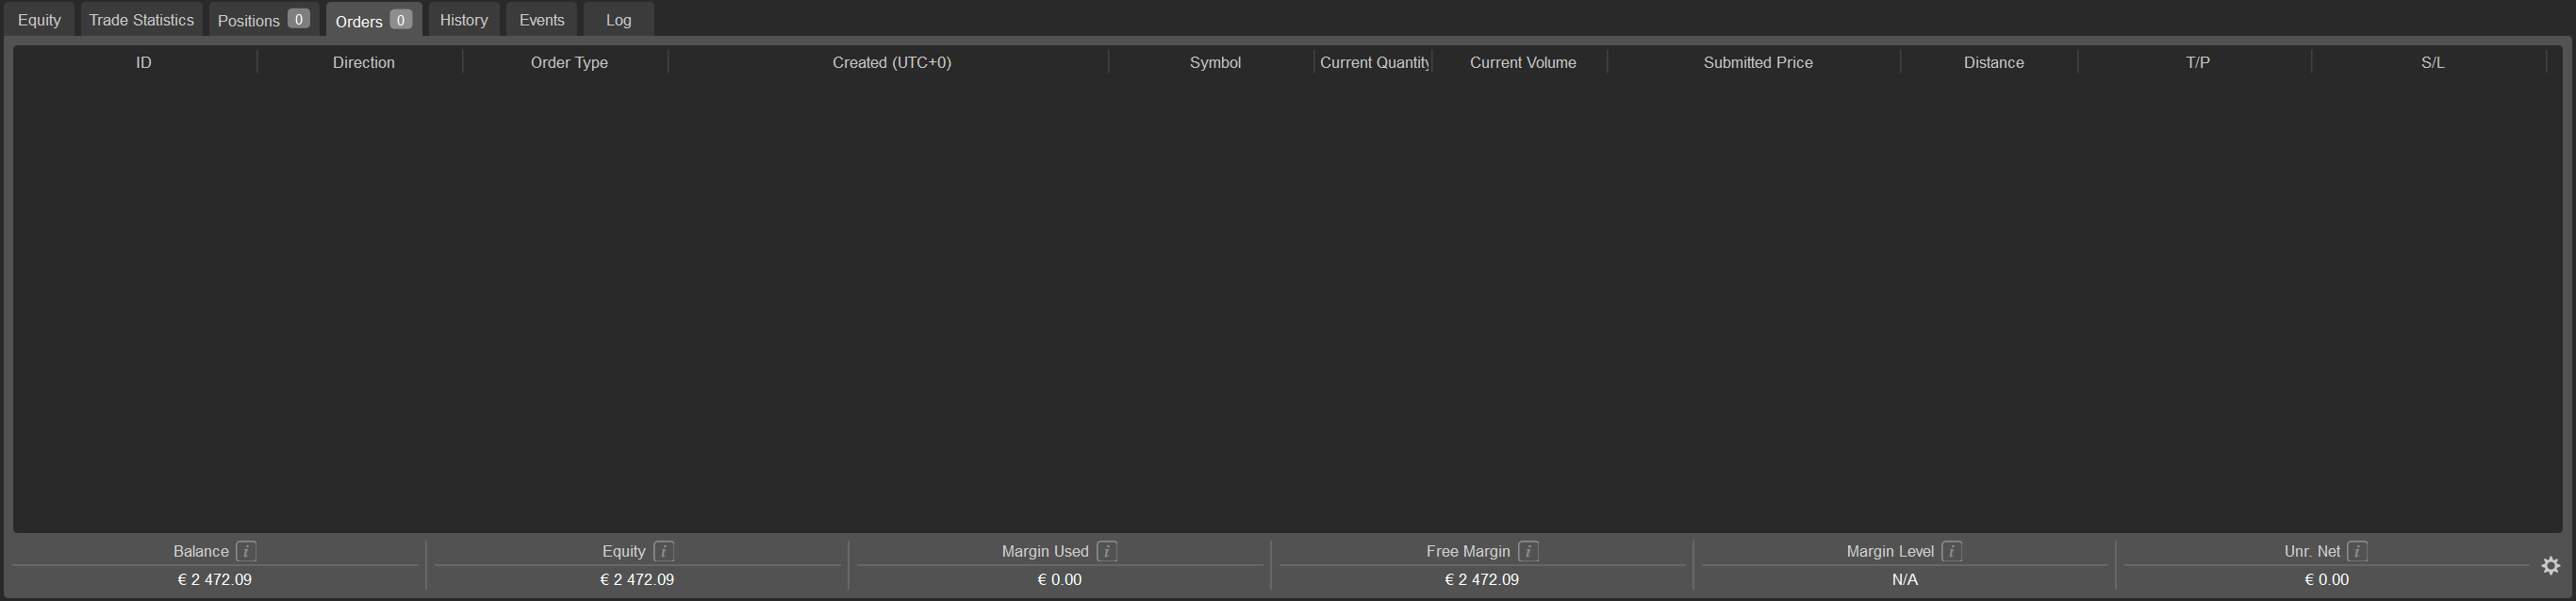
Orders
The Orders tab contains information about the orders that have been placed by your cBot. Its structure and appearance copy the Orders tab in the main Trade Watch display.
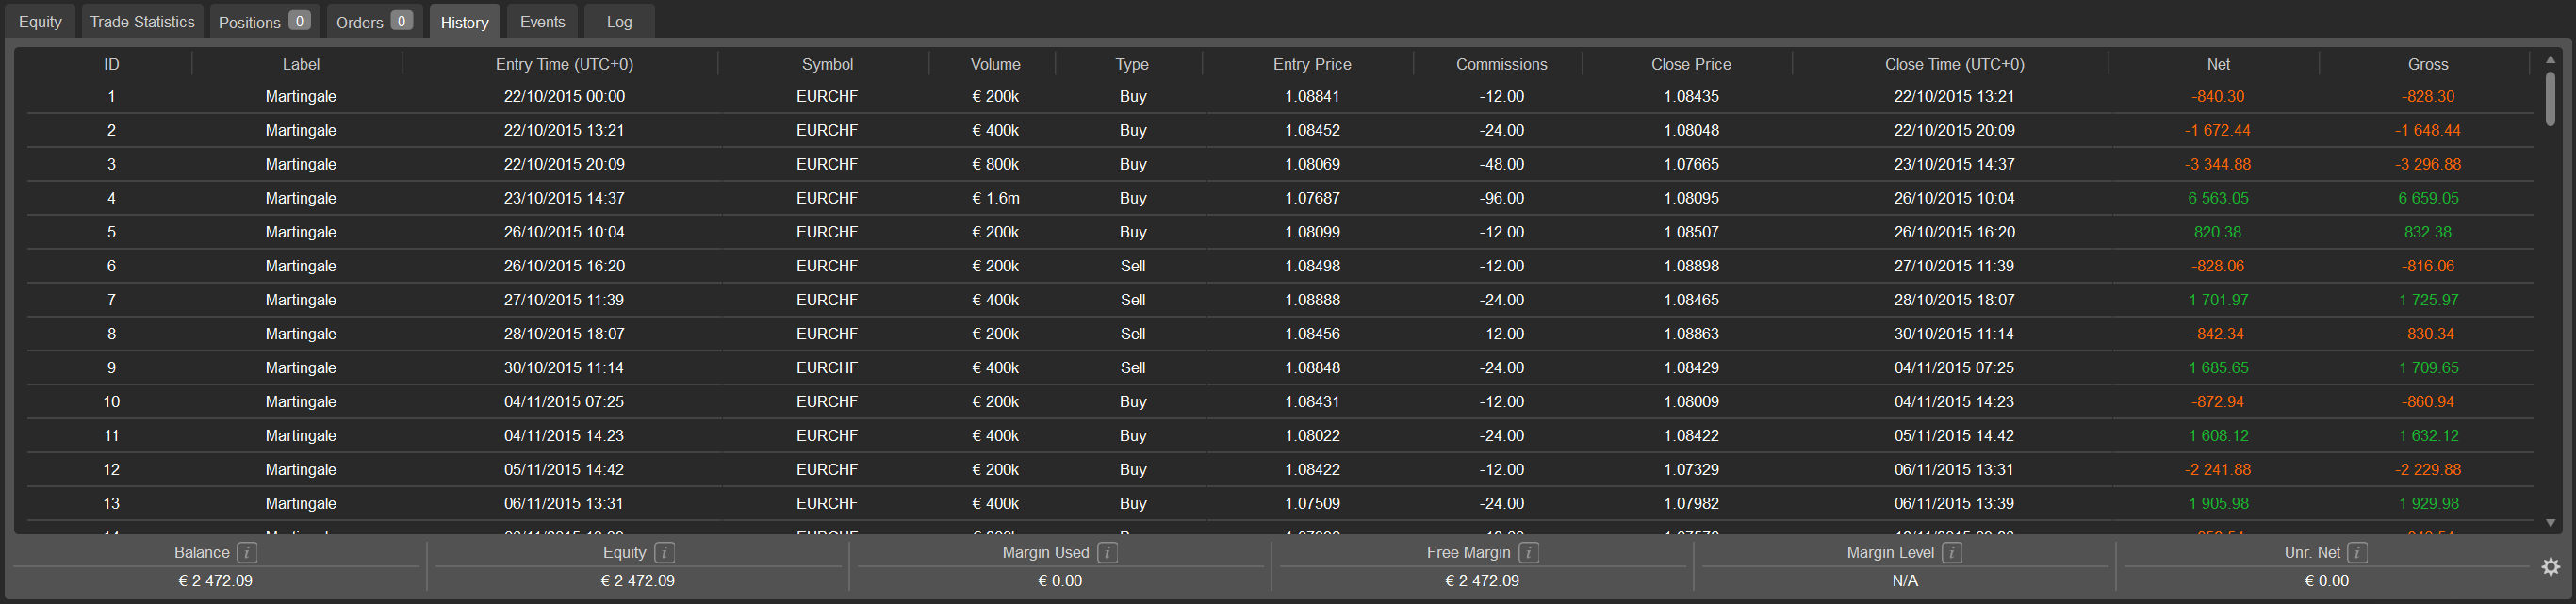
History
The History tab displays statistics on all opening and closing deals that have been recorded during backtesting. Similarly to other tabs discussed above, it copies the History tab in the Trade Watch display.
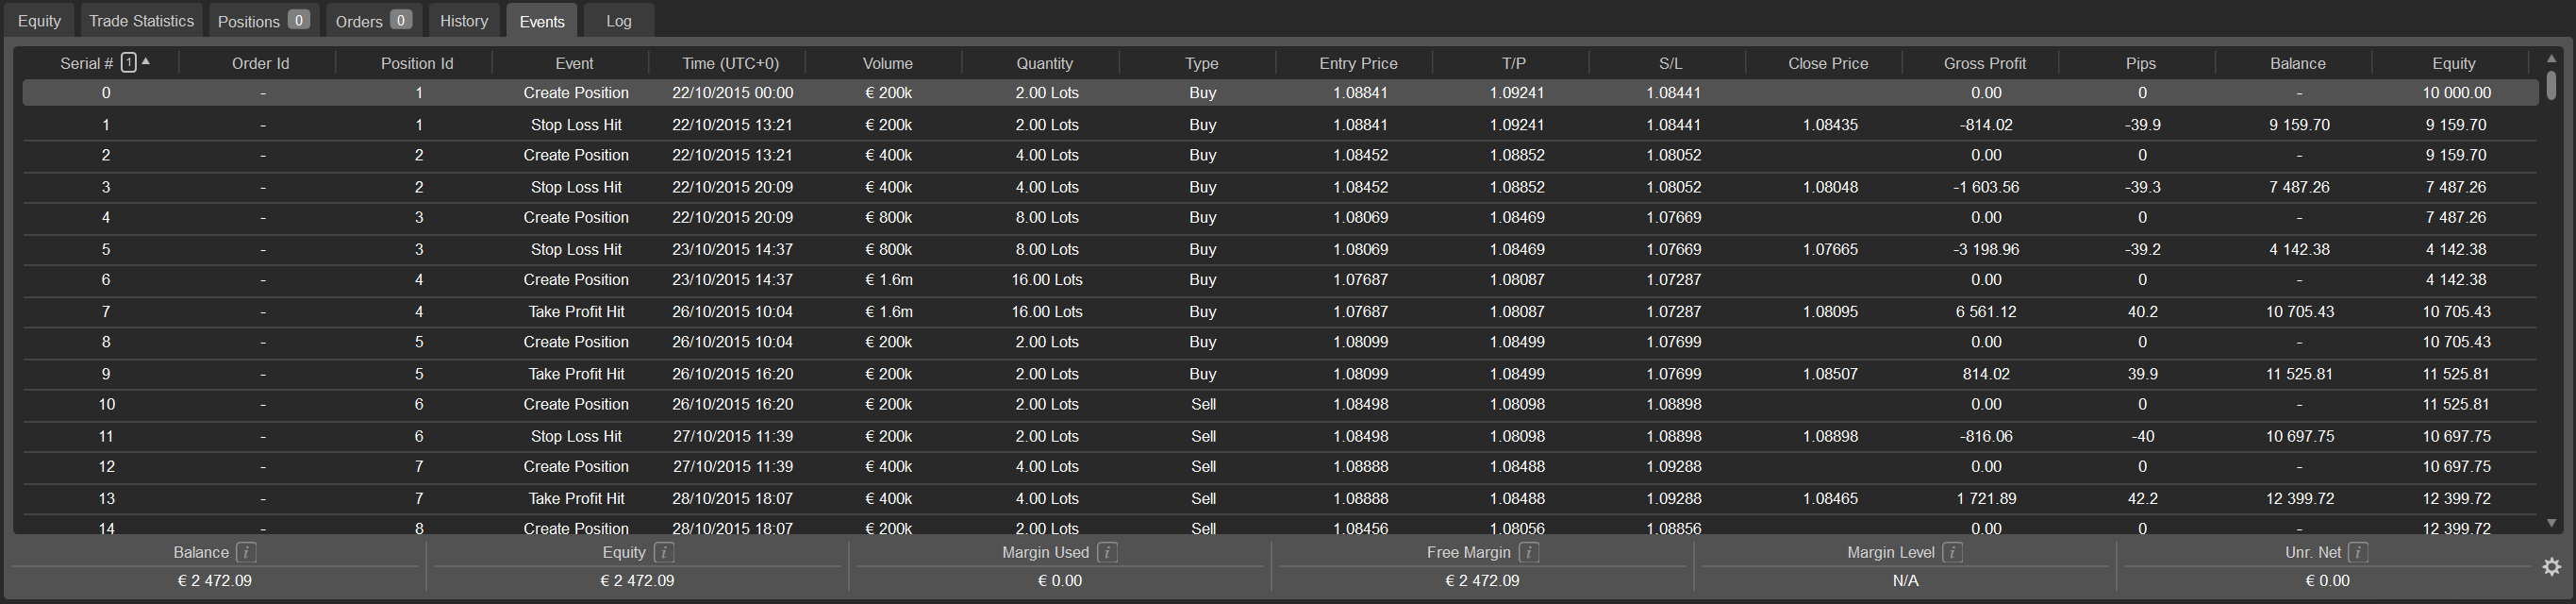
Events
The Events tab lists all server-related communications and displays various parameters of these events.
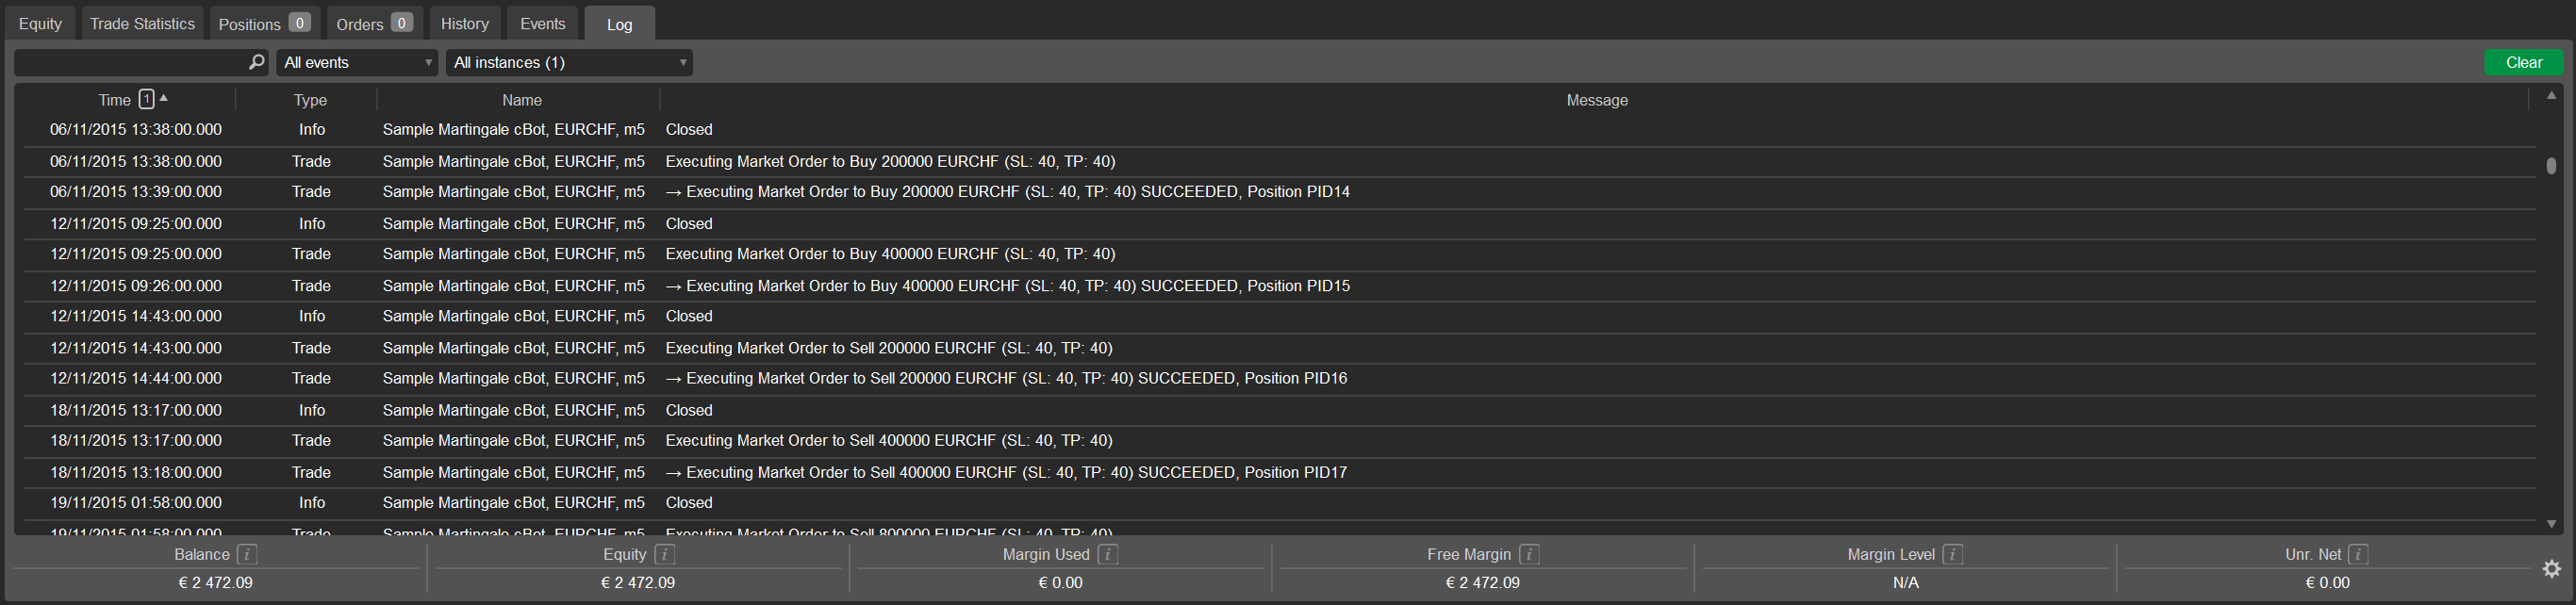
Log
Lastly, the Log tab displays your cBot output throughout backtesting. The list of messages is fully searchable and filterable by event type and instance.
HTML report
An .html report contains full information about a finished backtesting operation. This file provides evidence of the results a cBot delivers over a historical period.
Click the Save icon in the top-right corner, then choose a location on your local disk to save the .html file.
![]()
You can open the .html file in any web browser, such as Google Chrome, Mozilla Firefox or Microsoft Edge.
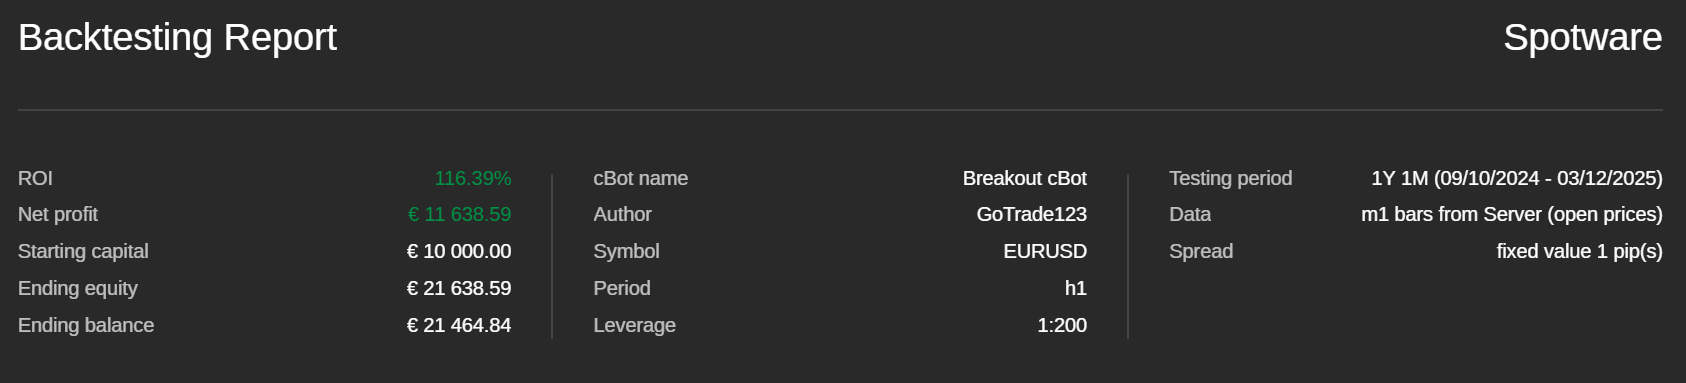
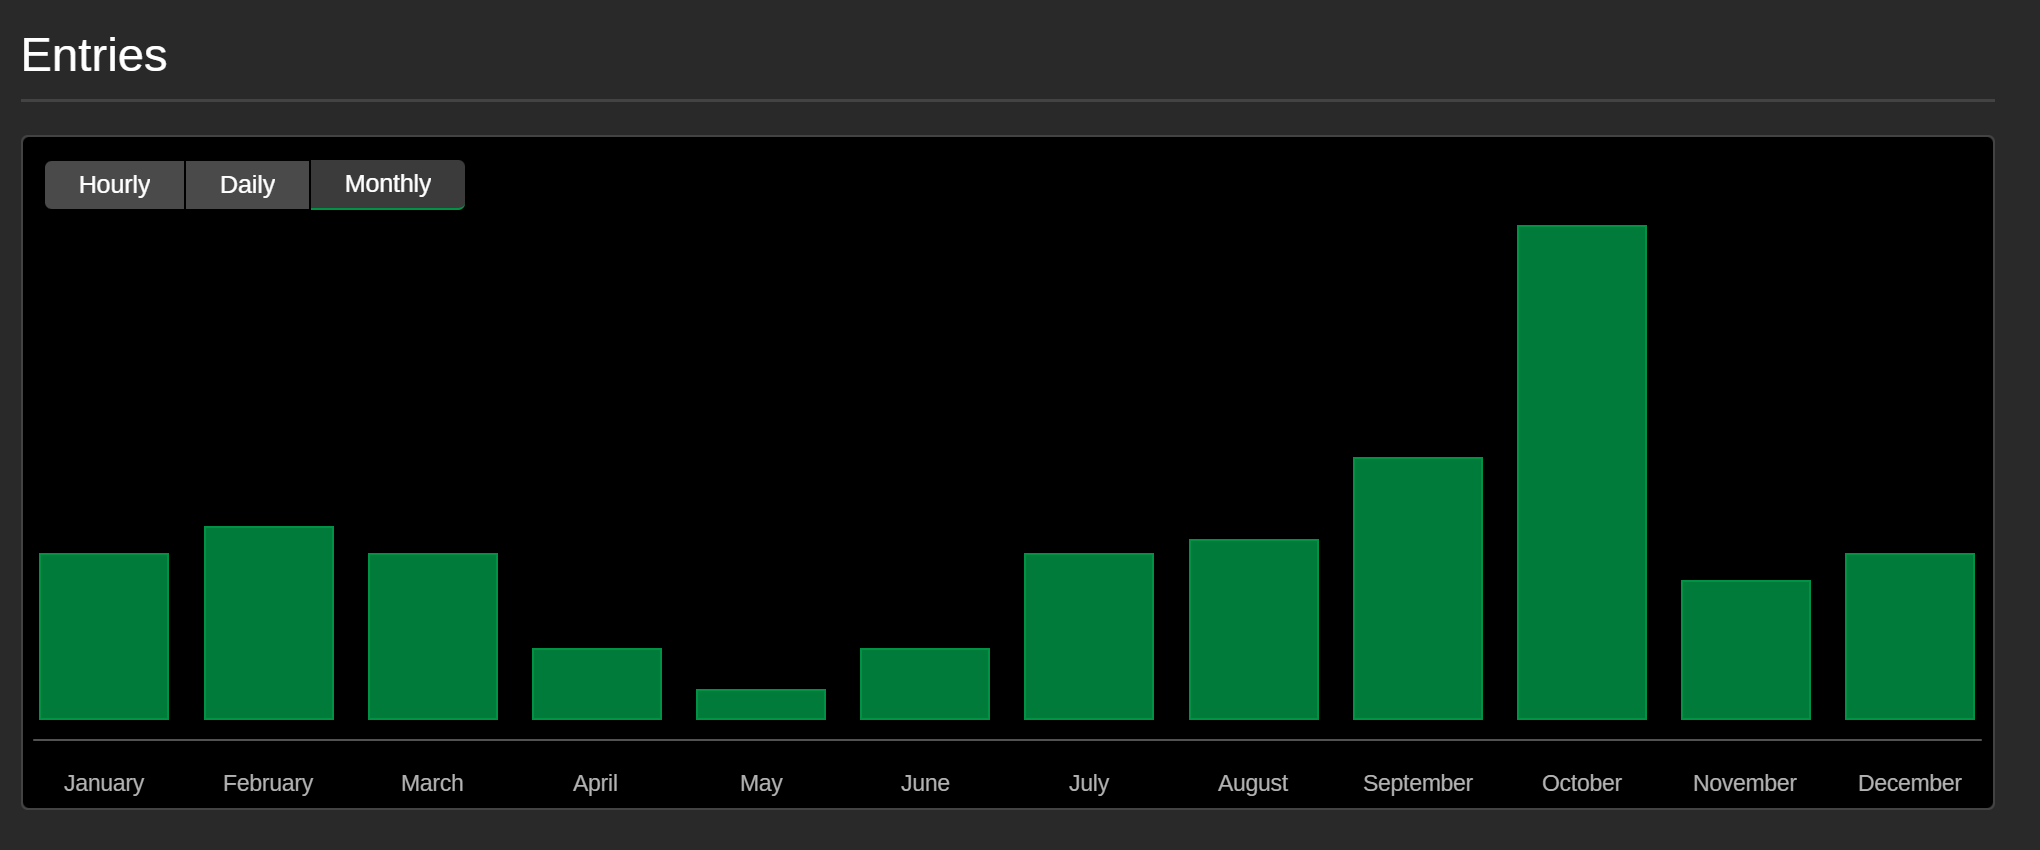
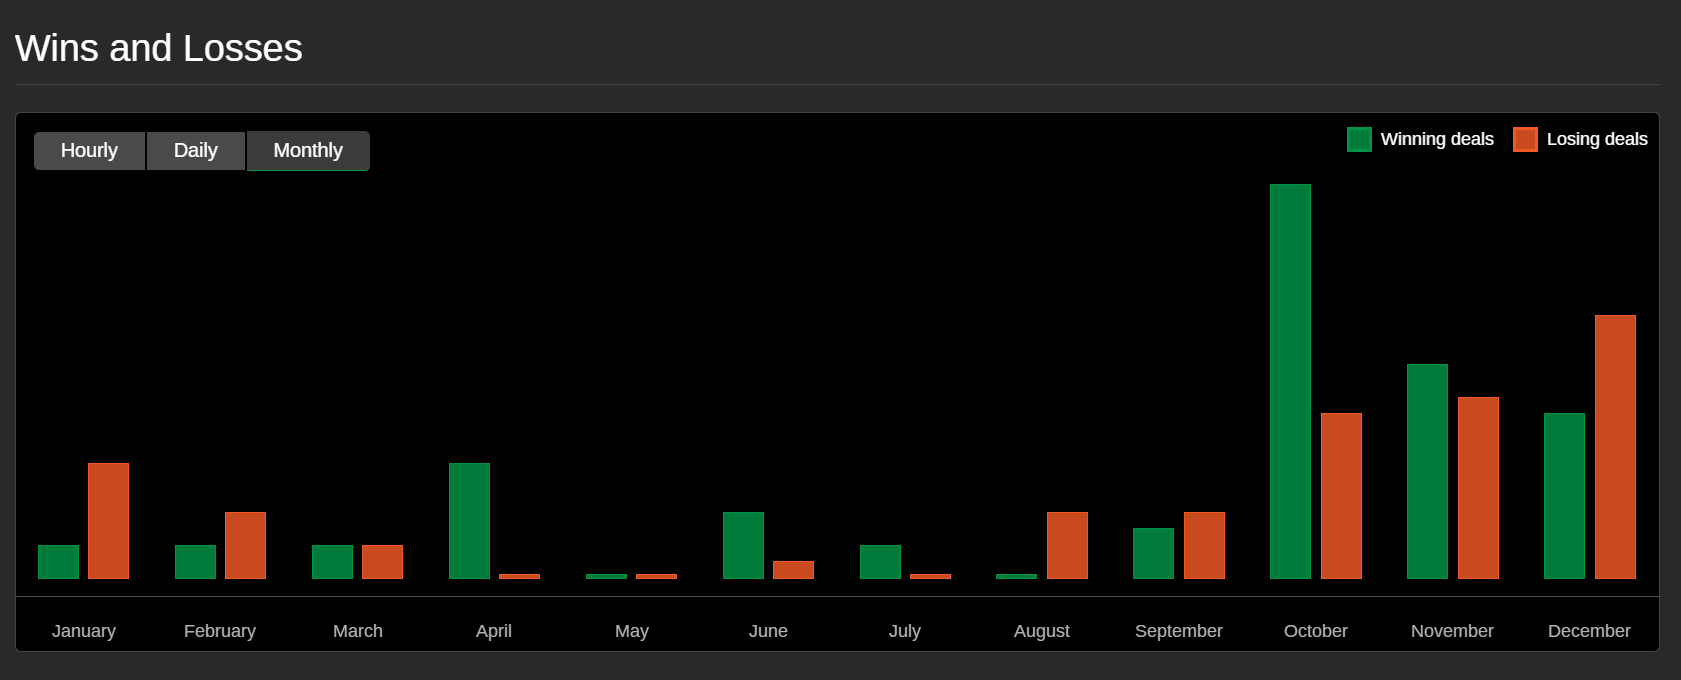
Most sections in the report are identical to the tabs displayed under the chart during backtesting. Additional sections include ROI, Entries and Wins and losses.
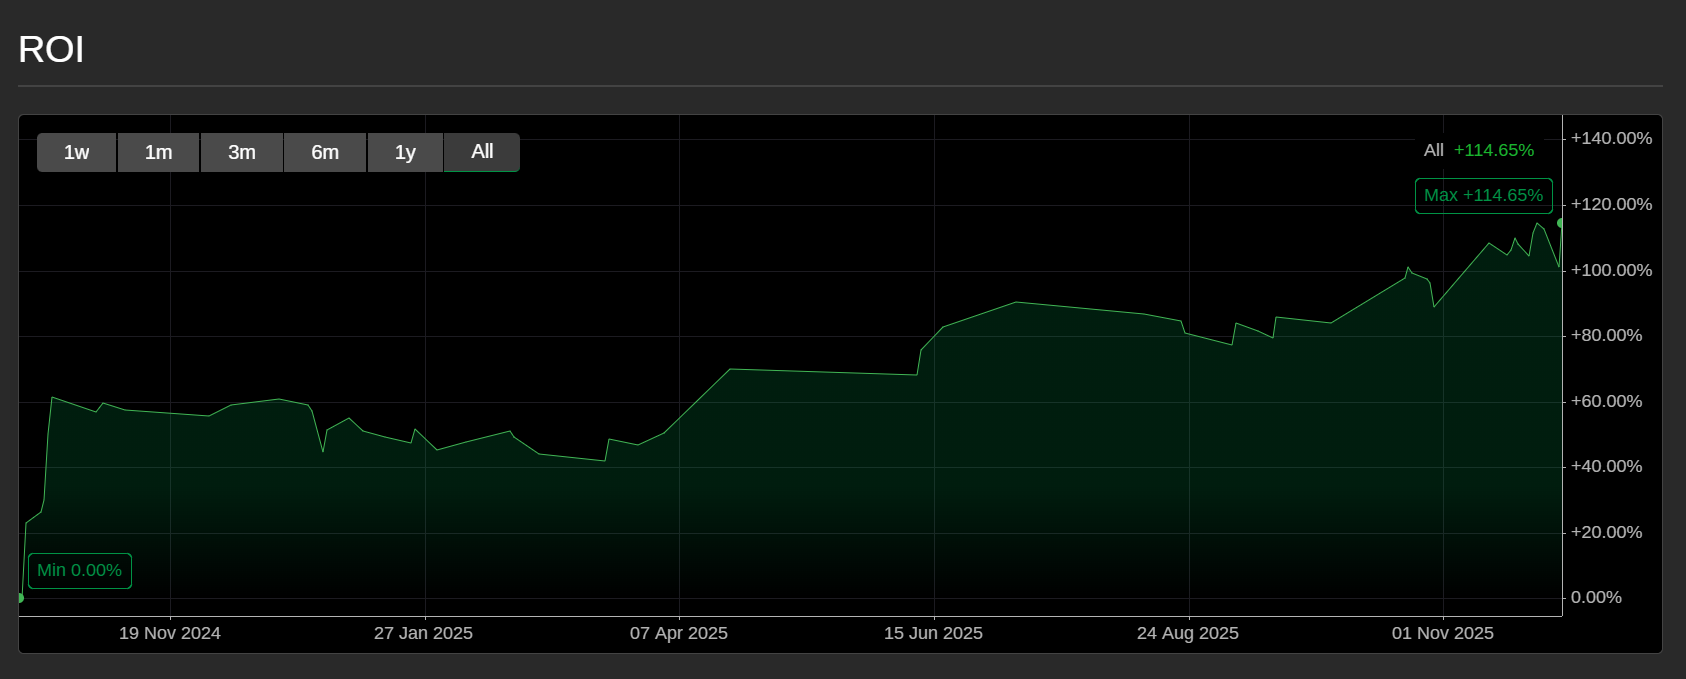
ROI – a graphical representation of the investment return over time.
Entries – a bar chart showing the number of trades executed over time.
Wins and losses – a double bar chart showing winning and losing trades over time.
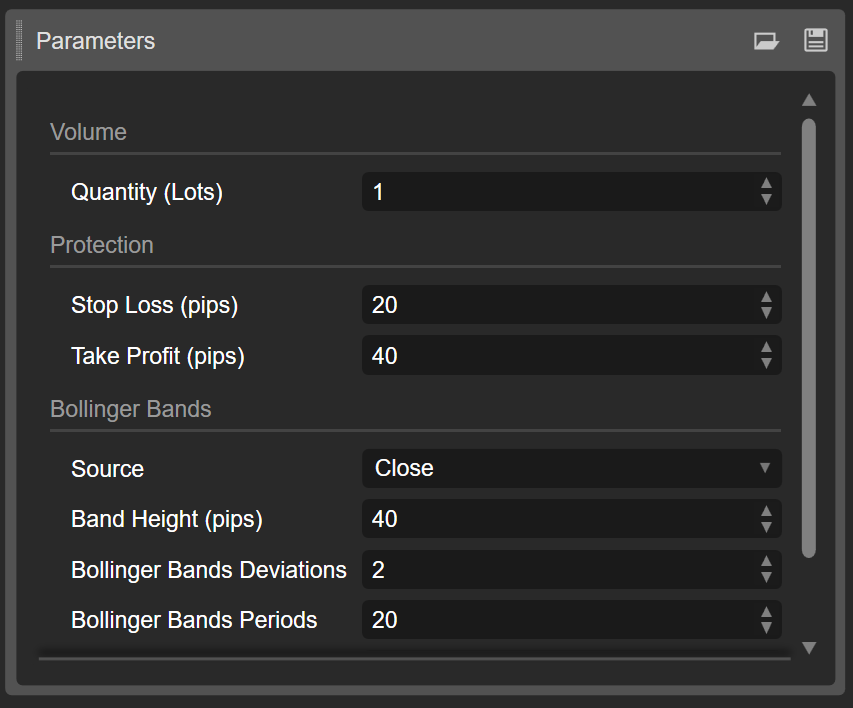
CBOTSET file
A .cbotset file contains specific values for the customisable parameters of a cBot. This file can be used to quickly populate the parameter fields in cTrader Windows or Mac before starting, backtesting or optimising a cBot.
Click the Save icon in the top-right corner of the Parameters section, then choose a location on your local disk to save the .cbotset file.