Indicator code samples
This page provides several Python and C# code examples for creating technical indicators used for manual or algorithmic trading.
Indicator sample repositories
Comprehensive indicator code samples, including ready-to-run templates for various indicator types and technical analysis tools, are available in separate Python and C# repositories in GitHub.
Simple indicators
The high minus low indicator calculates the difference between the high and low prices of the current bar and displays it in an output series. The series is drawn on the chart as a line connecting the resulting values in each bar.
1 2 3 4 5 6 7 8 9 10 11 | |
Note
Python indicators use customisable parameters declared in their .cs files.
1 2 3 4 5 6 7 | |
The [Indicator...] declaration includes several parameters which are defined as follows:
IsOverlay- a boolean that defines whether the line will be overlayed on the chart or displayed in a separate UI panel.TimeZone- aTimeZonesclass field that specifies the timezone of the indicator data and the server time.AccessRights- anAccessRightsclass field that determines the access rights allocated to your indicator.ScalePrecision- an int setting up the scale precision of the indicator output.
As you learned previously when editing the indicator code, the Output attribute is declared to mark a property as an indicator output. This property should be public so that it can be referenced by other classes.
Indicator output should always be of the IndicatorDataSeries data type which is a list of doubles that can be indexed like an array. Therefore, the value at each [index] in the list Result can be assigned in the Calculate method as follows.
1 2 3 4 | |
1 2 | |
Indicators with parameters
In most cases, the output of indicators can vary depending on user input. The way customisable parameters are set up for indicators is similar to how this is done for cBots.
The below simple moving average indicator is designed to accept a price source and a period as customisable parameters. Such parameters (Source and Periods in this particular example) must be preceded by the Parameter attribute.
Similar to the [Indicator()] and [Output()] attributes discussed earlier, the [Parameter()] attribute can define certain characteristics applied to the user input.
1 | |
Note
Python indicators use customisable parameters declared in their .cs files.
Above, we specify the following characteristics:
- The name displayed to denote this parameter in the cTrader UI (
"MA Periods"). - The default value of the parameter; it can be changed by the user when customising an instance (
DefaultValue = 14) - The minimum and maximum parameter values (
MinValue = 1, MaxValue = 20)
In the following snippet, we show how customisable parameters can be integrated into indicator code.
1 2 3 4 5 6 7 8 9 10 11 12 13 14 15 16 17 18 19 20 21 22 23 24 25 26 27 28 29 | |
Note
Python indicators use customisable parameters declared in their .cs files.
1 2 3 4 5 6 7 8 | |
Nested indicators
Nested indicators are defined as indicators the value of which depends on the results of calculations performed by other indicators. They are useful when writing certain types of extensions such as the DeMark 9 indicator. Consider the following sample code:
1 2 3 4 5 6 7 8 9 10 11 12 13 14 15 16 17 18 19 20 21 22 23 24 25 26 27 28 29 30 31 32 33 | |
Note
Python indicators use customisable parameters declared in their .cs files.
1 2 3 4 5 6 7 8 9 10 11 12 13 14 15 16 17 | |
In the example above, deMinMA and deMaxMA are two variables used for calculating the value of our DeMarker indicator.
Nested indicators need to be defined in the Initialize() method. For example, deMinMA is defined as the simple moving average of the series deMin.
1 | |
1 | |
deMin, in turn, is defined in the Calculate() method as the maximum of the last two low price values.
1 | |
1 | |
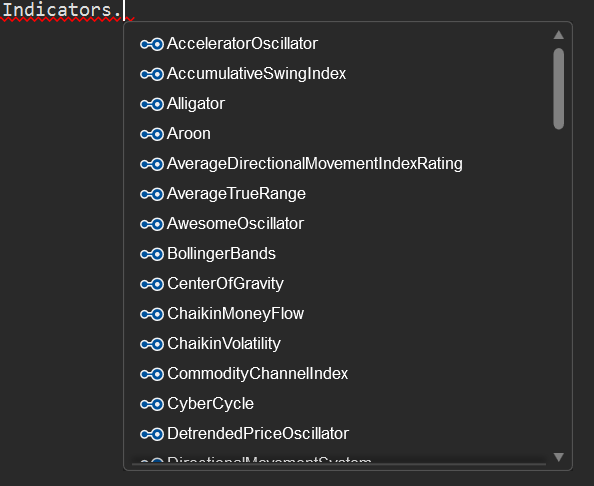
To simplify working with nested indicators, IntelliSense automatically populates the list of all built-in indicators when you type Indicators followed by a dot into the code editor. It will also display all related input parameters once you select a certain indicator from this list.
Lazy loading
cTrader Algo uses lazy loading when you use referenced indicators. The values supplied by the referenced indicator are not calculated until your code starts actively using them.
If you access the Outputs data of a referenced indicator, cTrader will start loading the indicator data by calling its Calculate() method on past and future bars. In any other case, the referenced indicator will remain idle and, therefore, will not consume any system resources.
This also means that if your indicator does not have any Output or if you try to access any of its public properties, you will get the default value of the property in question. To resolve this issue, call the Calculate() method of your custom indicator from the Calculate() method of the current indicator.
Oscillators and the levels attribute
The term "oscillators" encompasses all indicators that oscillate around a certain constant variable.
When creating oscillators, it is useful to first draw a horizontal or "level" line at that constant value; the indicator will then oscillate around this line. In many cases, the constant value equals zero.
In the example below, we define a momentum oscillator. It typically oscillates around the value of 100. We add a level line at this value using the Levels attribute which is declared prior to the indicator attributes.
1 2 3 4 5 6 7 8 9 10 11 12 13 14 15 16 17 18 | |
Note
Python indicators use customisable parameters declared in their .cs files.
1 2 3 4 | |
Note that the Levels attribute can only be used if the indicator is not overlayed on the chart, meaning that the IsOverlay property is not set to true. By default, the value of IsOverlay is false. If this attribute is omitted from your code, Levels should work properly.
If you need to establish multiple "level" lines, add a comma-separated list of values within the parenthesis as displayed below.
1 | |
1 | |
1 | |
Levels in Python Indicators
In Python you declare Levels in your indicator C# file same as C# indicators.
The IsLastBar property
In some cases, you may want to create an indicator that has to be calculated only for the last bar in the trading chart. Simplifying this, the IsLastBar property can be used to check whether the index parameter of the Calculate() method is that of the last bar.
The below indicator is based on UTC time; however, it can display the last open time in New York and Tokyo.
1 2 3 4 5 6 7 8 9 10 11 12 13 14 15 16 17 18 19 20 | |
1 2 3 4 5 6 7 8 9 10 11 12 13 | |
Combining indicators
cTrader allows for combining multiple indicators in the same panel or within the same chart.
The following indicator combines the Aroon, RSI and directional movement system indicators in one.
1 2 3 4 5 6 7 8 9 10 11 12 13 14 15 16 17 18 19 20 21 22 23 24 25 26 27 28 29 30 31 32 33 34 35 36 37 38 39 40 41 42 43 44 45 46 47 48 49 50 51 | |
Note
Python indicators use customisable parameters declared in their .cs files.
1 2 3 4 5 6 7 8 9 10 11 12 13 14 15 16 17 18 19 | |
Multiple timeframes
-
Using multiple timeframes
The following example displays a moving average indicator on different timeframes.
 1
 2
 3
 4
 5
 6
 7
 8
 9
10
11
12
13
14
15
16
17
18
19
20
21
22
23
24
25
26
27
28
29
30
31
32
33
34
35
36
37
38
39
40
41
42
43
44
45
46
[Indicator(IsOverlay = true, TimeZone = TimeZones.UTC)]
public class MultiTF_MA : Indicator
{
    [Parameter(DefaultValue = 50)]
    public int Period { get; set; }

    [Output("MA", LineColor = "Yellow")]
    public IndicatorDataSeries MA { get; set; }

    [Output("MA5", LineColor = "Orange")]
    public IndicatorDataSeries MA5 { get; set; }

    [Output("MA10", LineColor = "Red")]
    public IndicatorDataSeries MA10 { get; set; }

    private Bars bars5;
    private Bars bars10;

    private MovingAverage ma;
    private MovingAverage ma5;
    private MovingAverage ma10;

    protected override void Initialize()
    {
        bars5 = MarketData.GetBars(TimeFrame.Minute5);
        bars10 = MarketData.GetBars(TimeFrame.Minute10);

        ma = Indicators.MovingAverage(Bars.ClosePrices, Period, MovingAverageType.Triangular);
        ma5 = Indicators.MovingAverage(bars5.ClosePrices, Period, MovingAverageType.Triangular);
        ma10 = Indicators.MovingAverage(bars10.ClosePrices, Period, MovingAverageType.Triangular);
    }

    public override void Calculate(int index)
    {
        MA[index] = ma.Result[index];

        var index5 = bars5.OpenTimes.GetIndexByTime(Bars.OpenTimes[index]);
        if (index5 != -1)
            MA5[index] = ma5.Result[index5];

        var index10 = bars10.OpenTimes.GetIndexByTime(Bars.OpenTimes[index]);

        if (index10 != -1)
            MA10[index] = ma10.Result[index10];
    }
}
Note
Python indicators use customisable parameters declared in their
.csfiles.1 2 3 4 5 6 7 8 9 10 11 12 13 14 15 16 17 18 19 20 21 22 23 24 25 26 27
class MultiTF_MA(): def initialize(self): self.bars5 = api.MarketData.GetBars(TimeFrame.Minute5) self.bars10 = api.MarketData.GetBars(TimeFrame.Minute10) # Period is declared as a parameter in the C# file # We use indicator time frame bars for this moving average self.ma = Indicators.MovingAverage(api.Bars.ClosePrices, api.Period, MovingAverageType.Triangular) # We use other two time frame bars that we created previously # for these two moving averages self.ma5 = Indicators.MovingAverage(self.bars5.ClosePrices, api.Period, MovingAverageType.Triangular) self.ma10 = Indicators.MovingAverage(self.bars10.ClosePrices, api.Period, MovingAverageType.Triangular) def calculate(self, index): # MA, MA5, and MA10 are outputs we declared in the C# file api.MA[index] = self.ma.Result[index] index5 = self.bars5.OpenTimes.GetIndexByTime(api.Bars.OpenTimes[index]) if index5 > -1: api.MA5[index] = self.ma5.Result[index5] index10 = self.bars10.OpenTimes.GetIndexByTime(api.Bars.OpenTimes[index]) if index10 > -1: api.MA10[index] = self.ma10.Result[index10] -
Using multiple timeframes and symbols
The following example displays the moving average indicator on multiple timeframes and symbols.
1 2 3 4 5 6 7 8 9 10 11 12 13 14 15 16 17 18 19 20 21 22 23 24 25 26 27 28 29 30 31 32 33 34 35 36 37 38 39 40 41 42 43 44 45 46 47 48 49 50 51 52 53 54 55 56 57
[Indicator(IsOverlay = true, TimeZone = TimeZones.UTC)]
public class MultiSymbolMA : Indicator
{
    private MovingAverage ma1, ma2, ma3;
    private Bars bars2, bars3;
    private Symbol symbol2, symbol3;

    [Parameter(DefaultValue = "EURCHF")]
    public string Symbol2 { get; set; }

    [Parameter(DefaultValue = "EURCAD")]
    public string Symbol3 { get; set; }

    [Parameter(DefaultValue = 14)]
    public int Period { get; set; }

    [Parameter(DefaultValue = MovingAverageType.Simple)]
    public MovingAverageType MaType { get; set; }

    [Output("MA Symbol 1", LineColor = "Magenta")]
    public IndicatorDataSeries Result1 { get; set; }

    [Output("MA Symbol 2", LineColor = "Magenta")]
    public IndicatorDataSeries Result2 { get; set; }

    [Output("MA Symbol 3", LineColor = "Magenta")]
    public IndicatorDataSeries Result3 { get; set; }

    protected override void Initialize()
    {
        symbol2 = Symbols.GetSymbol(Symbol2);
        symbol3 = Symbols.GetSymbol(Symbol3);

        bars2 = MarketData.GetBars(TimeFrame, symbol2.Name);
        bars3 = MarketData.GetBars(TimeFrame, symbol3.Name);

        ma1 = Indicators.MovingAverage(Bars.ClosePrices, Period, MaType);
        ma2 = Indicators.MovingAverage(bars2.ClosePrices, Period, MaType);
        ma3 = Indicators.MovingAverage(bars3.ClosePrices, Period, MaType);
    }

    public override void Calculate(int index)
    {
        ShowOutput(Symbol, Result1, ma1, Bars, index);
        ShowOutput(symbol2, Result2, ma2, bars2, index);
        ShowOutput(symbol3, Result3, ma3, bars3, index);
    }

    private void ShowOutput(Symbol symbol, IndicatorDataSeries result, MovingAverage movingAverage, Bars bars, int index)
    {
        var index2 = bars.OpenTimes.GetIndexByTime(Bars.OpenTimes[index]);
        result[index] = movingAverage.Result[index2];

        string text = string.Format("{0} {1}", symbol.Name, Math.Round(result[index], symbol.Digits));
        Chart.DrawStaticText(symbol.Name, text, VerticalAlignment.Top, HorizontalAlignment.Right, Color.Yellow);
    }
}
Note
Python indicators use customisable parameters declared in their
.csfiles.1 2 3 4 5 6 7 8 9 10 11 12 13 14 15 16 17 18 19 20 21 22 23 24 25 26 27
class MultiSymbolMA():
    def initialize(self):
        # Symbol2 and Symbol3 are declared as parameters in the C# file
        self.symbol2 = api.Symbols.GetSymbol(api.Symbol2)
        self.symbol3 = api.Symbols.GetSymbol(api.Symbol3)

        self.bars2 = api.MarketData.GetBars(api.TimeFrame, self.symbol2.Name)
        self.bars3 = api.MarketData.GetBars(api.TimeFrame, self.symbol3.Name)

        self.ma1 = api.Indicators.MovingAverage(api.Bars.ClosePrices, api.Period, api.MaType)
        self.ma2 = api.Indicators.MovingAverage(self.bars2.ClosePrices, api.Period, api.MaType)
        self.ma3 = api.Indicators.MovingAverage(self.bars3.ClosePrices, api.Period, api.MaType)

    def calculate(self, index):
        # Result1, Result2, and Result3 are declared as outputs in the C# file
        self.show_output(api.Symbol, api.Result1, self.ma1, api.Bars, index)
        self.show_output(self.symbol2, api.Result2, self.ma2, self.bars2, index)
        self.show_output(self.symbol3, api.Result3, self.ma3, self.bars3, index)

    def show_output(self, symbol, result, movingAverage, bars, index):
        index2 = bars.OpenTimes.GetIndexByTime(api.Bars.OpenTimes[index])

        result[index] = movingAverage.Result[index2]

        text = f"{symbol.Name} {round(result[index], symbol.Digits)}"

        api.Chart.DrawStaticText(symbol.Name, text, VerticalAlignment.Top, HorizontalAlignment.Right, Color.Yellow)