Chart objects and drawings
Chart objects (drawings) allow for drawing lines or geometric shapes on cTrader charts. By using them, you can draw patterns or show certain events on charts based on your cBot or indicator data.
Chart objects use X and Y coordinates for positioning.
- The X-axis represents the chart time or bar indices.
- The Y-axis is the symbol price.
All chart objects are derived from the ChartObject base class, meaning that all of them inherit certain base features.
Chart objects code samples
Draw inside indicator windows
When creating chart objects you are not limited to the main symbol chart. In fact, you can draw chart objects inside any windows containing indicator outputs.
The Chart class has the IndicatorAreas collection. It contains all non-overlay or separate windows in which indicators can display their outputs.
You can also access your current indicator area by using the IndicatorArea property of your Indicator class.
1 2 3 4 5 6 7 8 9 10 11 12 13 14 15 16 17 | |
When you run an instance of the above indicator, you should see a red line in a separate indicator window. When creating charts in separate indicator areas, you can use all drawing methods as both Chart and IndicatorArea inherit from the ChartArea base class.
Static text
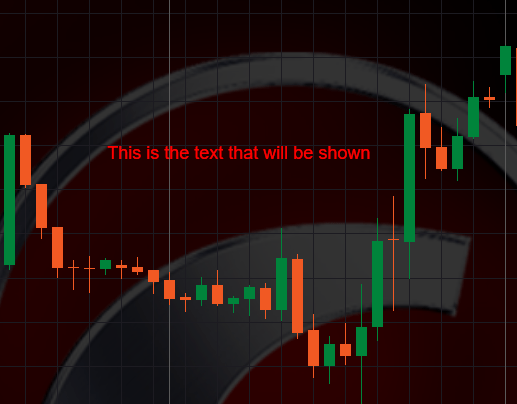
Instead of using X and Y coordinates for positioning, static text uses static horizontal and vertical alignments. To show or draw a static text, use the DrawStaticText() method.
1 | |
If you attach this chart object to an indicator and run an instance, you will see the following text in the main chart.
Vertical line
Use the DrawVerticalLine() method to draw a vertical line.
1 2 3 | |
Horizontal line
Use the DrawHorizontalLine() method to draw a horizontal line.
1 2 3 | |
Trend line
A trend line starts from a certain point in the chart and ends at another point. Trend lines are useful for creating different shapes or complex patterns.
To draw a trend line use the DrawTrendLine() method.
1 2 3 4 5 6 7 | |
Rectangle
Use the DrawRectangle() method to draw a rectangle.
1 2 3 4 5 6 7 | |
Triangle
Use the DrawTriangle() method to draw a triangle.
1 2 3 4 5 6 7 8 9 10 11 12 13 | |
Other chart objects
For the sake of brevity, we did not mention several other chart objects in the above code snippets. These objects include but are not limited to the following:
- Ellipse
- Icon
- Andrews Pitchfork
- Equidistant Channel
- Fibonacci Expansion
- Fibonacci Fan
- Fibonacci Retracement
All of these objects can be drawn using similarly-named Draw...() methods accepting similar parameters.
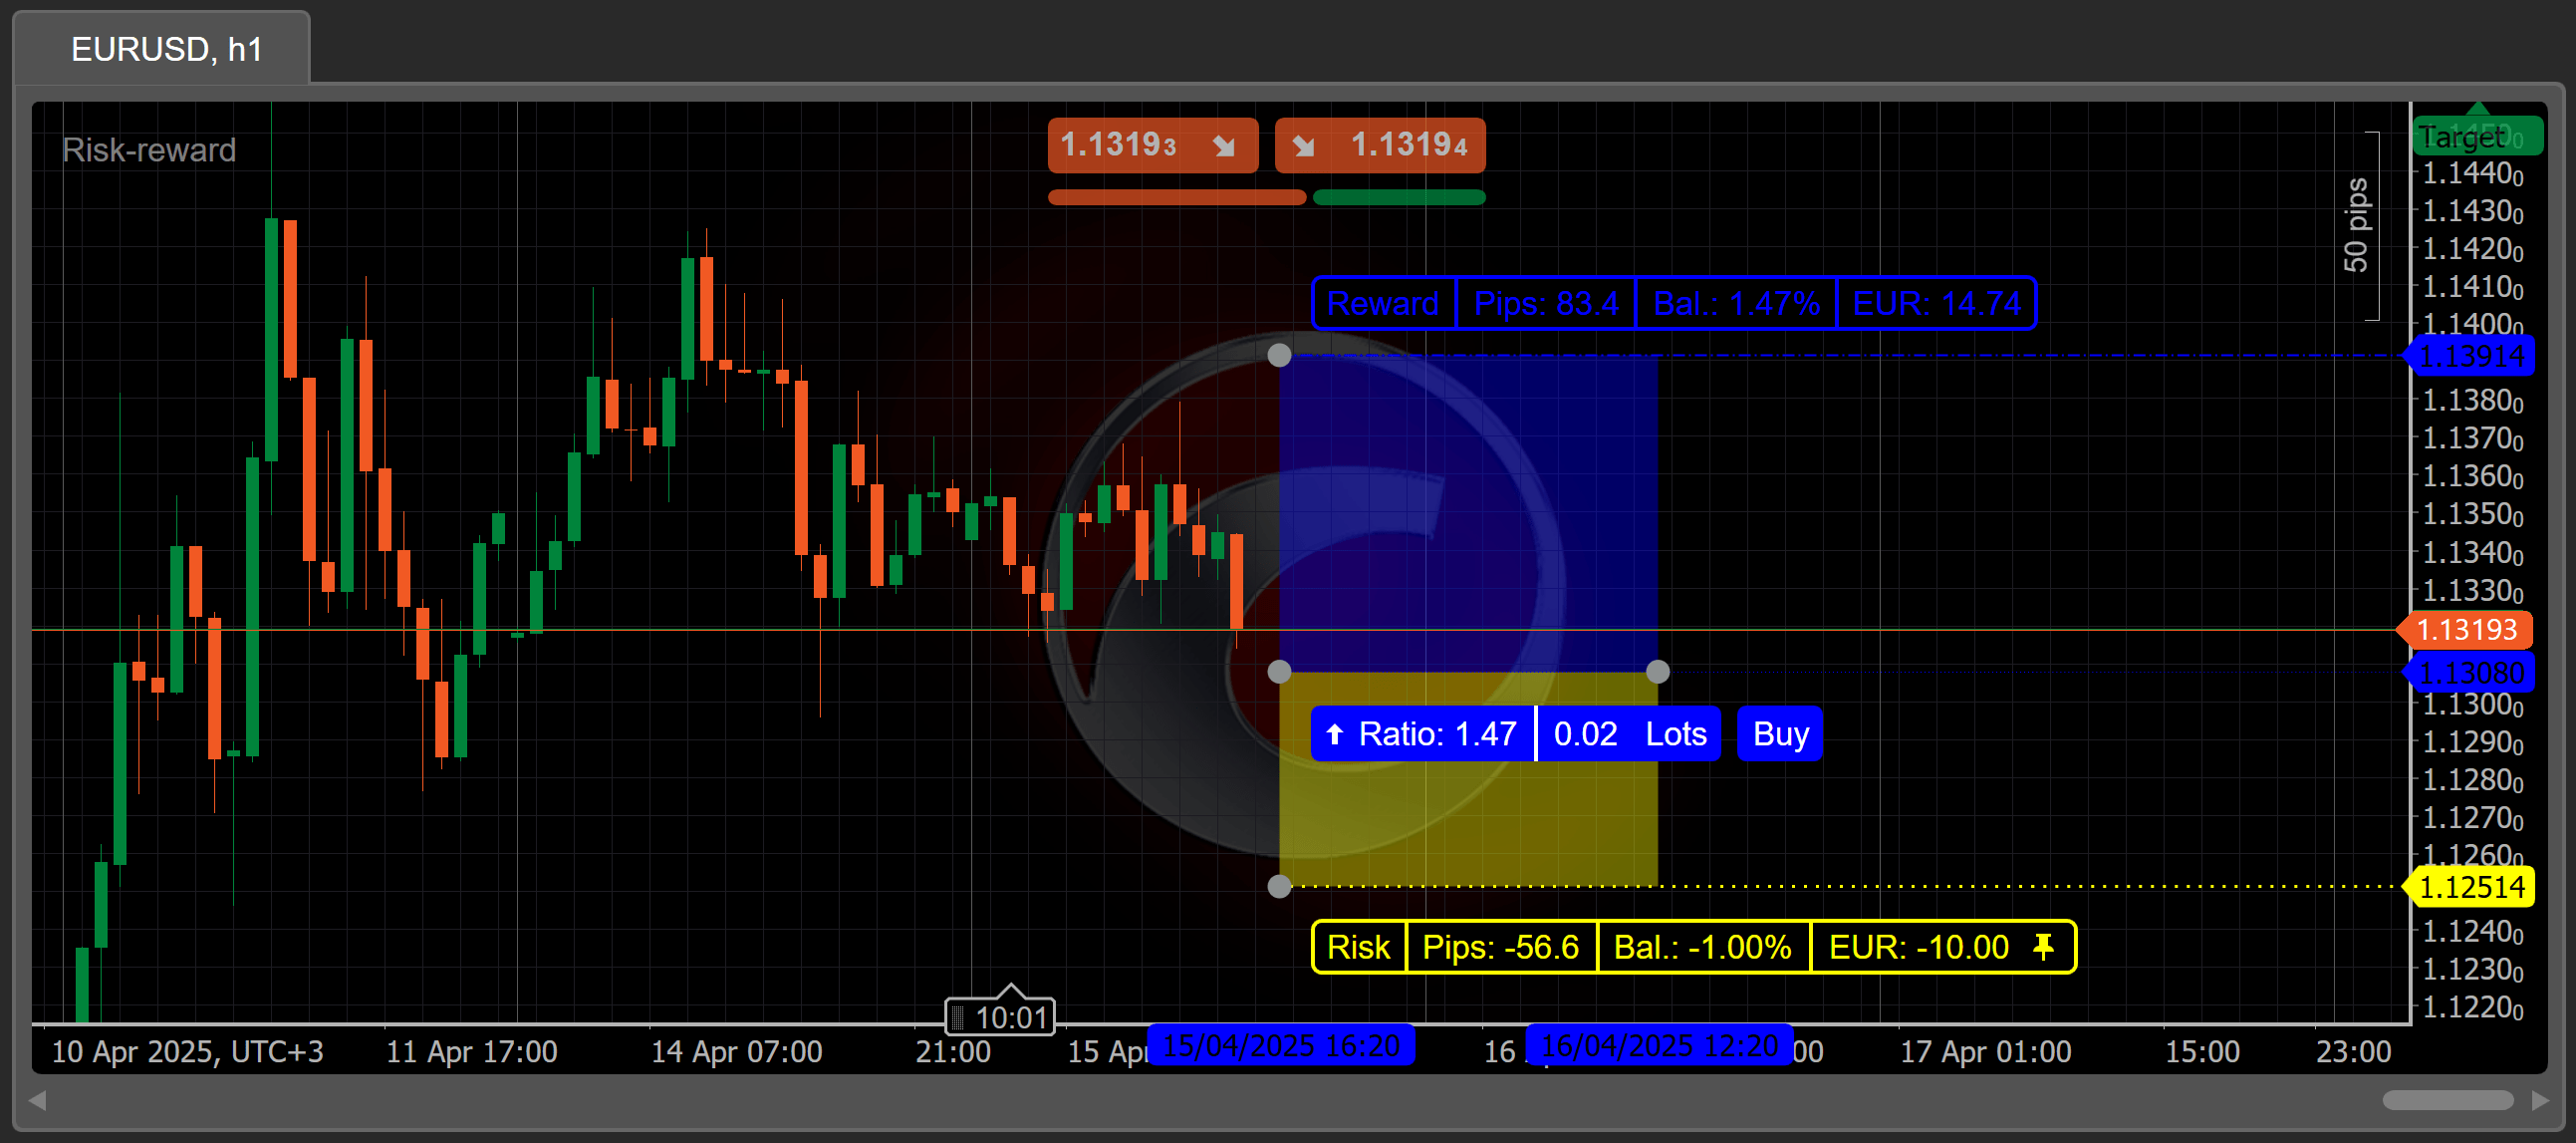
Risk-reward
The ChartRiskReward interface provides types that enable you to create and manage risk-reward objects programmatically on charts.
The code below shows you how to create an indicator that draws a risk-reward object:
1 2 3 4 5 6 7 8 9 10 11 12 13 14 15 16 17 18 19 20 21 22 23 24 25 26 27 28 29 30 31 32 33 34 35 36 37 38 39 40 41 42 43 44 45 46 47 48 49 50 51 52 53 54 55 56 | |
Key object settings
Naming chart objects
Whenever you try to draw a chart object, you have to provide its name as an argument for the draw method.
All chart object names have to be unique. If this requirement is not met, you are risking chart objects overriding chart objects with the same names depending on their execution times. You can use the current bar index value or the current time to generate unique names for each object.
Accessing chart objects
All chart objects are contained within the Objects collection. This collection includes user-drawn objects. As a result, the Objects collection can be accessed to remove objects from charts or modify their properties.
The example below accesses the members of the Objects collection:
1 2 3 4 5 6 7 8 9 10 11 12 13 14 15 16 17 18 19 20 21 22 23 24 25 26 27 28 29 30 31 32 33 34 35 36 37 38 39 40 41 42 43 44 45 46 47 48 49 50 51 52 53 54 55 56 57 58 59 60 | |
Events
Chart objects have several events that you can use to know what objects are drawn, updated or removed:
ObjectsAdded- is triggered when one or more chart objects are added to a chart.ObjectsRemoved- is triggered when one or more chart objects are removed from a chart.ObjectsUpdated- triggered when one or more chart objects are updated (one of their properties is changed by the user or the active indicator or cBot).ObjectsSelectionChanged- triggered when one or more chart objects are selected by the user.ObjectHoverChanged- triggered when the mouse cursor hovers over a chart object.
The following example uses all five event types:
1 2 3 4 5 6 7 8 9 10 11 12 13 14 15 16 17 18 19 20 21 22 23 24 25 26 27 28 29 30 31 | |
Interactive and non-interactive objects
When working with interactive objects, users can change their properties such as object position, colour, comment, etc. All user-drawn objects are interactive by default.
Note
The ChartStaticText property cannot be changed regardless of whether its related object is interactive.
To make an object interactive, set its IsInteractive property to true as shown below:
1 2 3 4 5 6 7 8 9 10 11 12 13 14 15 16 17 18 19 | |
All chart objects have the IsInteractive property. Its default value is false.
If a chart object is interactive, it will not be removed when an indicator or cBot instance is removed or stopped. In contrast, non-interactive objects are removed automatically when an indicator or cBot stops working.
To avoid clutter, make sure to clean interactive objects after their related instance is removed by using the indicator Destroy or the cBot OnStop methods.
If a chart object is not interactive, it will also be invisible in lists and collections of chart objects.
Locked and unlocked objects
Locking a chart object prevents the user from modifying or updating it. You can do so via the Trader (Chart properties) box or by setting the IsLocked property to true. The default value is false.
You can use locking to make an object interactive but at the same time prevent the user from updating it. The following example locks a vertical line object:
1 2 3 4 5 6 7 8 9 10 11 12 13 14 15 16 17 18 19 | |
Show and hide
You can draw an object on the chart and, subsequently, hide it. While the object will still be present on the chart, it will be completely invisible.
To do so, set the IsHidden property to true.
1 2 3 4 5 6 7 8 9 10 11 12 13 14 15 16 17 18 19 | |
Resource usage is the primary consideration for using this feature. If there is an object that should frequently appear on the chart (but not all the time), it is better to hide it instead of removing and re-drawing it every time it is needed.
Object selection and appearance index (ZIndex)
Naturally, there may be cases where several objects intersect with each other on a chart, making selecting one specific object difficult or outright impossible. Only the object that was drawn last will be selectable upon hovering your mouse cursor over a group of intersecting chart objects.
To change this behaviour you can use the ZIndex property. It can be helpful when attempting to display complex patterns of chart objects.
1 2 3 4 5 6 7 8 9 10 11 12 13 14 15 16 17 18 19 20 21 22 23 24 25 | |
Once attached to a chart, the above indicator will display a red vertical line rather than a yellow one. As the value of the ZIndex property of the first line is higher than the corresponding value of the second line, it takes precedence over the second (yellow) line.
In other words, the ZIndex property determines which chart objects are displayed first when they overlap. All drawn chart objects are assigned with a certain value for the ZIndex property automatically.
Know whether an object is removed
All chart objects inherit the IsAlive property from the ChartObject base class. The value of this property is true as long as an object is present on the chart (regardless of whether it is visible or invisible). The value is set to false as soon as an object is removed from the chart.
If you save a reference to a chart object and this object is removed by the user, you can check the IsAlive property to check whether an object is alive or dead.
1 2 3 4 5 6 7 8 9 10 11 12 13 14 15 16 17 18 19 20 21 22 23 24 25 26 27 28 29 30 31 32 33 34 35 36 37 38 | |
If you run an instance of this indicator, right-click on the red line and remove it. The log should then output the "Object reference removed" message.
If you keep a reference to a (dead) chart object, a memory leak will occur. During garbage collection, your object will still be considered alive, meaning that it will survive the collection process.
To avoid this problem, use the ObjectsRemoved event in combination with the IsAlive property.
Bar index or time
When coding chart objects, you may use either the chart time or the bar index for the X-axis.
In our opinion, chart time is the better option. When using bar indices, you cannot plan for future values (because the required indices do not exist yet) and cannot account for any spaces between bars. However, bar indices may be easier to use, particularly in the case of relatively simple chart objects.
All Chart.Draw methods have different overloads for bar indices and chart time.