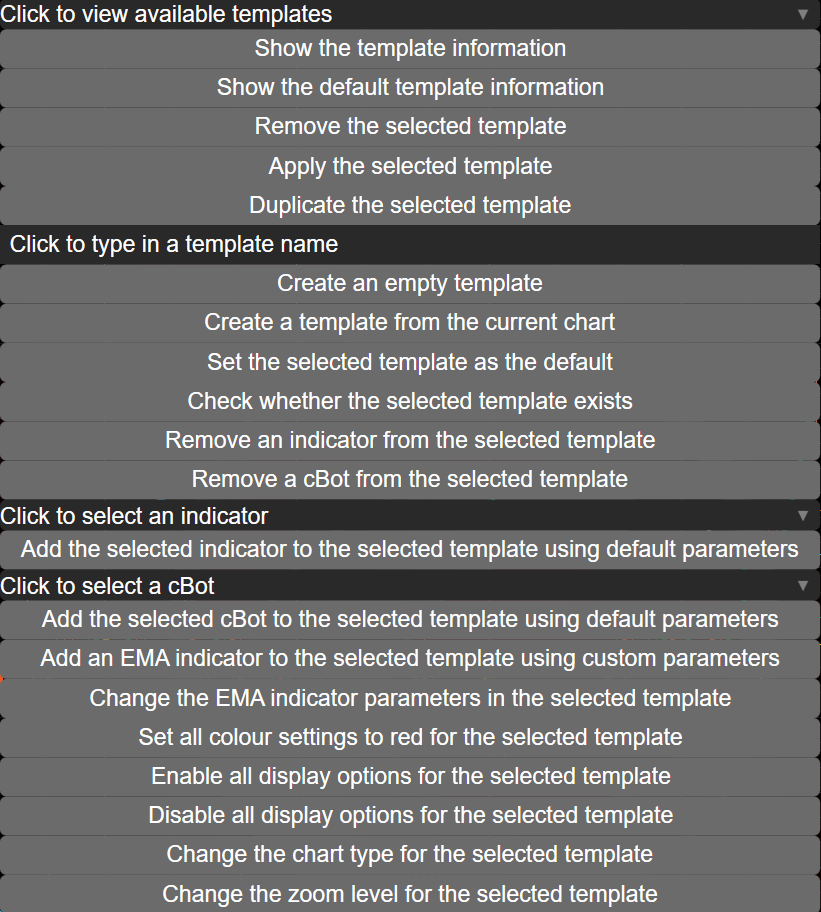
Kolekcja ChartTemplates i obiekty ChartTemplate umożliwiają programowe zapisywanie, zarządzanie i stosowanie szablonów wykresów, bez konieczności ręcznej konfiguracji. Ta funkcjonalność jest przydatna dla:
Traderów, którzy chcą, aby algorytmy konfigurowały i obsługiwały spójne układy wykresów, płynne przełączanie szablonów, przechwytywanie i przechowywanie ustawień, monitorowanie i więcej.
Deweloperów, którzy potrzebują powtarzalnych środowisk wykresów do zaawansowanej analizy, monitorowania, debugowania lub wdrażania pomocniczych wskaźników i cBotów na wielu wykresach.
Podstawowe koncepcje
Pojedynczy ChartTemplate udostępnia:
template.Apply(Chart), aby zastosować szablon do wykresu docelowego.
template.Indicators, aby dodawać lub usuwać wskaźniki, uzyskiwać dostęp do ich parametrów.
template.Robots, aby dodawać lub usuwać cBoty.
template.ColorSettings, aby pracować z kolorami wykresu lub motywu
template.DisplaySettings, aby pracować z typem wykresu, powiększeniem i różnymi przełącznikami, w tym pozycjami, zleceniami, siatką, sentymentem i innymi.
Obiekt ChartTemplates, wbudowana kolekcja, zapewnia:
foreach (var t in ChartTemplates) ... do wyliczania.
ChartTemplates.Get(name), ChartTemplates.Contains(name) do odpytywania.
ChartTemplates.Create(name) do tworzenia pustych szablonów.
ChartTemplates.Create(name, Chart) do przechwytywania bieżącej konfiguracji wykresu.
ChartTemplates.Duplicate(newName, sourceTemplate) do duplikowania szablonów.
ChartTemplates.Remove(template) do usuwania szablonów.
ChartTemplates.DefaultTemplate do stosowania domyślnego szablonu (pobieranie lub ustawianie).
Udostępnia również zdarzenia:
ChartTemplates.Added += ...
ChartTemplates.Removed += ...
Poniższa tabela zawiera podsumowanie standardowych operacji.
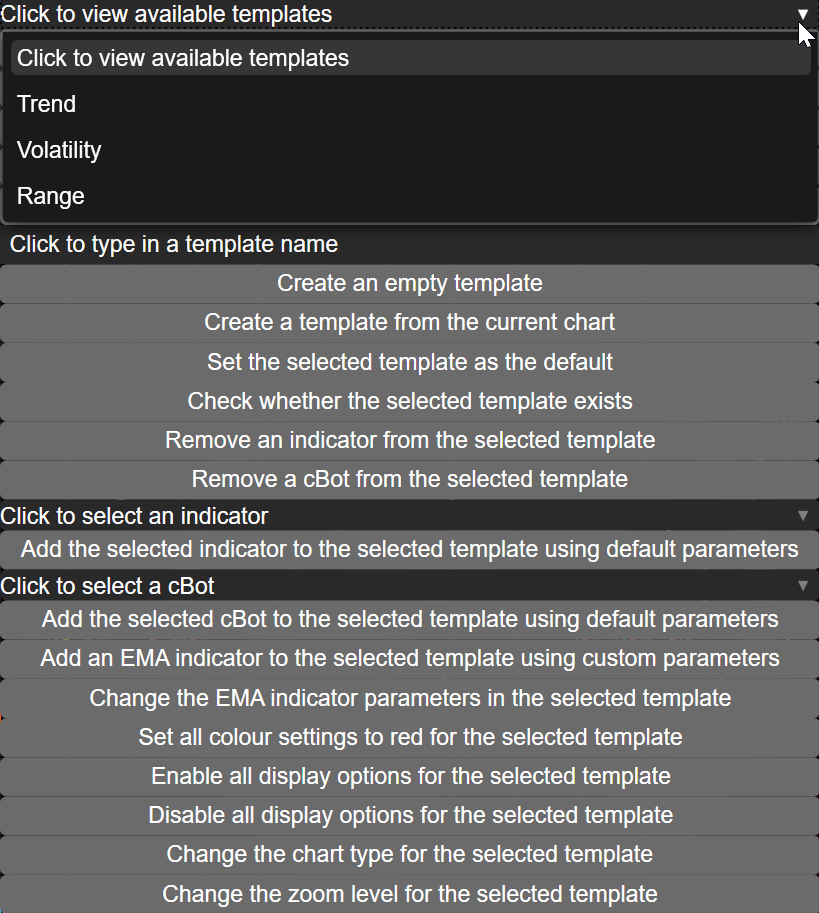
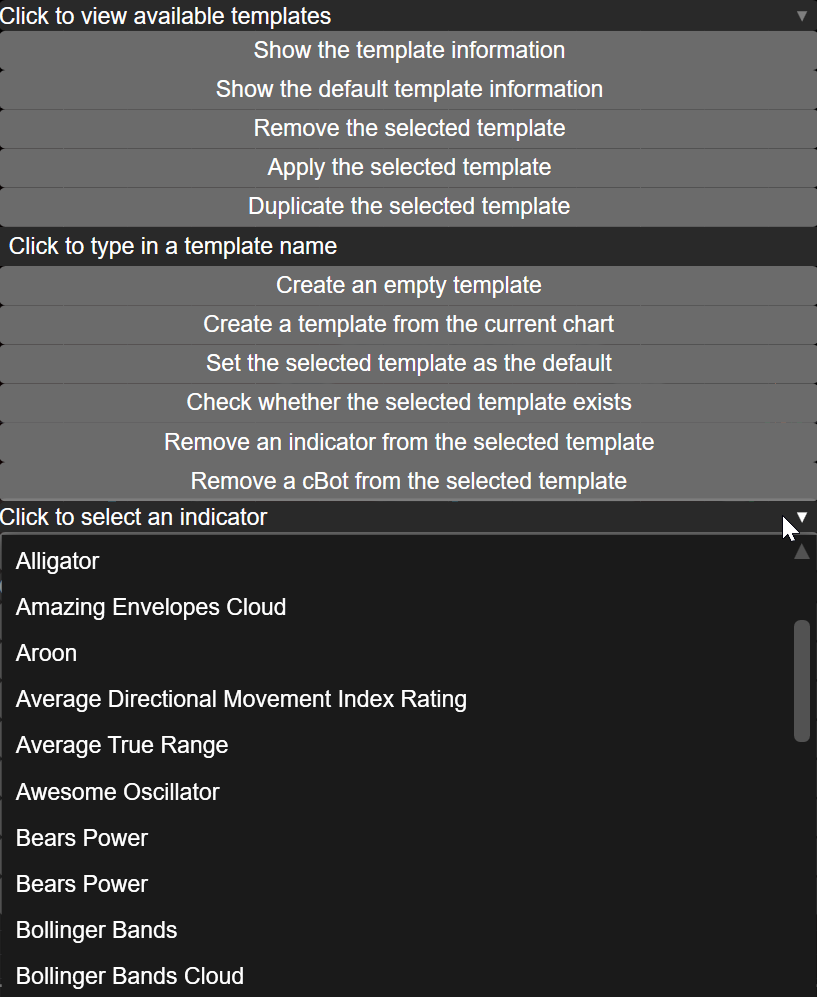
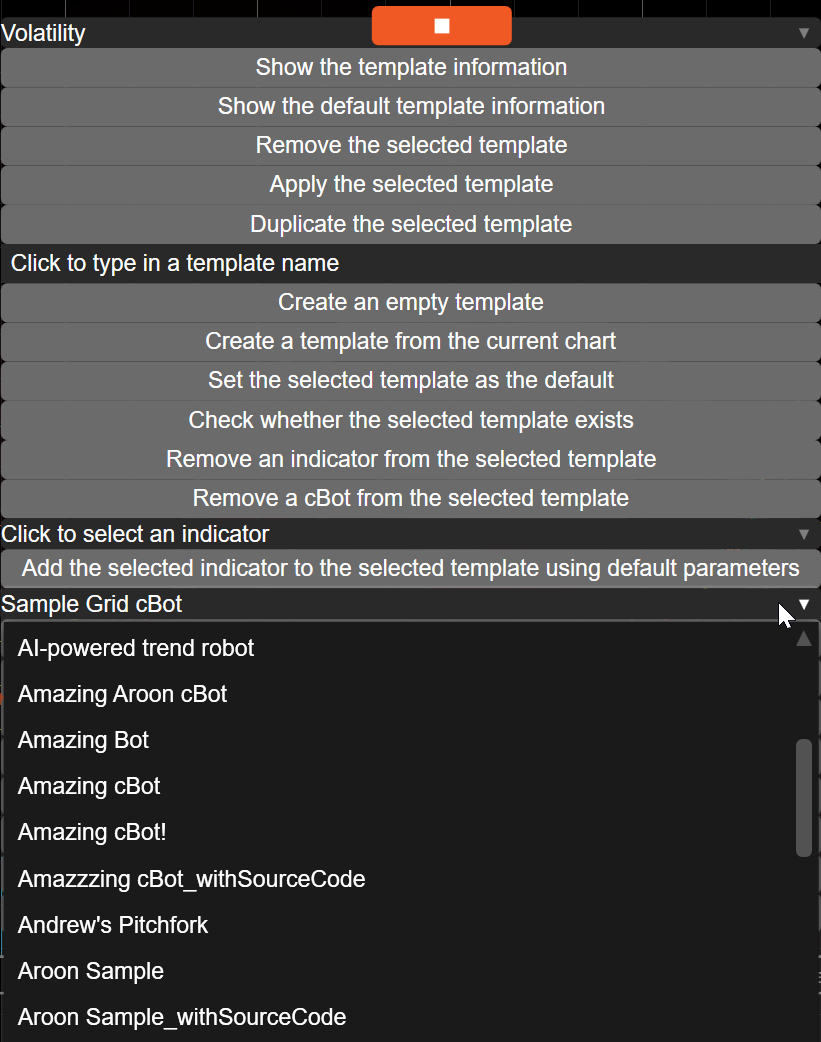
usingSystem;usingcAlgo.API;usingcAlgo.API.Collections;usingcAlgo.API.Indicators;usingcAlgo.API.Internals;usingSystem.Linq;namespacecAlgo.Robots{[Robot(AccessRights = AccessRights.None, AddIndicators = true)]publicclassChartTemplatesManager:Robot{protectedoverridevoidOnStart(){vartemplatesComboBox=newComboBox();templatesComboBox.AddItem("Click to view available templates");templatesComboBox.SelectedItem="Click to view available templates";foreach(vartemplateinChartTemplates){templatesComboBox.AddItem(template.Name);}ChartTemplates.Added+=args=>{templatesComboBox.AddItem(args.ChartTemplate.Name);Print($"A new template was added: {args.ChartTemplate.Name}");};ChartTemplates.Removed+=args=>{templatesComboBox.RemoveItem(args.ChartTemplate.Name);Print($"A template was removed: {args.ChartTemplate.Name}");};varshowTemplateInfoButton=newButton{Text="Show the template information"};showTemplateInfoButton.Click+=args=>{if(string.IsNullOrWhiteSpace(templatesComboBox.SelectedItem)){Print("No template is selected.");return;}vartemplate=ChartTemplates.Get(templatesComboBox.SelectedItem);Print($"Name: {template.Name} | Bots #: {template.Robots.Count} | Indicators #: {template.Indicators.Count}");};varshowDefaultTemplateInfoButton=newButton{Text="Show the default template information"};showDefaultTemplateInfoButton.Click+=args=>{Print($"Name: {ChartTemplates.DefaultTemplate.Name} | Bots #: {ChartTemplates.DefaultTemplate.Robots.Count} | Indicators #: {ChartTemplates.DefaultTemplate.Indicators.Count}");};varremoveTemplateButton=newButton{Text="Remove the selected template"};removeTemplateButton.Click+=_=>ChartTemplates.Remove(ChartTemplates.Get(templatesComboBox.SelectedItem));varapplyTemplateButton=newButton{Text="Apply the selected template"};applyTemplateButton.Click+=_=>ChartTemplates.Get(templatesComboBox.SelectedItem).Apply(Chart);varduplicateTemplateButton=newButton{Text="Duplicate the selected template"};duplicateTemplateButton.Click+=_=>ChartTemplates.Duplicate($"{templatesComboBox.SelectedItem} Duplicate",ChartTemplates.Get(templatesComboBox.SelectedItem));varcreateTemplateTextBox=newTextBox{Text="Click to type in a template name"};varcreateEmptyTemplateButton=newButton{Text="Create an empty template"};createEmptyTemplateButton.Click+=_=>ChartTemplates.Create(createTemplateTextBox.Text);varcreateTemplateBasedOnChartButton=newButton{Text="Create a template from the current chart"};createTemplateBasedOnChartButton.Click+=_=>ChartTemplates.Create(createTemplateTextBox.Text,Chart);varchangeDefaultTemplateToSelectedButton=newButton{Text="Set the selected template as the default"};changeDefaultTemplateToSelectedButton.Click+=_=>ChartTemplates.DefaultTemplate=ChartTemplates.Get(templatesComboBox.SelectedItem);varcheckSelectedTemplateExistsButton=newButton{Text="Check whether the selected template exists"};checkSelectedTemplateExistsButton.Click+=_=>Print($"The template '{templatesComboBox.SelectedItem}' exists: {ChartTemplates.Contains(templatesComboBox.SelectedItem)}");varremoveSelectedTemplateIndicator=newButton{Text="Remove an indicator from the selected template"};removeSelectedTemplateIndicator.Click+=_=>{if(string.IsNullOrWhiteSpace(templatesComboBox.SelectedItem)){Print("No template is selected.");return;}vartemplate=ChartTemplates.Get(templatesComboBox.SelectedItem);if(template.Indicators.Count==0)return;Print($"Removal result: {template.Indicators.Remove(template.Indicators.First())}");};varremoveSelectedTemplateBot=newButton{Text="Remove a cBot from the selected template"};removeSelectedTemplateBot.Click+=_=>{if(string.IsNullOrWhiteSpace(templatesComboBox.SelectedItem)){Print("No template is selected.");return;}vartemplate=ChartTemplates.Get(templatesComboBox.SelectedItem);if(template.Robots.Count==0)return;Print($"Removal result: {template.Robots.Remove(template.Robots.First())}");};varindicatorsCombobox=newComboBox();indicatorsCombobox.AddItem("Click to select an indicator");indicatorsCombobox.SelectedItem="Click to select an indicator";foreach(varindicatorinAlgoRegistry.Indicators.OrderBy(i=>i.Name)){indicatorsCombobox.AddItem(indicator.Name);}varaddIndicatorWithDefaultParametersToSelectedTemplate=newButton{Text="Add the selected indicator to the selected template using default parameters"};addIndicatorWithDefaultParametersToSelectedTemplate.Click+=_=>{if(string.IsNullOrWhiteSpace(templatesComboBox.SelectedItem)){Print("No template is selected.");return;}vartemplate=ChartTemplates.Get(templatesComboBox.SelectedItem);if(string.IsNullOrWhiteSpace(indicatorsCombobox.SelectedItem)){Print("No indicator is selected.");return;}Print($"Added the indicator {indicatorsCombobox.SelectedItem}.");template.Indicators.Add(indicatorsCombobox.SelectedItem);};varrobotsCombobox=newComboBox();robotsCombobox.AddItem("Click to select a cBot");robotsCombobox.SelectedItem="Click to select a cBot";foreach(varrobotinAlgoRegistry.Robots.OrderBy(i=>i.Name)){robotsCombobox.AddItem(robot.Name);}varaddRobotWithDefaultParametersToSelectedTemplate=newButton{Text="Add the selected cBot to the selected template using default parameters"};addRobotWithDefaultParametersToSelectedTemplate.Click+=_=>{if(string.IsNullOrWhiteSpace(templatesComboBox.SelectedItem)){Print("No template is selected.");return;}vartemplate=ChartTemplates.Get(templatesComboBox.SelectedItem);if(string.IsNullOrWhiteSpace(robotsCombobox.SelectedItem)){Print("No cBot is selected.");return;}Print($"Added the cBot {robotsCombobox.SelectedItem}.");template.Robots.Add(robotsCombobox.SelectedItem);};varaddEmaIndicatorWithDifferentParametersToSelectedTemplate=newButton{Text="Add an EMA indicator to the selected template using custom parameters"};addEmaIndicatorWithDifferentParametersToSelectedTemplate.Click+=_=>{if(string.IsNullOrWhiteSpace(templatesComboBox.SelectedItem)){Print("No template is selected.");return;}vartemplate=ChartTemplates.Get(templatesComboBox.SelectedItem);varemaType=AlgoRegistry.Get("Exponential Moving Average",AlgoKind.StandardIndicator)asIndicatorType;Print($"Added the indicator {emaType.Name} with a period of 100.");template.Indicators.Add(emaType,Bars.OpenPrices,100);};varchangeEmaIndicatorParametersForSelectedTemplate=newButton{Text="Change the EMA indicator parameters in the selected template"};changeEmaIndicatorParametersForSelectedTemplate.Click+=_=>{if(string.IsNullOrWhiteSpace(templatesComboBox.SelectedItem)){Print("No template is selected.");return;}vartemplate=ChartTemplates.Get(templatesComboBox.SelectedItem);varemaType=AlgoRegistry.Get("Exponential Moving Average",AlgoKind.StandardIndicator)asIndicatorType;if(template.Indicators.FirstOrDefault(i=>i.Type==emaType)isnot{}templateIndicator){Print($"The EMA indicator was not found in the template '{template.Name}'.");return;}Print($"Changing the indicator {emaType.Name} period to 200.");templateIndicator.Parameters["Periods"].Value=200;};varsetAllColorSettingsToRedForSelectedTemplate=newButton{Text="Set all colour settings to red for the selected template"};setAllColorSettingsToRedForSelectedTemplate.Click+=_=>{if(string.IsNullOrWhiteSpace(templatesComboBox.SelectedItem)){Print("No template is selected.");return;}vartemplate=ChartTemplates.Get(templatesComboBox.SelectedItem);template.ColorSettings.AskPriceLineColor=Color.Red;template.ColorSettings.BidPriceLineColor=Color.Red;template.ColorSettings.BackgroundColor=Color.Red;template.ColorSettings.BearFillColor=Color.Red;template.ColorSettings.BearOutlineColor=Color.Red;template.ColorSettings.BullFillColor=Color.Red;template.ColorSettings.BullOutlineColor=Color.Red;template.ColorSettings.BuyColor=Color.Red;template.ColorSettings.ForegroundColor=Color.Red;template.ColorSettings.GridLinesColor=Color.Red;template.ColorSettings.LosingDealColor=Color.Red;template.ColorSettings.PeriodSeparatorColor=Color.Red;template.ColorSettings.SellColor=Color.Red;template.ColorSettings.TickVolumeColor=Color.Red;template.ColorSettings.WinningDealColor=Color.Red;template.ColorSettings.AreaFillColor=Color.Red;};varenableAllDisplayOptionsForSelectedTemplate=newButton{Text="Enable all display options for the selected template"};enableAllDisplayOptionsForSelectedTemplate.Click+=_=>{if(string.IsNullOrWhiteSpace(templatesComboBox.SelectedItem)){Print("No template is selected.");return;}vartemplate=ChartTemplates.Get(templatesComboBox.SelectedItem);template.DisplaySettings.AskPriceLine=true;template.DisplaySettings.Bars=true;template.DisplaySettings.BidPriceLine=true;template.DisplaySettings.ChartScale=true;template.DisplaySettings.DealMap=true;template.DisplaySettings.Grid=true;template.DisplaySettings.IndicatorTitles=true;template.DisplaySettings.MarketSentiment=true;template.DisplaySettings.Orders=true;template.DisplaySettings.PeriodSeparators=true;template.DisplaySettings.Positions=true;template.DisplaySettings.PriceAlerts=true;template.DisplaySettings.PriceAxisOverlayButtons=true;template.DisplaySettings.QuickTradeButtons=true;template.DisplaySettings.Targets=true;template.DisplaySettings.TickVolume=true;template.DisplaySettings.AddRobotButton=true;};vardisableAllDisplayOptionsForSelectedTemplate=newButton{Text="Disable all display options for the selected template"};disableAllDisplayOptionsForSelectedTemplate.Click+=_=>{if(string.IsNullOrWhiteSpace(templatesComboBox.SelectedItem)){Print("No template is selected.");return;}vartemplate=ChartTemplates.Get(templatesComboBox.SelectedItem);template.DisplaySettings.AskPriceLine=false;template.DisplaySettings.Bars=false;template.DisplaySettings.BidPriceLine=false;template.DisplaySettings.ChartScale=false;template.DisplaySettings.DealMap=false;template.DisplaySettings.Grid=false;template.DisplaySettings.IndicatorTitles=false;template.DisplaySettings.MarketSentiment=false;template.DisplaySettings.Orders=false;template.DisplaySettings.PeriodSeparators=false;template.DisplaySettings.Positions=false;template.DisplaySettings.PriceAlerts=false;template.DisplaySettings.PriceAxisOverlayButtons=false;template.DisplaySettings.QuickTradeButtons=false;template.DisplaySettings.Targets=false;template.DisplaySettings.TickVolume=false;template.DisplaySettings.AddRobotButton=false;};varchangeChartTypeForSelectedTemplate=newButton{Text="Change the chart type for the selected template"};changeChartTypeForSelectedTemplate.Click+=_=>{if(string.IsNullOrWhiteSpace(templatesComboBox.SelectedItem)){Print("No template is selected.");return;}vartemplate=ChartTemplates.Get(templatesComboBox.SelectedItem);template.DisplaySettings.ChartType=template.DisplaySettings.ChartTypeswitch{ChartType.Area=>ChartType.Bars,ChartType.Bars=>ChartType.Candlesticks,ChartType.Candlesticks=>ChartType.Dots,ChartType.Dots=>ChartType.Hlc,ChartType.Hlc=>ChartType.Line,_=>ChartType.Area};Print($"Changed the template '{template.Name}' chart type to '{template.DisplaySettings.ChartType}'.");};varchangeZoomeLevelForSelectedTemplate=newButton{Text="Change the zoom level for the selected template"};changeZoomeLevelForSelectedTemplate.Click+=_=>{if(string.IsNullOrWhiteSpace(templatesComboBox.SelectedItem)){Print("No template is selected.");return;}vartemplate=ChartTemplates.Get(templatesComboBox.SelectedItem);template.DisplaySettings.ZoomLevel=template.DisplaySettings.ZoomLevelswitch{5=>400,400=>5,_=>5};Print($"Changed the template '{template.Name}' zoom level to '{template.DisplaySettings.ZoomLevel}'.");};varpanel=newStackPanel{Orientation=Orientation.Vertical,HorizontalAlignment=HorizontalAlignment.Center,VerticalAlignment=VerticalAlignment.Center};panel.AddChild(templatesComboBox);panel.AddChild(showTemplateInfoButton);panel.AddChild(showDefaultTemplateInfoButton);panel.AddChild(removeTemplateButton);panel.AddChild(applyTemplateButton);panel.AddChild(duplicateTemplateButton);panel.AddChild(createTemplateTextBox);panel.AddChild(createEmptyTemplateButton);panel.AddChild(createTemplateBasedOnChartButton);panel.AddChild(changeDefaultTemplateToSelectedButton);panel.AddChild(checkSelectedTemplateExistsButton);panel.AddChild(removeSelectedTemplateIndicator);panel.AddChild(removeSelectedTemplateBot);panel.AddChild(indicatorsCombobox);panel.AddChild(addIndicatorWithDefaultParametersToSelectedTemplate);panel.AddChild(robotsCombobox);panel.AddChild(addRobotWithDefaultParametersToSelectedTemplate);panel.AddChild(addEmaIndicatorWithDifferentParametersToSelectedTemplate);panel.AddChild(changeEmaIndicatorParametersForSelectedTemplate);panel.AddChild(setAllColorSettingsToRedForSelectedTemplate);panel.AddChild(enableAllDisplayOptionsForSelectedTemplate);panel.AddChild(disableAllDisplayOptionsForSelectedTemplate);panel.AddChild(changeChartTypeForSelectedTemplate);panel.AddChild(changeZoomeLevelForSelectedTemplate);Chart.AddControl(panel);}}}
Praktyczne zastosowania
Przechwytywanie bieżącej konfiguracji
Twórz algorytmy, które programowo przechwytują ustawienia wykresu, w tym wskaźniki, parametry, kolory i inne, i zapisują je jako szablon. Pozwala to automatycznie zachować działającą konfigurację podczas dowolnej fazy handlu algorytmicznego i zastosować ją do dowolnych innych wykresów.
Ten kod C# demonstruje cBota, który przechwytuje i przechowuje szablon wykresu:
usingSystem;usingcAlgo.API;usingcAlgo.API.Collections;usingcAlgo.API.Indicators;usingcAlgo.API.Internals;usingSystem.Linq;namespacecAlgo.Robots{[Robot(AccessRights = AccessRights.None)]publicclassCaptureChartAsTemplate:Robot{[Parameter("Template Name", DefaultValue = "My Golden Layout")]publicstringTemplateName{get;set;}protectedoverridevoidOnStart(){// If you want "overwrite", remove first (safe pattern).if(ChartTemplates.Contains(TemplateName)){varexisting=ChartTemplates.Get(TemplateName);ChartTemplates.Remove(existing);Print($"Removed existing template '{TemplateName}' to recapture.");}// Capture everything from the CURRENT chart (indicators/robots/colors/display settings).varcreated=ChartTemplates.Create(TemplateName,Chart);Print($"Captured template '{created.Name}' from current chart. "+$"Indicators={created.Indicators.Count}, Robots={created.Robots.Count}");}}}
Twórz odrębne obszary robocze
Uporządkuj swój dyskrecjonalny przepływ pracy w trzy dedykowane układy wykresów i przełączaj się między nimi natychmiast. Typowy dyskrecjonalny przepływ pracy to:
Skanowanie – minimalny wykres, szybkie ładowanie, czyste świece, brak bałaganu.
Potwierdzenie – wskaźniki i nakładki kontekstowe, takie jak filtry trendu/zmienności.
Wykonanie – pokaż zlecenia/pozycje/cele i przyciski szybkiej transakcji, ukryj wszystko, co rozprasza.
Podczas handlu trendami zazwyczaj polegasz na trzech podstawowych elementach: filtrze trendu, takim jak EMA, mierze momentum lub wykupienia-wyprzedania, takiej jak RSI, oraz czystym wykresie świecowym ze stabilnymi kolorami i czytelnymi nakładkami. Możesz zapisać tę konfigurację jako pojedynczy szablon i zastosować ją do dowolnego symbolu lub przedziału czasowego, który otworzysz.
Ustandaryzowana konfiguracja pomaga uniknąć niespójności parametrów, zmniejszyć błędy konfiguracji i zapewnić, że każdy wykres podąża za tymi samymi ramami decyzyjnymi.
Podczas handlu powrotem do średniej często polegasz na większym kontekście wskaźników, ale nadal chcesz czystego i kontrolowanego wykresu. Użyj szablonów, aby zdecydować dokładnie, co pozostaje widoczne podczas analizy.
Wyłącz przyciski szybkiej transakcji, aby zapobiec przypadkowym wejściom. Ukryj panel nastrojów, jeśli cię rozprasza. Zachowaj widoczność siatki i kluczowych poziomów dla precyzyjnego pozycjonowania. Wybierz typ wykresu, który pasuje do twojego podejścia, czy to świecowy dla struktury, czy liniowy dla przejrzystości.
Gdy jesteś w transakcji, twoje priorytety się zmieniają. Potrzebujesz wyraźnej widoczności otwartych pozycji, zleceń oczekujących i poziomów docelowych, wraz ze stabilnym i spójnym widokiem wykresu. Utrzymuj stały poziom powiększenia, upewnij się, że linie cenowe są wyraźnie wyświetlane i usuń wskaźniki, które nie wspierają bezpośrednio decyzji zarządczych.
Jeśli pracujesz w zespole lub stosujesz określony styl stanowiska pracy, użyj szablonów do standaryzacji elementów, takich jak kolor tła, kolory świec byka i niedźwiedzia, widoczność siatki i stylizacja linii. Zastosuj ten sam szablon we wszystkich wykresach, aby zapewnić jednolitą strukturę wizualną, zmniejszyć zamieszanie i poprawić komunikację.
Ta konfiguracja staje się szczególnie ważna, gdy udostępniasz zrzuty ekranu, przeprowadzasz przeglądy strategii lub przekazujesz decyzje.
Gdy zmienność się zmienia, zmieniają się twoje potrzeby wykonawcze i analityczne. Utwórz szablony, aby zdefiniować dwa odrębne obszary robocze i przełączaj się między nimi w miarę ewolucji warunków:
W szablonie niskiej zmienności użyj ciaśniejszego powiększenia, zmniejsz nakładki i utrzymuj czysty widok odpowiedni dla handlu w zakresie.
W szablonie wysokiej zmienności użyj szerszego powiększenia, wyraźniejszych linii cenowych, włącz siatkę i wyświetl pozycje oraz zlecenia dla ściślejszej kontroli wykonania.
Często używasz różnych parametrów wskaźników, poziomów powiększenia i preferencji wizualnych w zależności od tego, czy scalpujesz, czy handlujesz swingowo. Zamiast ręcznie dostosowywać ustawienia za każdym razem, gdy zmieniasz przedziały czasowe, utwórz dedykowane szablony dla każdego widoku.
Na przykład zdefiniuj M1-Scalp dla szybkiego wykonania i ciaśniejszego powiększenia, M15-Intraday dla ustrukturyzowanego handlu sesyjnego oraz H1-Swing dla szerszego kontekstu i gładszych nakładek.
Jeśli handlujesz wieloma rodzinami strategii, rozważ zdefiniowanie dedykowanego szablonu dla każdego podręcznika. Na przykład możesz:
Użyć szablonu podręcznika wybicia z włączoną siatką, widocznymi zleceniami i pozycjami, szerszym powiększeniem i czystymi liniami cenowymi dla przejrzystości wykonania.
Użyć szablonu podręcznika cofnięcia z zastosowanymi EMA i RSI, normalnym poziomem powiększenia i widocznymi tytułami wskaźników.
Użyć szablonu podręcznika odwrócenia z dodatkowymi wskaźnikami kontekstowymi i typem świecy, który podkreśla knoty i strukturę.
Mając każdy podręcznik zakodowany jako szablon, możesz przełączać środowiska w oparciu o typ sygnału i utrzymywać wykonanie zgodne ze stosowaną strategią.