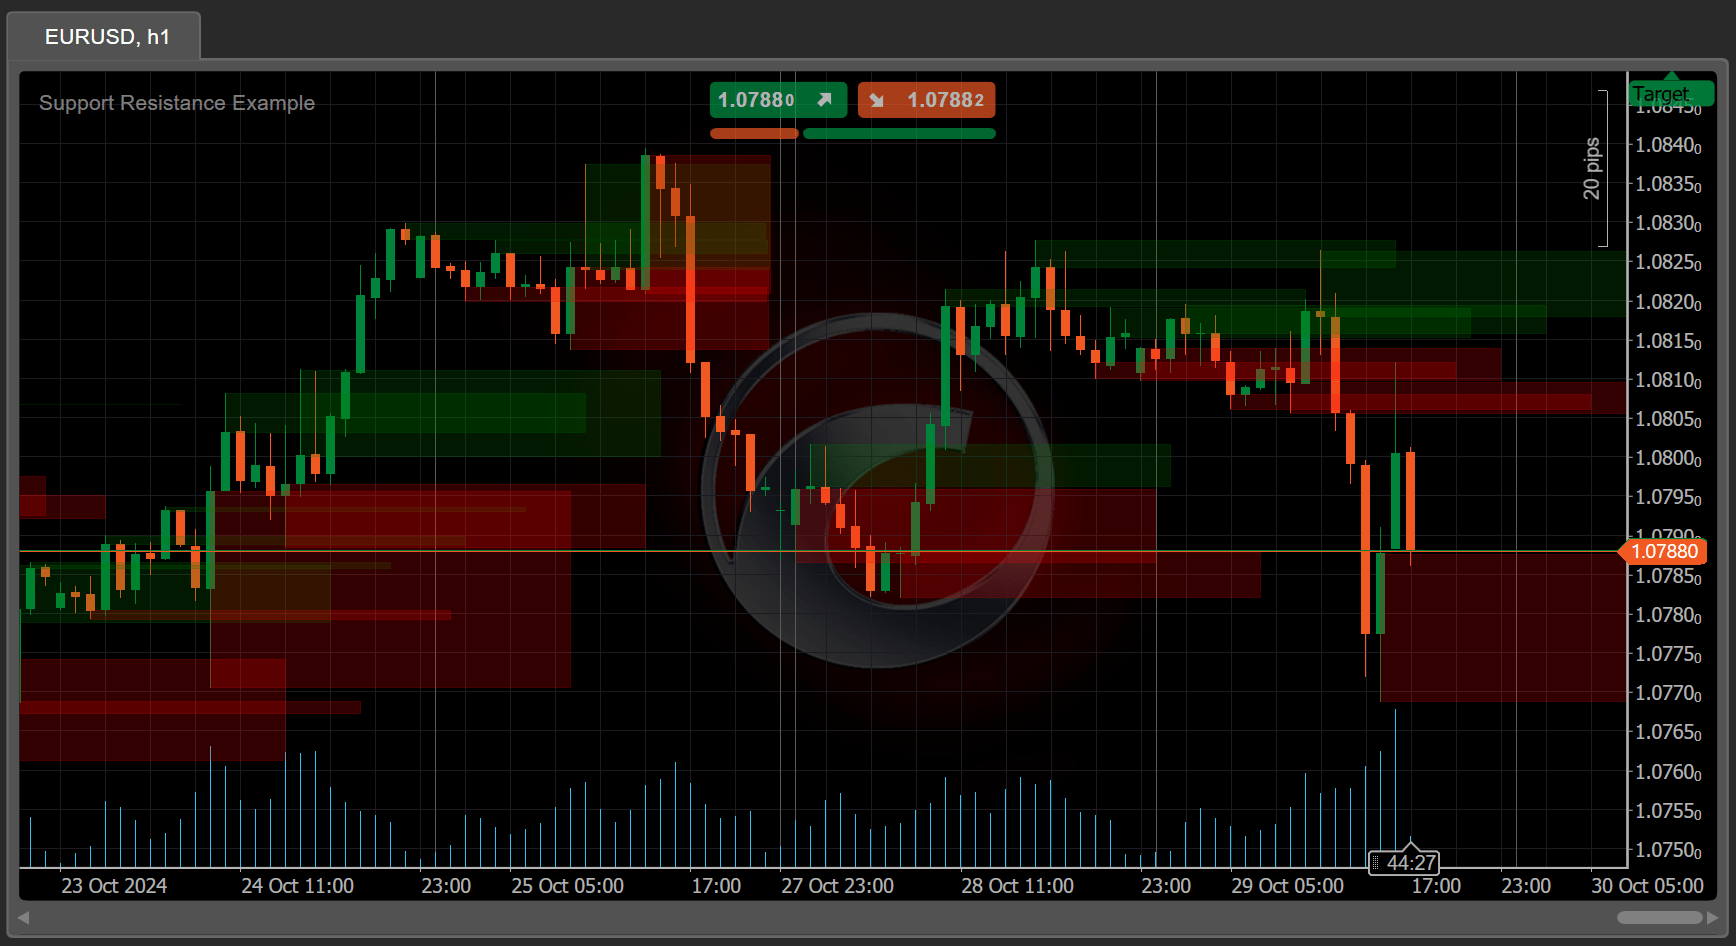
Jak tworzyć wskaźniki sesji handlowych i wsparcia/oporu
Interfejs API cTrader Algo zapewnia typy wymagane do tworzenia wskaźników, które rysują prostokąty, linie, trójkąty, chmury i inne obiekty na wykresach handlowych. Prostokąty w szczególności są szeroko stosowane do podkreślania ważnych okresów, stref konsolidacji i poziomów wsparcia/oporu.
W tym artykule i odpowiadającym mu filmie dowiesz się, jak rysować prostokąty reprezentujące sesje handlowe i poziomy wsparcia/oporu na wykresie symbolu.
Tworzenie wskaźnika sesji handlowej
Istnieją cztery główne sesje handlowe: Sydney, Tokio, Londyn i Nowy Jork. Każda sesja jest wyjątkowa pod względem zmienności i poziomu aktywności. Monitorując sesje i nakładanie się między nimi, traderzy wiedzą, kiedy określone aktywa są przedmiotem obrotu i mogą wykorzystać nadarzające się okazje.
W tym przykładzie chcemy utworzyć wskaźnik, który rysuje sesje handlowe na wykresie.
W cTrader Algo przejdź do zakładki Wskaźniki i kliknij przycisk Nowy. Wprowadź nazwę w polu tekstowym, a następnie kliknij Utwórz.
Zacznij modyfikować wskaźnik w edytorze kodu. Najpierw ustaw go jako wskaźnik nakładany.
Napisz kod, aby narysować prostokąt wskazujący sesję londyńską na wykresie.
1234567
TimeSpanlondonOpen=TimeZoneInfo.ConvertTimeToUtc(newDateTime(Server.Time.Year,Server.Time.Month,Server.Time.Day,9,0,0),TimeZoneInfo.FindSystemTimeZoneById("Greenwich Standard Time")).TimeOfDay;TimeSpanlondonClose=TimeZoneInfo.ConvertTimeToUtc(newDateTime(Server.Time.Year,Server.Time.Month,Server.Time.Day,18,0,0),TimeZoneInfo.FindSystemTimeZoneById("Greenwich Standard Time")).TimeOfDay;Chart.DrawRectangle("London Session ",Server.Time.Date.Add(londonOpen),Chart.TopY,Server.Time.Date.Add(londonClose),Chart.BottomY,Color.FromArgb(50,0,50,255)).IsFilled=true;
Naciśnij Ctrl+B lub kliknij Kompiluj, a następnie dodaj wskaźnik do wykresu, klikając Dodaj instancję.
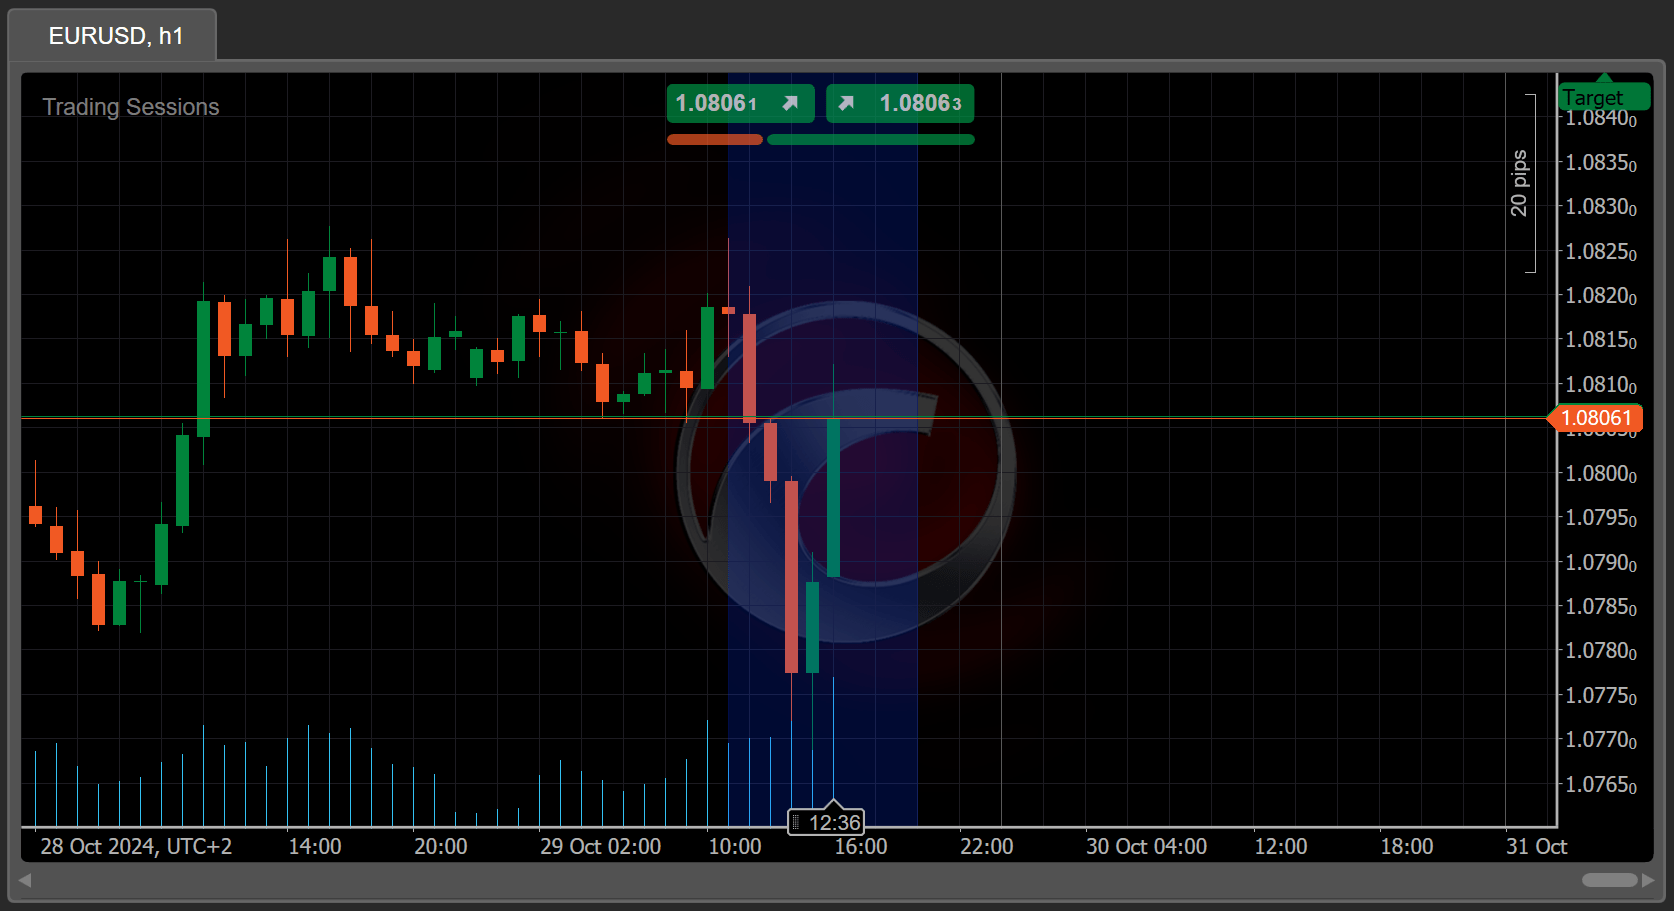
Prostokąt sesji londyńskiej jest widoczny na wykresie.
Wróć do edytora kodu i dodaj kod dla pozostałych trzech sesji handlowych.
1 2 3 4 5 6 7 8 91011121314151617181920212223
TimeSpannyOpen=TimeZoneInfo.ConvertTimeToUtc(newDateTime(Server.Time.Year,Server.Time.Month,Server.Time.Day,9,0,0),TimeZoneInfo.FindSystemTimeZoneById("Eastern Standard Time")).TimeOfDay;TimeSpannyClose=TimeZoneInfo.ConvertTimeToUtc(newDateTime(Server.Time.Year,Server.Time.Month,Server.Time.Day,18,0,0),TimeZoneInfo.FindSystemTimeZoneById("Eastern Standard Time")).TimeOfDay;Chart.DrawRectangle("NY Session ",Server.Time.Date.Add(nyOpen),Chart.TopY,Server.Time.Date.Add(nyClose),Chart.BottomY,Color.FromArgb(50,255,50,0)).IsFilled=true;TimeSpansydneyOpen=TimeZoneInfo.ConvertTimeToUtc(newDateTime(Server.Time.Year,Server.Time.Month,Server.Time.Day,9,0,0),TimeZoneInfo.FindSystemTimeZoneById("AUS Eastern Standard Time")).TimeOfDay;TimeSpansydneyClose=TimeZoneInfo.ConvertTimeToUtc(newDateTime(Server.Time.Year,Server.Time.Month,Server.Time.Day,18,0,0),TimeZoneInfo.FindSystemTimeZoneById("AUS Eastern Standard Time")).TimeOfDay;Chart.DrawRectangle("Sydney Session ",Server.Time.Date.Add(sydneyOpen).AddDays(-1),Chart.TopY,Server.Time.Date.Add(sydneyClose),Chart.BottomY,Color.FromArgb(50,50,255,0)).IsFilled=true;TimeSpantokyoOpen=TimeZoneInfo.ConvertTimeToUtc(newDateTime(Server.Time.Year,Server.Time.Month,Server.Time.Day,9,0,0),TimeZoneInfo.FindSystemTimeZoneById("Tokyo Standard Time")).TimeOfDay;TimeSpantokyoClose=TimeZoneInfo.ConvertTimeToUtc(newDateTime(Server.Time.Year,Server.Time.Month,Server.Time.Day,18,0,0),TimeZoneInfo.FindSystemTimeZoneById("Tokyo Standard Time")).TimeOfDay;Chart.DrawRectangle("Tokio Session ",Server.Time.Date.Add(tokyoOpen),Chart.TopY,Server.Time.Date.Add(tokyoClose),Chart.BottomY,Color.FromArgb(50,0,50,255)).IsFilled=true;
usingSystem;usingcAlgo.API;usingcAlgo.API.Collections;usingcAlgo.API.Indicators;usingcAlgo.API.Internals;namespacecAlgo{[Indicator(AccessRights = AccessRights.None, IsOverlay = true)]publicclassTradingSessions:Indicator{protectedoverridevoidInitialize(){}publicoverridevoidCalculate(intindex){TimeSpanlondonOpen=TimeZoneInfo.ConvertTimeToUtc(newDateTime(Server.Time.Year,Server.Time.Month,Server.Time.Day,9,0,0),TimeZoneInfo.FindSystemTimeZoneById("Greenwich Standard Time")).TimeOfDay;TimeSpanlondonClose=TimeZoneInfo.ConvertTimeToUtc(newDateTime(Server.Time.Year,Server.Time.Month,Server.Time.Day,18,0,0),TimeZoneInfo.FindSystemTimeZoneById("Greenwich Standard Time")).TimeOfDay;Chart.DrawRectangle("London Session ",Server.Time.Date.Add(londonOpen),Chart.TopY,Server.Time.Date.Add(londonClose),Chart.BottomY,Color.FromArgb(50,0,50,255)).IsFilled=true;TimeSpannyOpen=TimeZoneInfo.ConvertTimeToUtc(newDateTime(Server.Time.Year,Server.Time.Month,Server.Time.Day,9,0,0),TimeZoneInfo.FindSystemTimeZoneById("Eastern Standard Time")).TimeOfDay;TimeSpannyClose=TimeZoneInfo.ConvertTimeToUtc(newDateTime(Server.Time.Year,Server.Time.Month,Server.Time.Day,18,0,0),TimeZoneInfo.FindSystemTimeZoneById("Eastern Standard Time")).TimeOfDay;Chart.DrawRectangle("NY Session ",Server.Time.Date.Add(nyOpen),Chart.TopY,Server.Time.Date.Add(nyClose),Chart.BottomY,Color.FromArgb(50,255,50,0)).IsFilled=true;TimeSpansydneyOpen=TimeZoneInfo.ConvertTimeToUtc(newDateTime(Server.Time.Year,Server.Time.Month,Server.Time.Day,9,0,0),TimeZoneInfo.FindSystemTimeZoneById("AUS Eastern Standard Time")).TimeOfDay;TimeSpansydneyClose=TimeZoneInfo.ConvertTimeToUtc(newDateTime(Server.Time.Year,Server.Time.Month,Server.Time.Day,18,0,0),TimeZoneInfo.FindSystemTimeZoneById("AUS Eastern Standard Time")).TimeOfDay;Chart.DrawRectangle("Sydney Session ",Server.Time.Date.Add(sydneyOpen).AddDays(-1),Chart.TopY,Server.Time.Date.Add(sydneyClose),Chart.BottomY,Color.FromArgb(50,50,255,0)).IsFilled=true;TimeSpantokyoOpen=TimeZoneInfo.ConvertTimeToUtc(newDateTime(Server.Time.Year,Server.Time.Month,Server.Time.Day,9,0,0),TimeZoneInfo.FindSystemTimeZoneById("Tokyo Standard Time")).TimeOfDay;TimeSpantokyoClose=TimeZoneInfo.ConvertTimeToUtc(newDateTime(Server.Time.Year,Server.Time.Month,Server.Time.Day,18,0,0),TimeZoneInfo.FindSystemTimeZoneById("Tokyo Standard Time")).TimeOfDay;Chart.DrawRectangle("Tokyo Session ",Server.Time.Date.Add(tokyoOpen),Chart.TopY,Server.Time.Date.Add(tokyoClose),Chart.BottomY,Color.FromArgb(50,0,50,255)).IsFilled=true;}}}
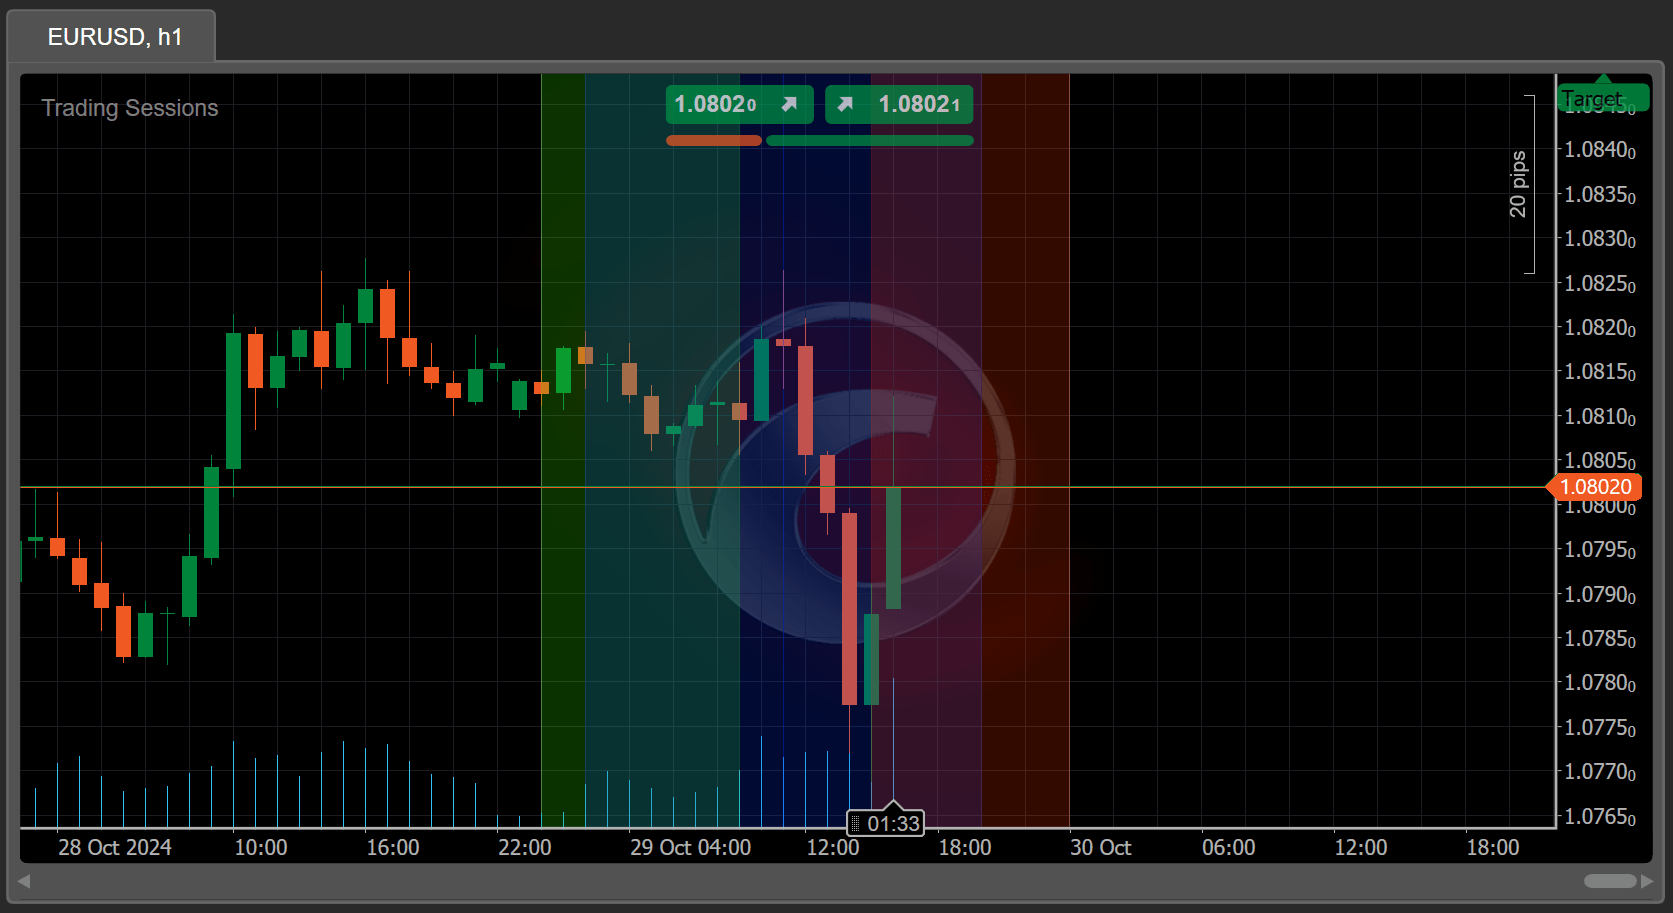
Ponownie skompiluj wskaźnik, a następnie sprawdź wykres, aby zobaczyć wszystkie sesje handlowe tam przedstawione.
Tworzenie wskaźnika wsparcia/oporu
Utworzymy wskaźnik, który nanosi strefy oporu i wsparcia na wykres za pomocą fraktali.
Utwórz nowy wskaźnik, wykonując te same kroki, ale przypisz mu inną nazwę.
Rozpocznij modyfikacje, ustawiając IsOverlay na true.
Strefa oporu fraktalnego jest rysowana tam, gdzie wartość maksymalna jest wyższa niż dwa sąsiednie słupki po każdej stronie. Strefa to obszar między cenami maksymalną i zamknięcia świecy fraktalnej. Strefy oporu pomagają zidentyfikować obszary, w których trend zwyżkowy może się zatrzymać i odwrócić, co skutkuje możliwościami handlowymi.
W przeciwieństwie do stref oporu, strefy wsparcia pomagają zidentyfikować miejsca, w których trend spadkowy może się zatrzymać i odwrócić. Takie strefy mogą być interpretowane jako sygnały kupna.
Skompiluj wskaźnik i dodaj instancję do wykresu. Powinieneś zobaczyć strefy wsparcia i oporu na wykresie.
Ten artykuł pokazał, jak tworzyć wskaźniki z użytecznymi obiektami, takimi jak prostokąty, które mogą być używane do reprezentowania sesji handlowych i poziomów wsparcia/oporu na wykresach.