cTrader Windows Analyze
The cTrader Analyze application provides a set of helpful services designed to track and analyse your trading activity with all the detailed information on all your trading operations, account profitability, performance statistics, etc.
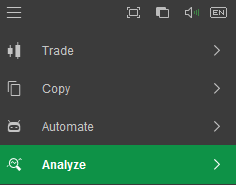
To start using the Analyze app, select Analyze from the main menu.
Summary
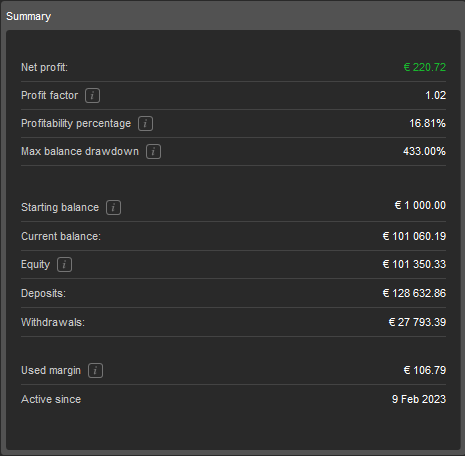
The Summary section contains the following account information:
- Net profit – the current trading account net profit.
- Profit factor – the ratio of the total net profit versus the total net loss.
- Profitability percentage – the ratio of the number of winning trades to the total number of trades.
- Max balance drawdown – the maximum amount of the current account balance drawdown.
- Starting balance – the balance at the moment the account was created.
- Current balance – the current trading account balance.
- Equity – the current account equity, calculated as follows: balance - unrealised net loss + unrealised net profit + bonus (if any).
- Deposits – the total account deposits including the starting balance.
- Withdrawals – the total account withdrawals.
- Used margin – the current account margin used, calculated as follows: total max margin between the sum of all long and all short positions per symbol (for hedging accounts), or the sum of all open positions margin (for netting accounts).
- Active since – the exact date the account was activated.
Equity
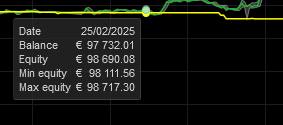
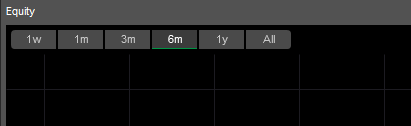
The Equity section displays the correlation between the account balance and equity on the time/balance chart.
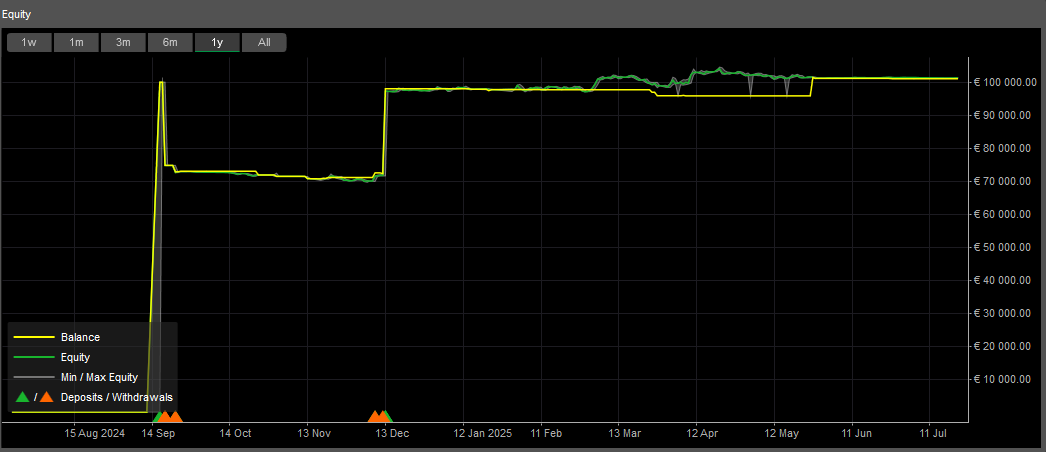
Hover over the chart to view detailed information on the date, balance, equity, min equity and max equity at the exact time point.
Use the Period selector in the upper left to choose the desired period for your chart. You can choose from the predefined periods.
Performance stats
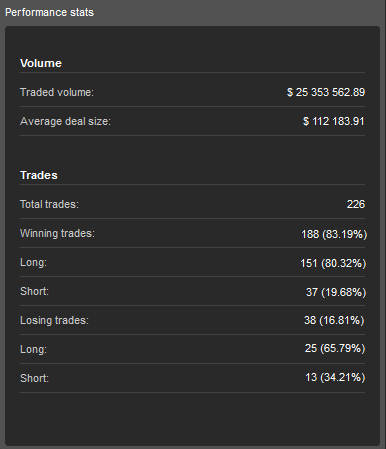
The Performance stats section contains the following volume and trades information:
Volume
- Traded volume – the total volume traded from the current account.
- Average deal size – the average amount per closed deal in the current account currency.
Trades
- Total trades – the total number of trades made from the current account.
- Winning trades – the total number and percentage of the account's winning trades.
- Long – the total number of long winning trades.
- Short – the total number of short winning trades.
- Losing trades – the total number and percentage of the account losing trades.
- Long – the total number of long losing trades.
- Short – the total number of short losing trades.
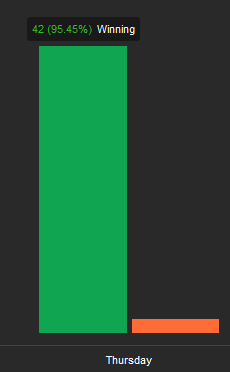
Performance
The Performance section allows you to track winning and losing trades in the account, filtered by years, months and days.
Use the Period buttons in the upper-left to switch to the desired period. Winning trades are shown in green bars, and losing trades in orange bars.
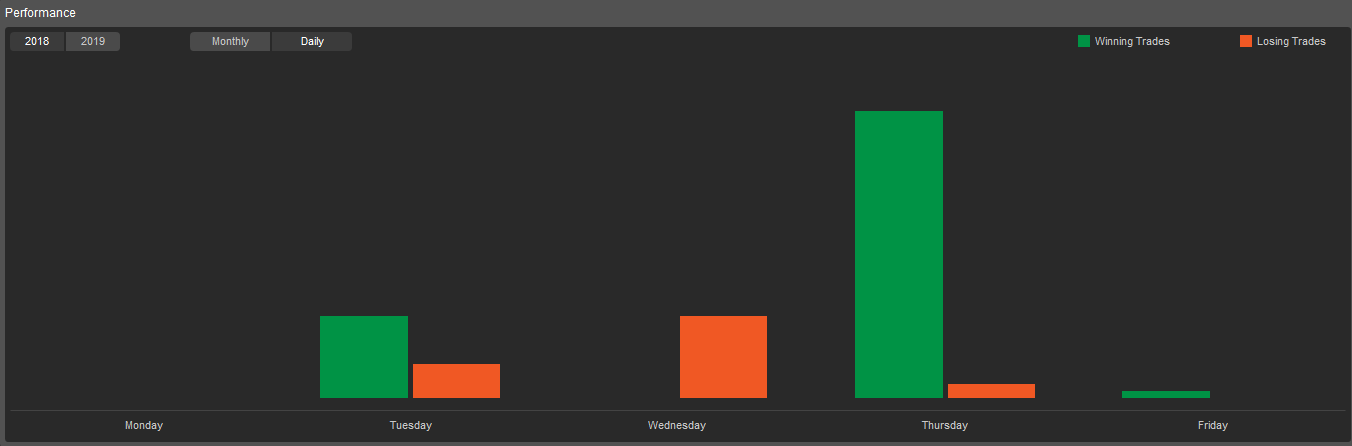
Hover over the bar to view the detailed information on the trades.
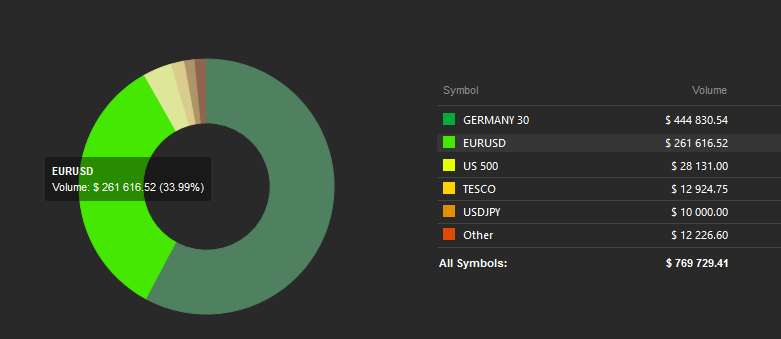
Volume
The Volume pie chart shows the symbols, their traded volumes and the percentage each symbol represents of the total volume traded.
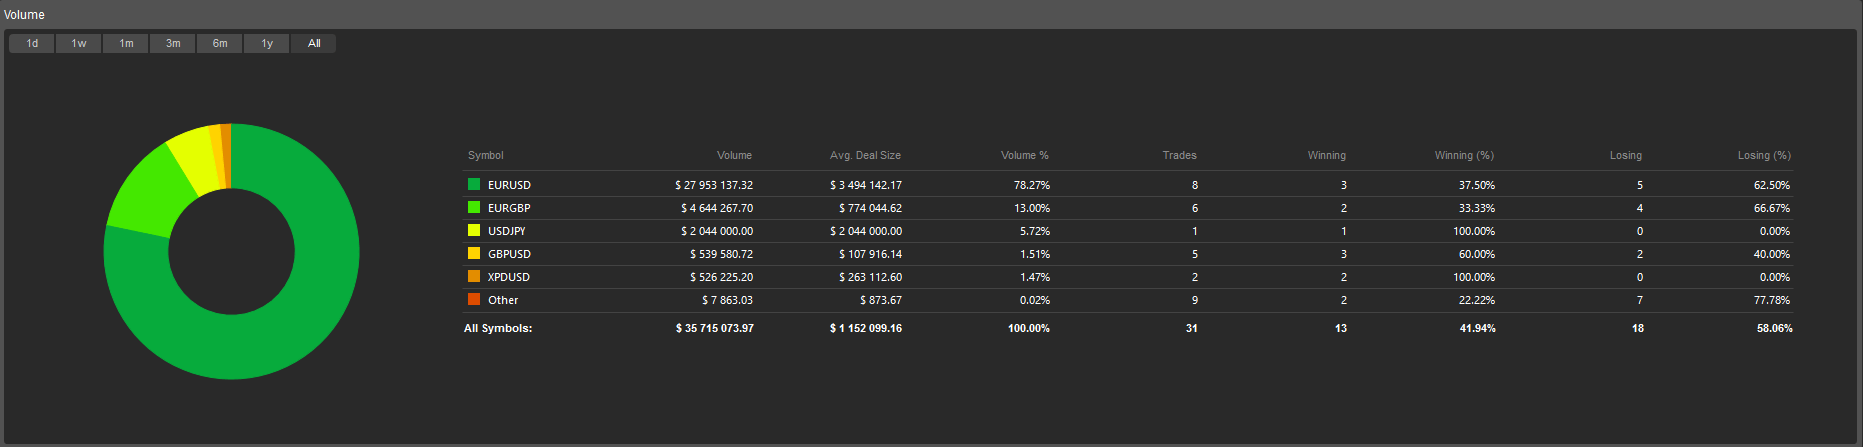
Hover over a symbol line in the table on the right or a symbol slice on the pie chart on the left to highlight it and view the details.
Profitability
The Profitability section shows the account’s total profitability by symbol, including the net profit in currency and percentage for long and short trades, as well as the profit factor for long and short trades for each symbol.
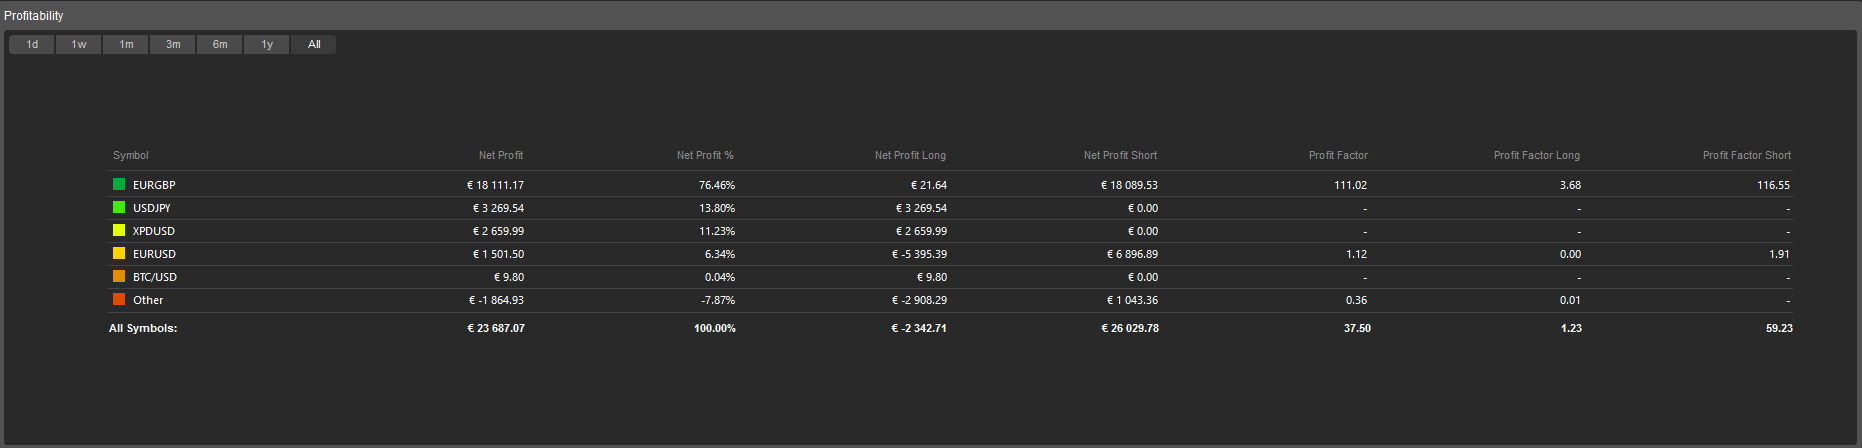
Use the Period buttons in the upper-left to filter the profitability information by period, from 1 day to all time profitability.
Trades
All account trade details are displayed in the Trades tab. The following trade statistics, divided into all trades, long trades and short trades, are available here:
- Net profit – the net realised profit of all trades.
- Profit factor – the ratio of total net profit divided by total net loss.
- Commission – the total amount of commission paid to the broker.
- Max balance drawdown – maximum consecutive losses that the account had, expressed as a percentage of the account balance at the time that the losses occurred.
- Total trades – the total amount of the closed positions.
- Winning trades – the total amount of the account winning trades.
- Largest winning trade – a closing deal with the largest positive result.
- Losing trades – the total amount of the account losing trades.
- Largest losing trade – a closing deal with the largest negative result.
- Average trade – the average profit for all the trades.
- Total pips – the total number of pips that the account won.
- Average pips – the total pips divided by the number of trades.
- Average trade duration – the total amount of time that the account had an open trade divided by the number of trades.
- Traded volume – the total amount traded in the account currency.
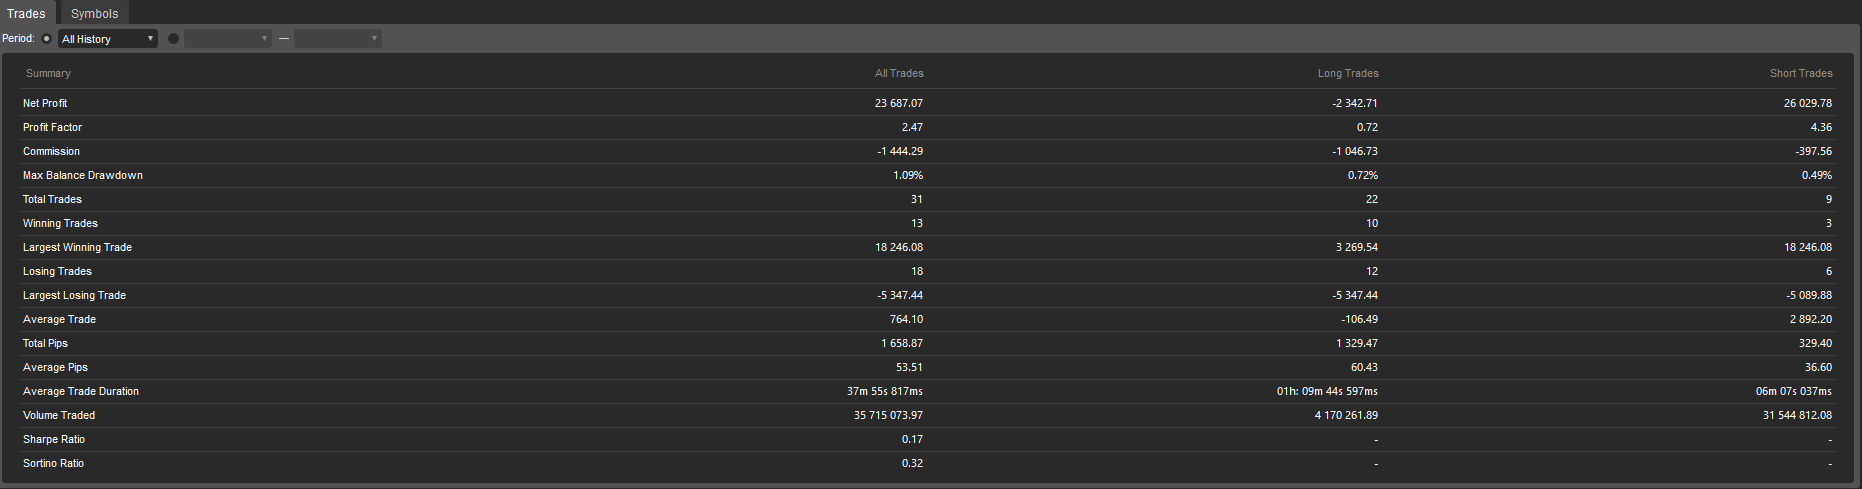
The trades information can be filtered by the standard periods from 1 day to all time, or by the custom period with the first and the last days specified.
Use the Period selector or the Calendar in the upper-left to set the period.

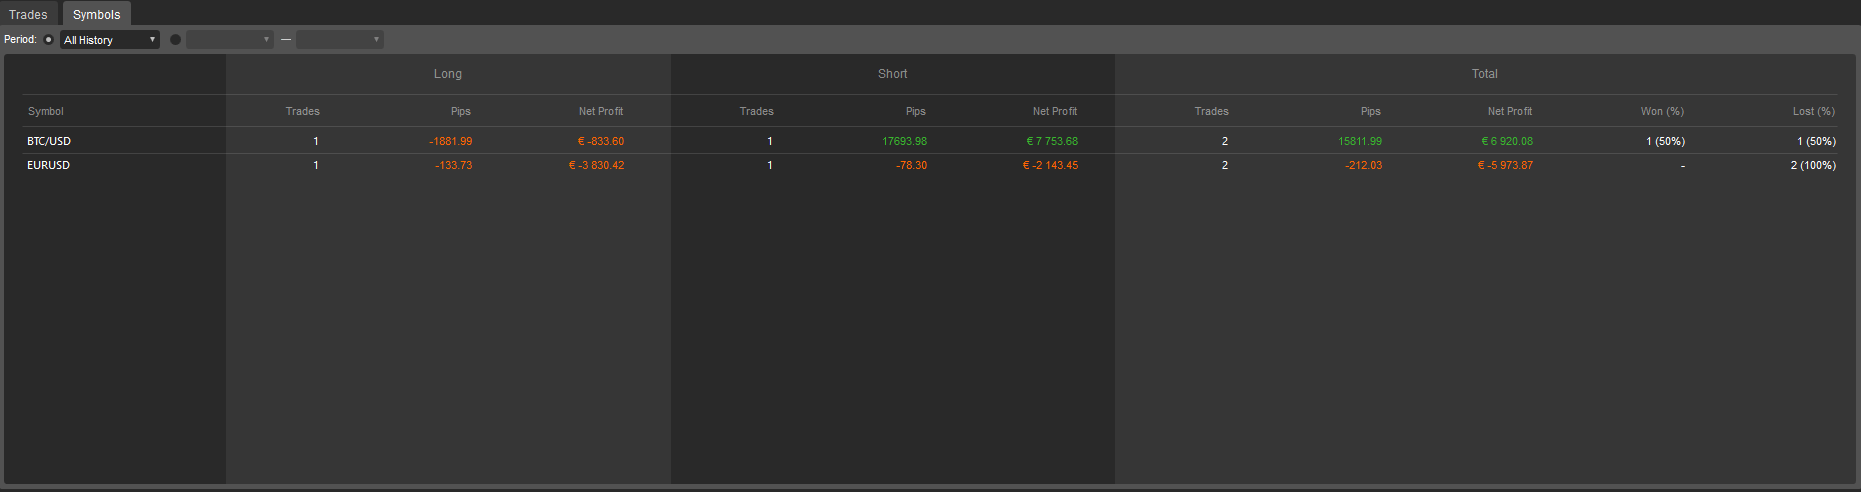
Symbols
The Symbols tab lists all symbols traded on the current account based on closed positions. It shows statistics for trades, pips, net profit, and won and lost percentages in the corresponding columns.
You can filter the list of symbols by standard periods from one day to all time, or set the custom period with the first and the last dates specified.