Strategy list and strategy page
Every strategy has a dedicated page. This is the area where investors can come to review a strategy and its all-time performance in detail. These individual strategy pages can be accessed from the Strategies tab or by going directly to the page via a unique strategy link.
cTrader Copy supports active traders
- The strategy list only includes strategies whose providers are currently trading.
- You can be sure that all strategies in the Strategies tab are provided by keen traders who proactively exploit new market opportunities.
- After you copy a strategy, cTrader will attempt to open new positions to match the positions currently opened by the provider.
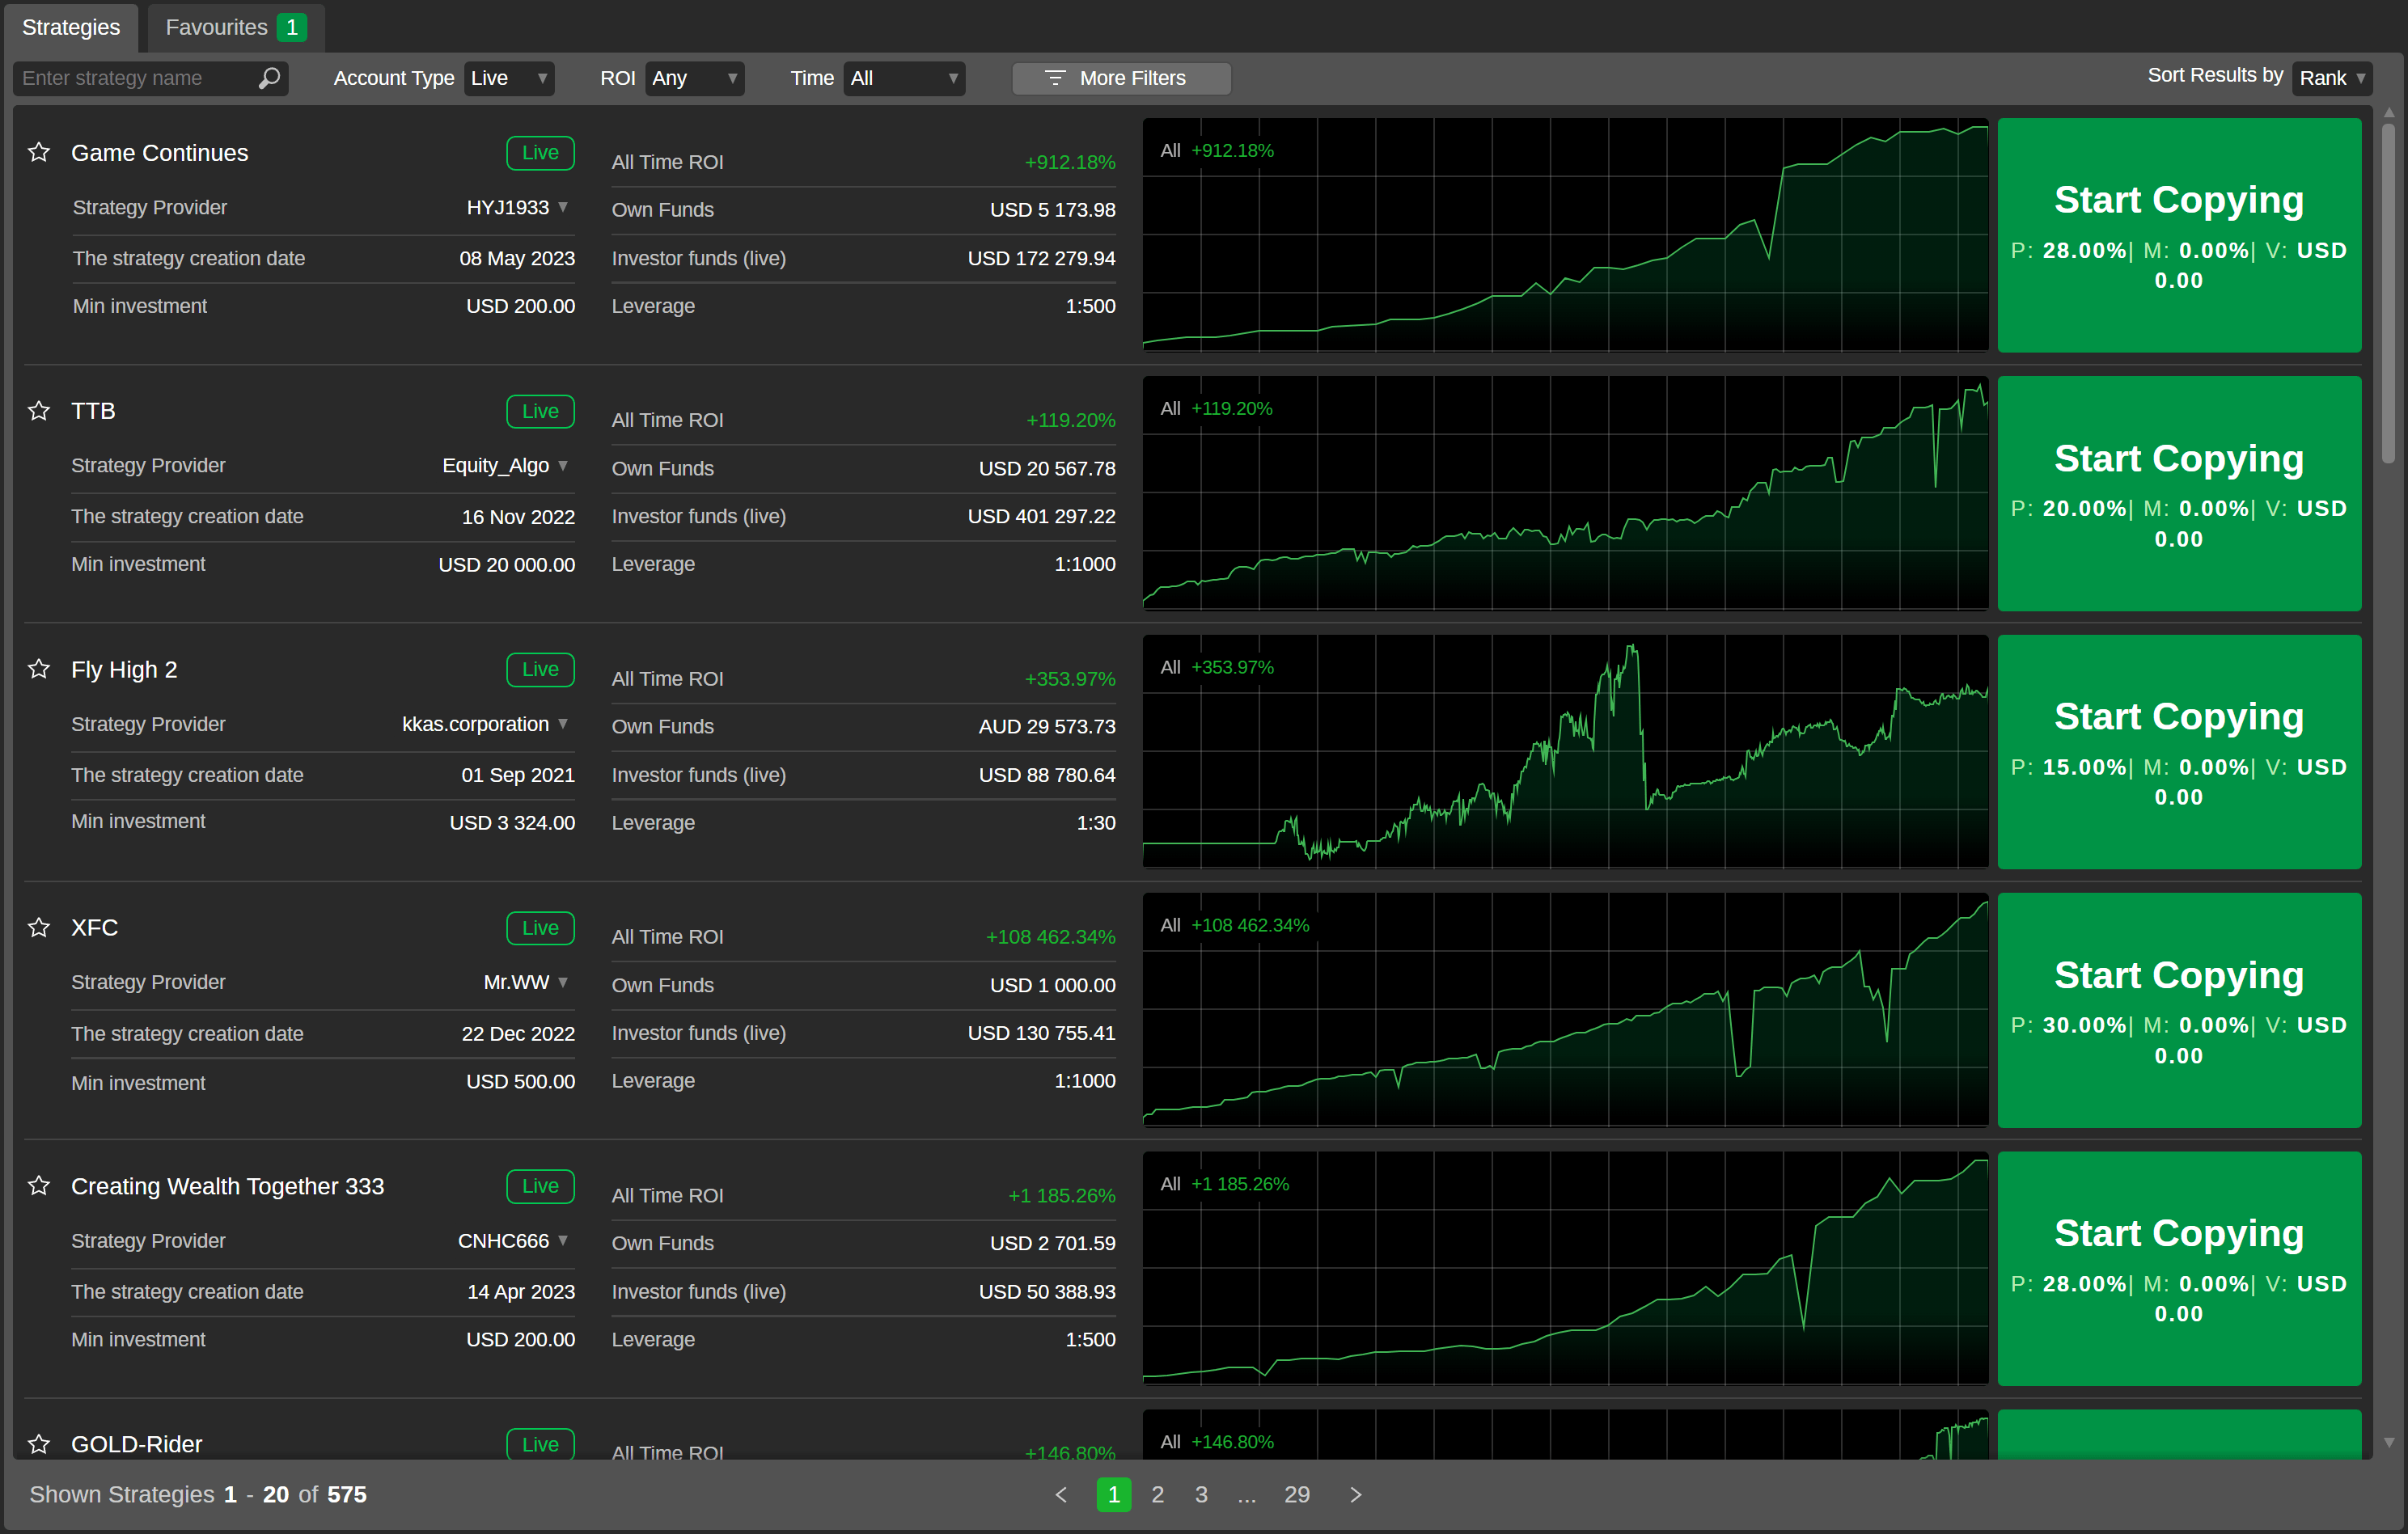
Strategy list
The strategies in the list can be searched by their names using the search box, which you can find in the upper left corner.
The list can be filtered by the account type, ROI, period and other filtering options under the More filters button. This guide also demonstrates how to sort the strategies in the list.
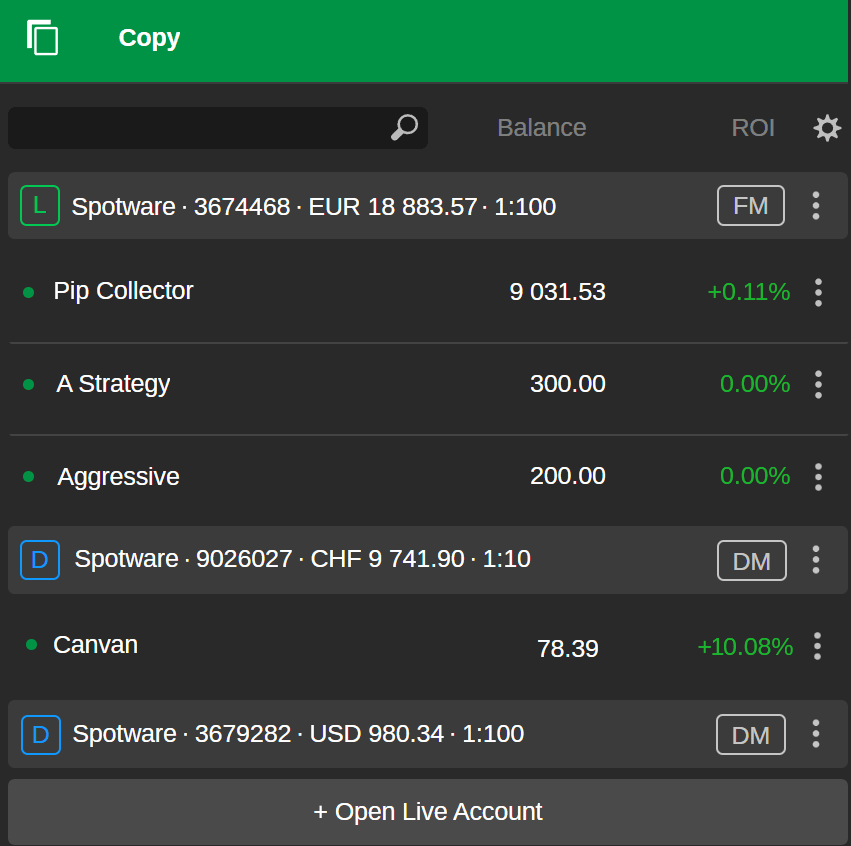
Investors can quickly access the strategies they are currently copying or stopped copying in the account list located under the expandable Copy application tab. Here, strategies are displayed per copying account, and the related page only shows how the corresponding account has performed copying this strategy.
Filtering
There are several filters available in the Strategies tab that allow you to filter the strategies list based on your preferences.
In addition to searching by strategy name, you can filter strategies by account type (all, demo and live), ROI percentage and time. You only need to select a suitable option from the drop-down lists, and the strategies will be automatically filtered.

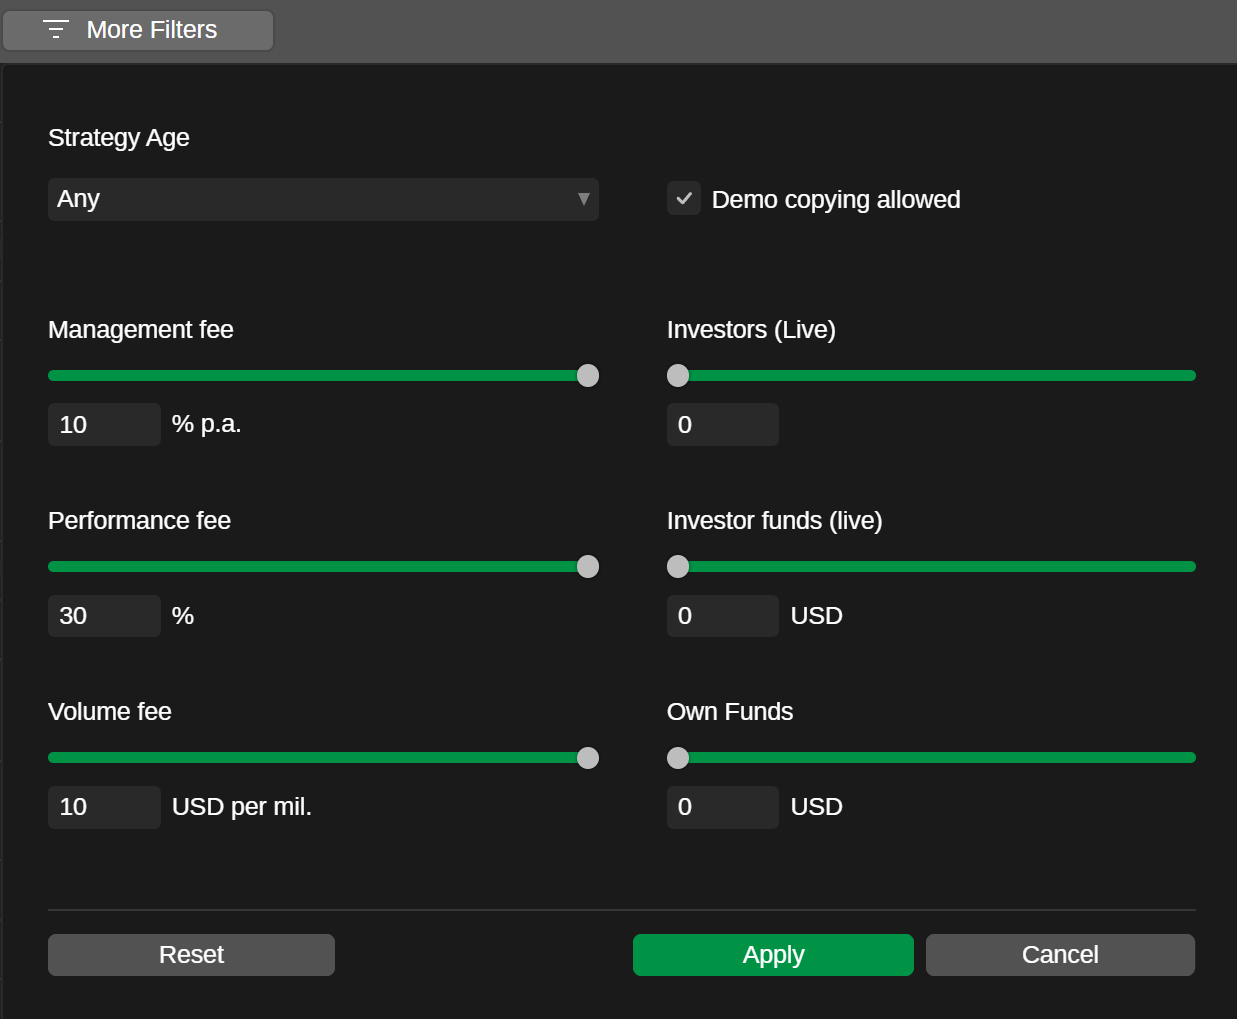
The More filters button provides other options, such as:
- Strategy age
- Demo copying permission
- Management fee
- Live investors number
- Performance fee
- Investor funds (live)
- Volume fee
- Own funds
Select your desired values in the More filters menu and select Apply to filter the strategies.
Sorting
cTrader Copy allows you to sort the strategies using different criteria. You can select your preferred sorting criterion by navigating to the top-right drop-down list of the Strategies tab.
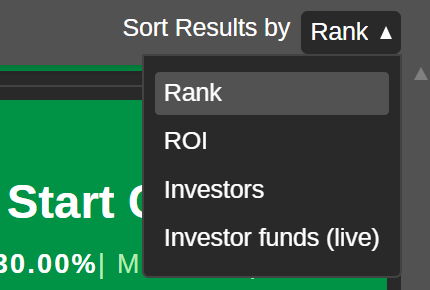
The sorting methods are defined as follows:
- Rank – is a proprietary method used to prioritise strategies in a comprehensive way, taking into consideration many parameters. For the strategy rank calculation, the following strategy parameters are considered:
- ROI – recent ROI is weighted over historical ROI. It is much more important for an investor to see strategies that are performing well now, not those that performed well previously.
- Equity-based ROI – considers the amount of funds that the strategy provider used to achieve the ROI result (for example, how much of the provider's own funds were used for each 1% of ROI). The average value is used.
- Trade duration – considers the number of trading days (for example, the number of days when the strategy provider was trading). The more active the strategy is, the higher rank it will receive in the strategy list.
- Trade activity – assesses whether the strategy provider is a keen trader who proactively reacts to market movements.
- Number of profitable months – considers the number of months when the strategy had positive ROI minus the number of months when the strategy had negative ROI. This parameter allows for evaluating the long-term success of a strategy.
- Risk – evaluates the degree of riskiness of the strategy and, accordingly, the risk of losing the investment.
- Equity drawdown – the lower the equity drawdown of a strategy is, the higher the strategy will show in the rank.
- Risk reward – the higher the risk-reward ratio of a strategy is, the higher the strategy will show in the rank.
- Invested funds – the more live investors' funds are invested, the higher the strategy will show in the rank.
- Number of live investors – the more live investors that are copying a strategy, the higher the strategy will show in the rank.
- Own funds – the more funds the strategy provider invests in their own strategy, the higher the strategy will show in the rank.
- Fees – many traders consider the performance fee to be the fairest for investors, so strategies that apply management fees and volume fees are downgraded in the rank calculation.
- ROI – the ROI of each strategy for the selected period is used to sort the strategies in the list. Strategies are sorted from the highest to the lowest ROI.
- Investors – the number of live accounts copying the strategy. Strategies are sorted from the highest number of live copying accounts to the lowest.
- Investor funds (live) – the amount of live capital copying the strategy. Strategies are sorted from the highest amount of live copying capital to the lowest.
Strategy page
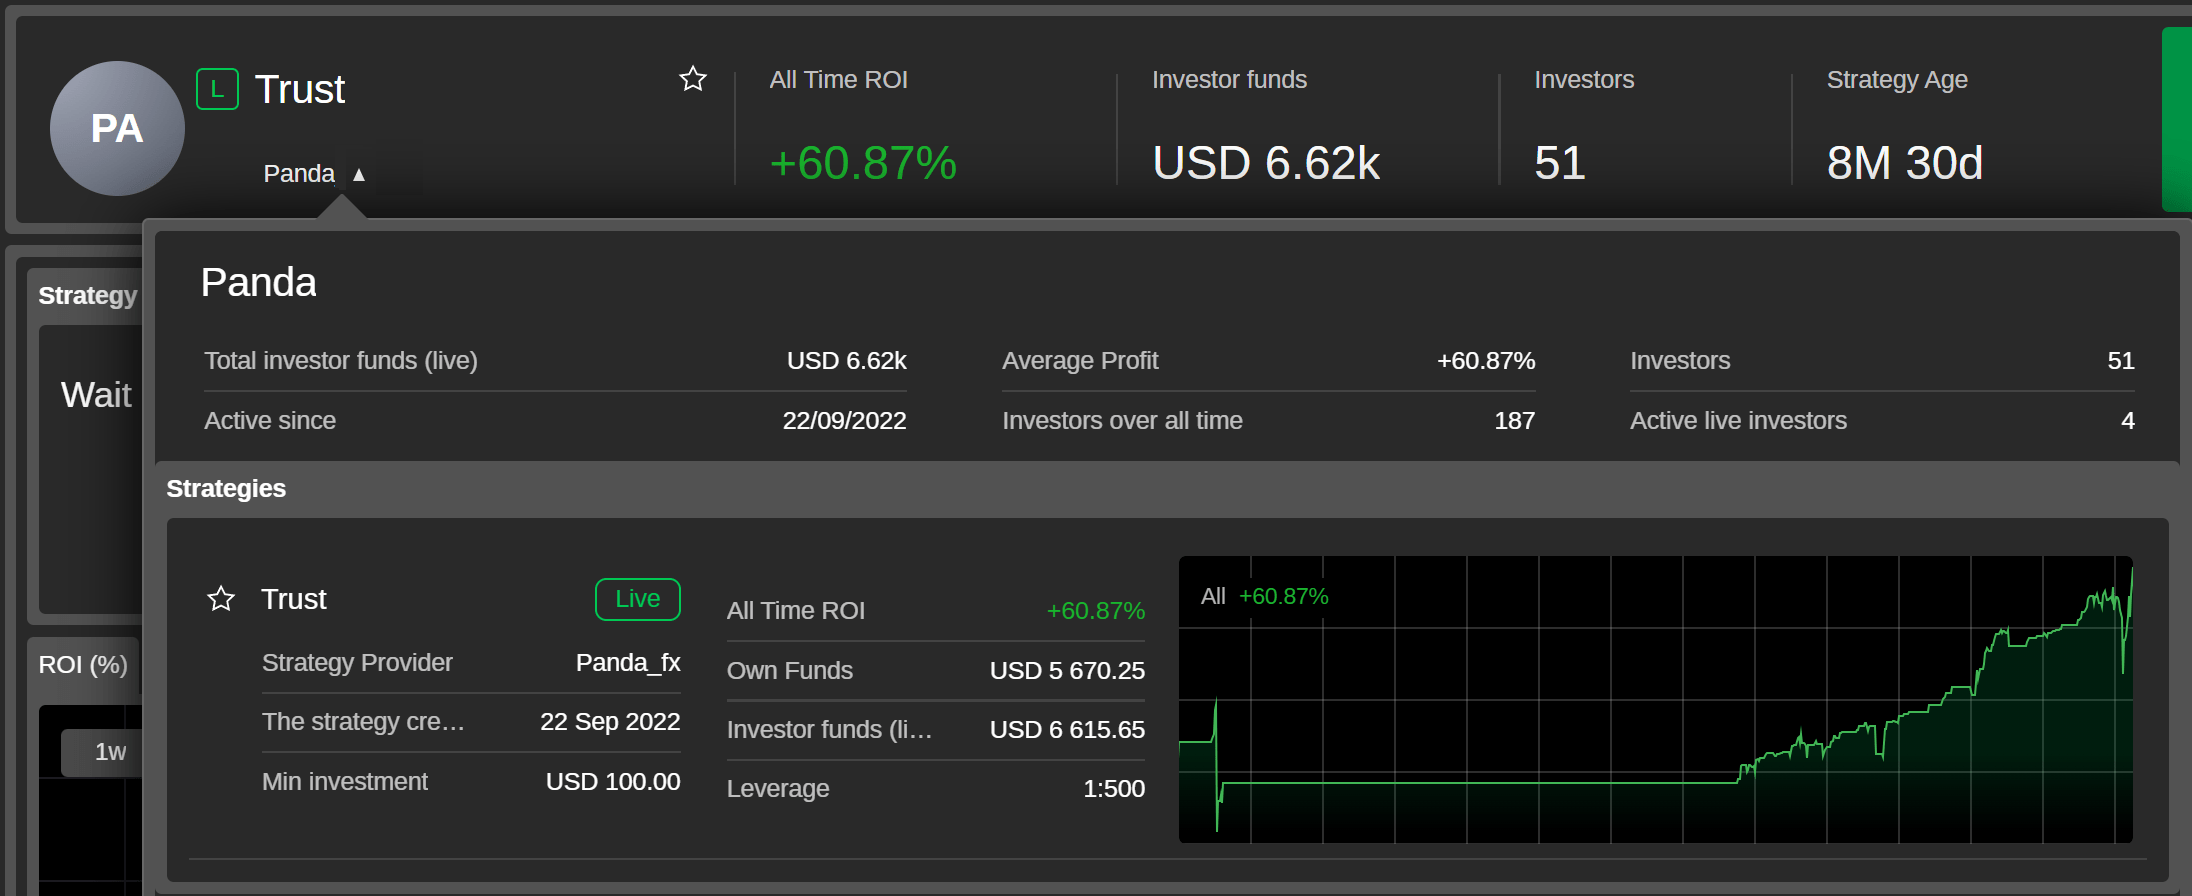
Select a strategy from the strategies list to open its individual page. At the top of each strategy page, the following information is summarised:
- Strategy provider's avatar
- Account type logo
- Strategy name
- Strategy provider's cTrader ID
- All time ROI of the strategy
- Investor funds attracted by the strategy
- Number of investors copying the strategy
- Strategy age from the start

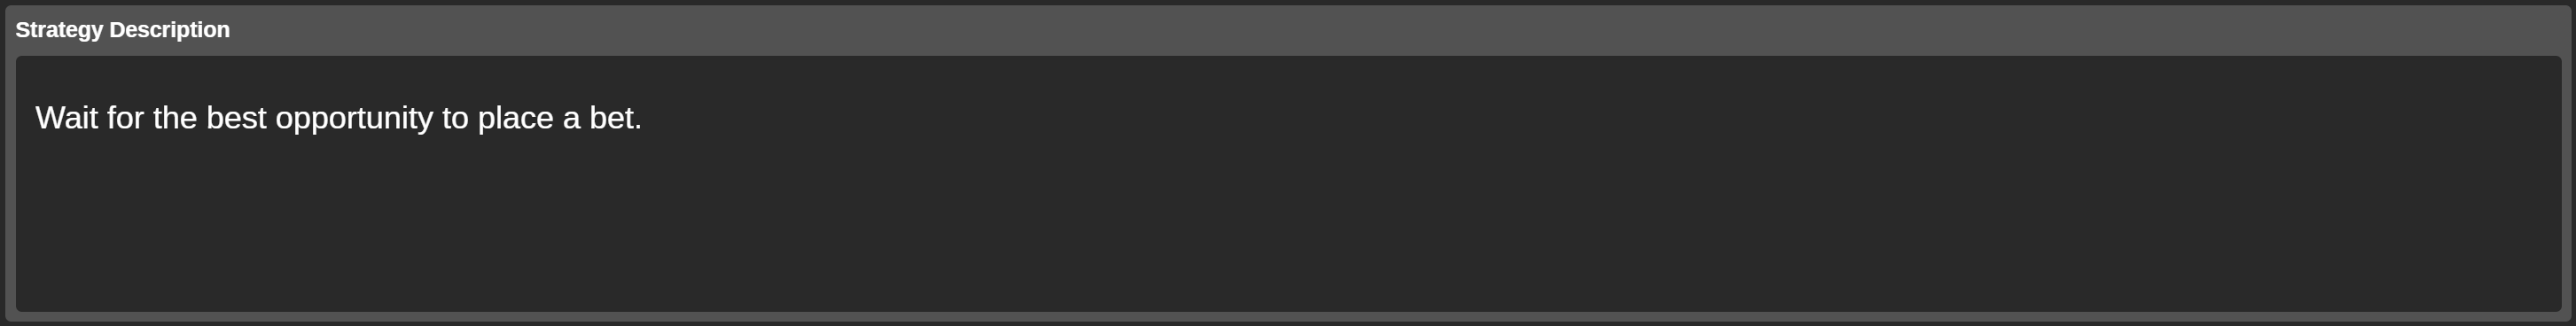
A custom strategy description will offer insight into the strategy advantages and conditions.
Select the strategy provider's cTrader ID (on the individual strategy page or in the strategies list) to access the provider's statistics and their available strategies for copying.
- Total investor funds (live) – the total amount of funds copied by investors with live accounts from all the provider's strategies.
- Active since – the date when the provider started providing their first strategy.
- Average profit – the average profit of all the provider's strategies.
- Investors over all time – the total number of investors who have ever copied the investor's strategies.
- Investors – the number of investors who are copying the provider's strategy(ies) at the moment.
- Active live investors – the number of active live investors who are copying the provider's strategy(ies).
An investor can form a list of their favorite strategies, which forms another tab in cTrader Copy. To add a strategy to the Favorites tab, select the star icon located before the strategy name.
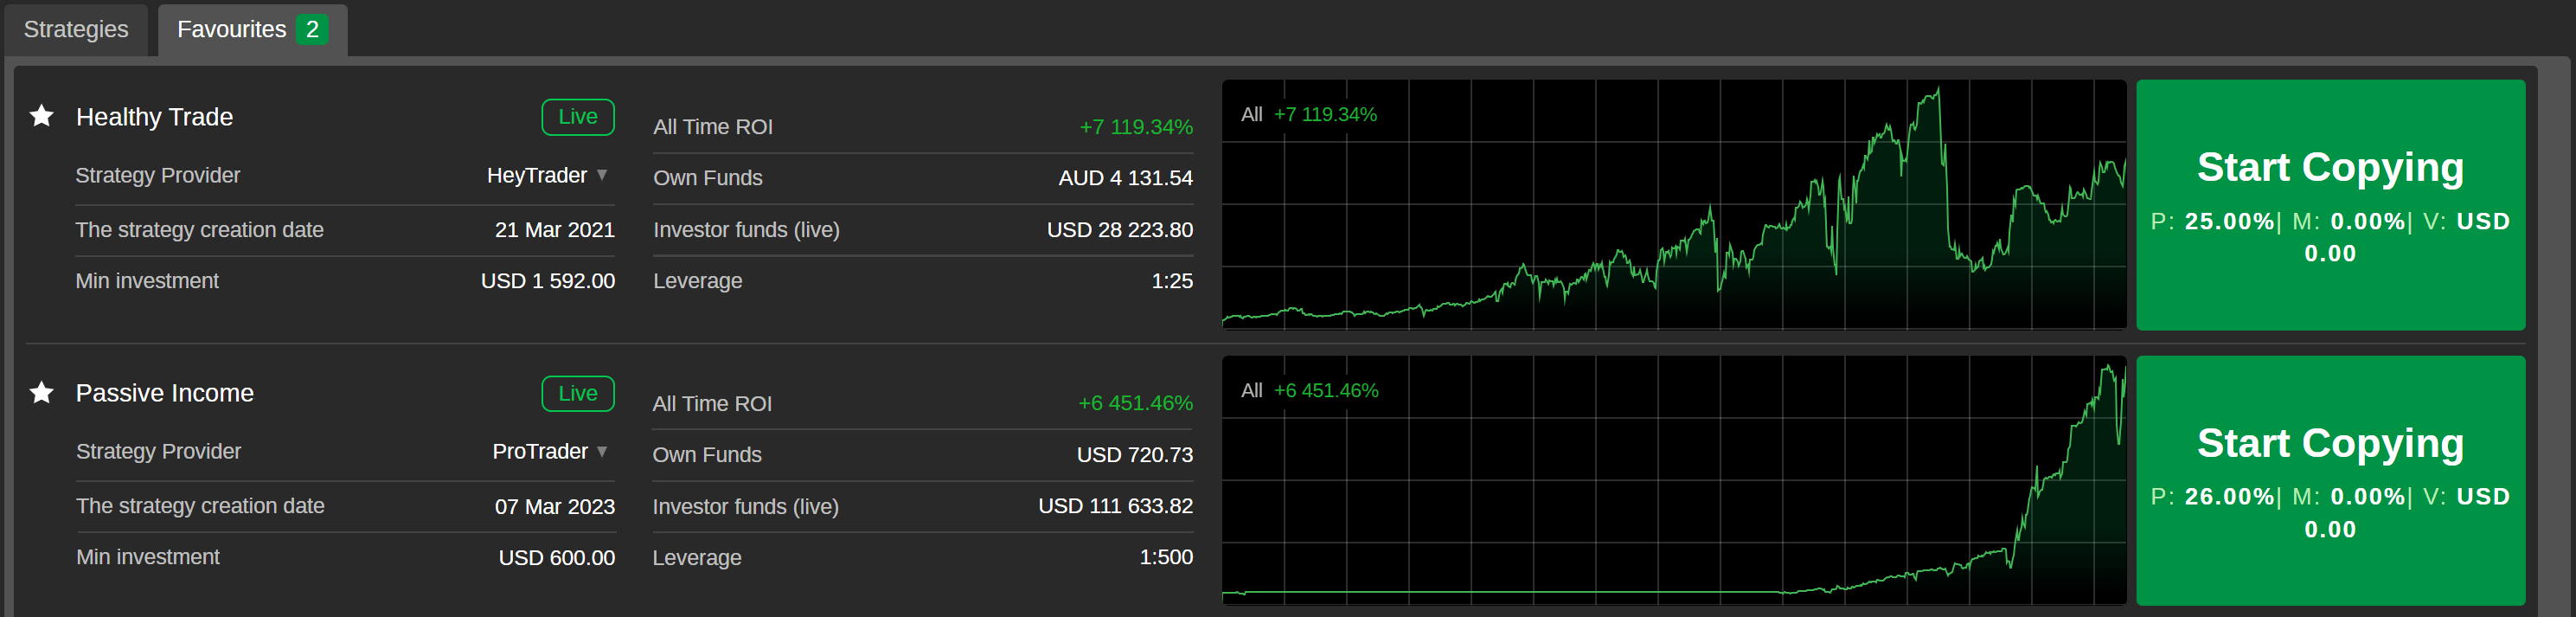
To remove a strategy from the Favorites tab, select the active star icon again.
Strategy stats
Each strategy page contains a selection of charts for the fast and convenient tracking of the strategy data.
Scroll down the strategy page to view the visual charts dedicated to ROI, equity, performance, volume breakdown and investor statistics. Hover the cursor over the charts to view more detailed information.
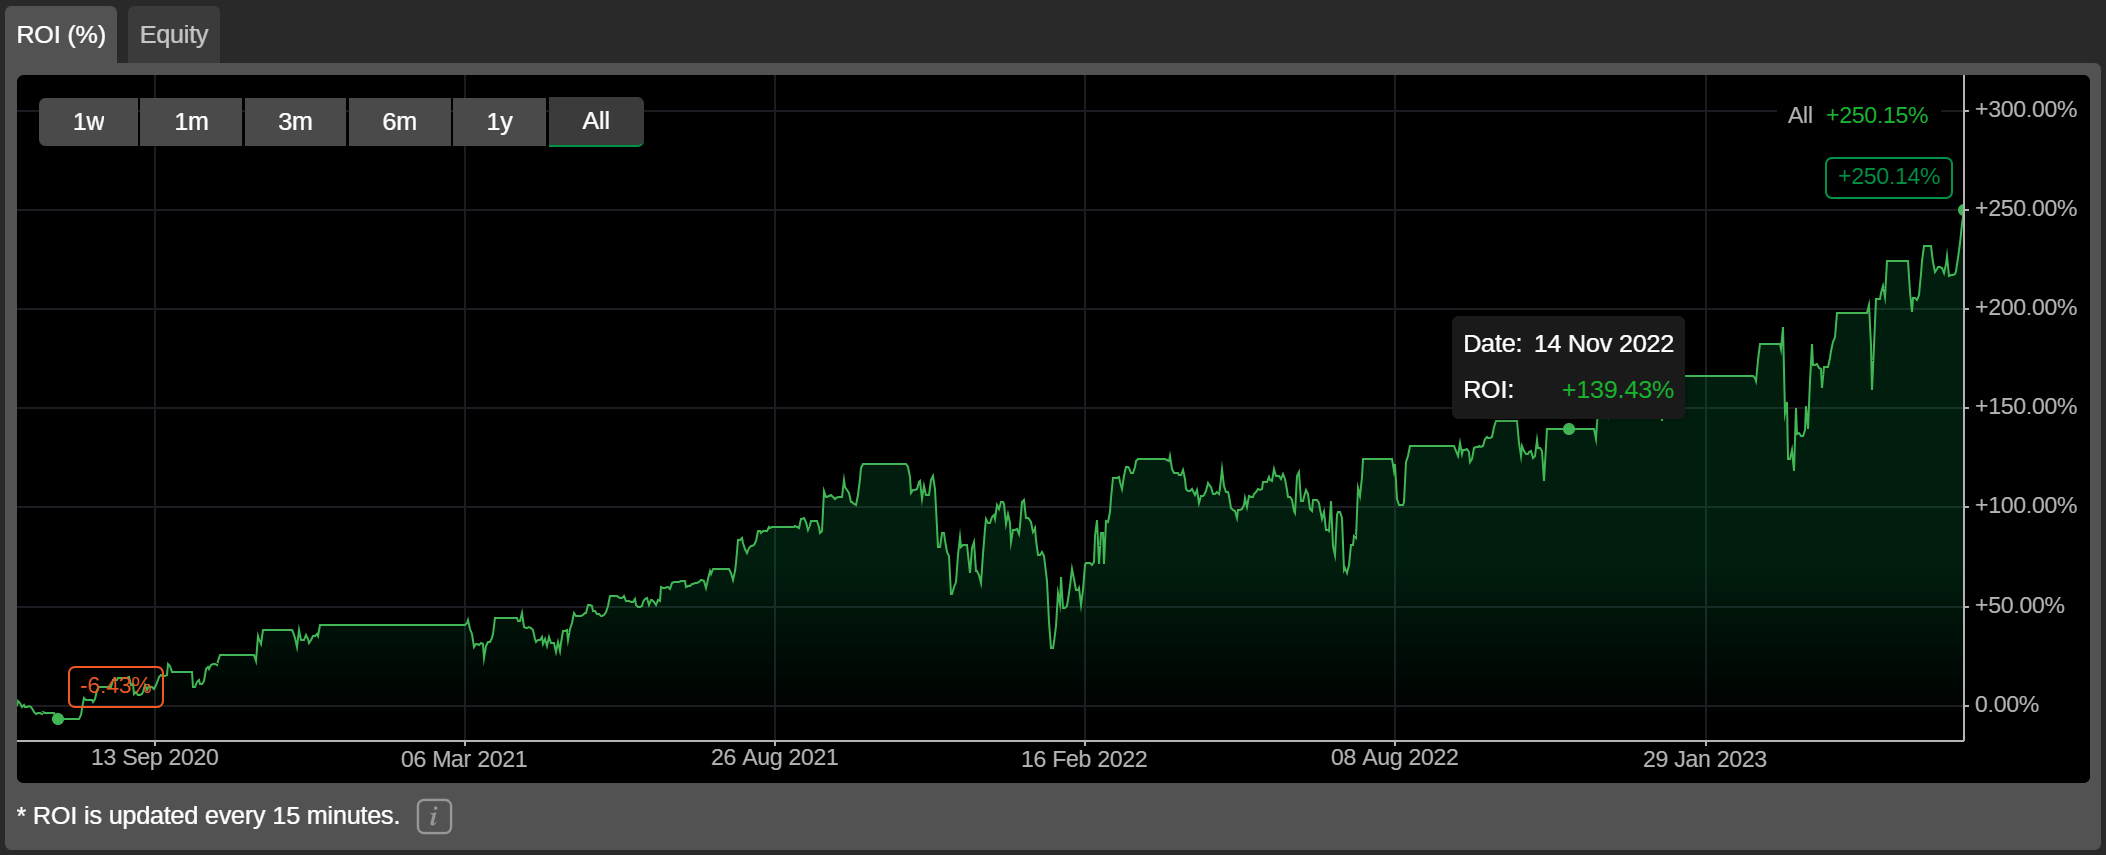
ROI (%)
The ROI (%) chart displays the time on the X-axis and the ROI percentage on the Y-axis.
This chart displays the return on investment the strategy has generated during the chosen period, in relation to the account balance the strategy had at the beginning of the period.
Check the ROI calculation section to access detailed information on how ROI is calculated in cTrader Copy.
You can switch between different periods from one week to all time in the upper left corner of the chart.
Note
The ROI chart is updated daily. When your account becomes a strategy provider, your ROI chart will be updated every 15 minutes.
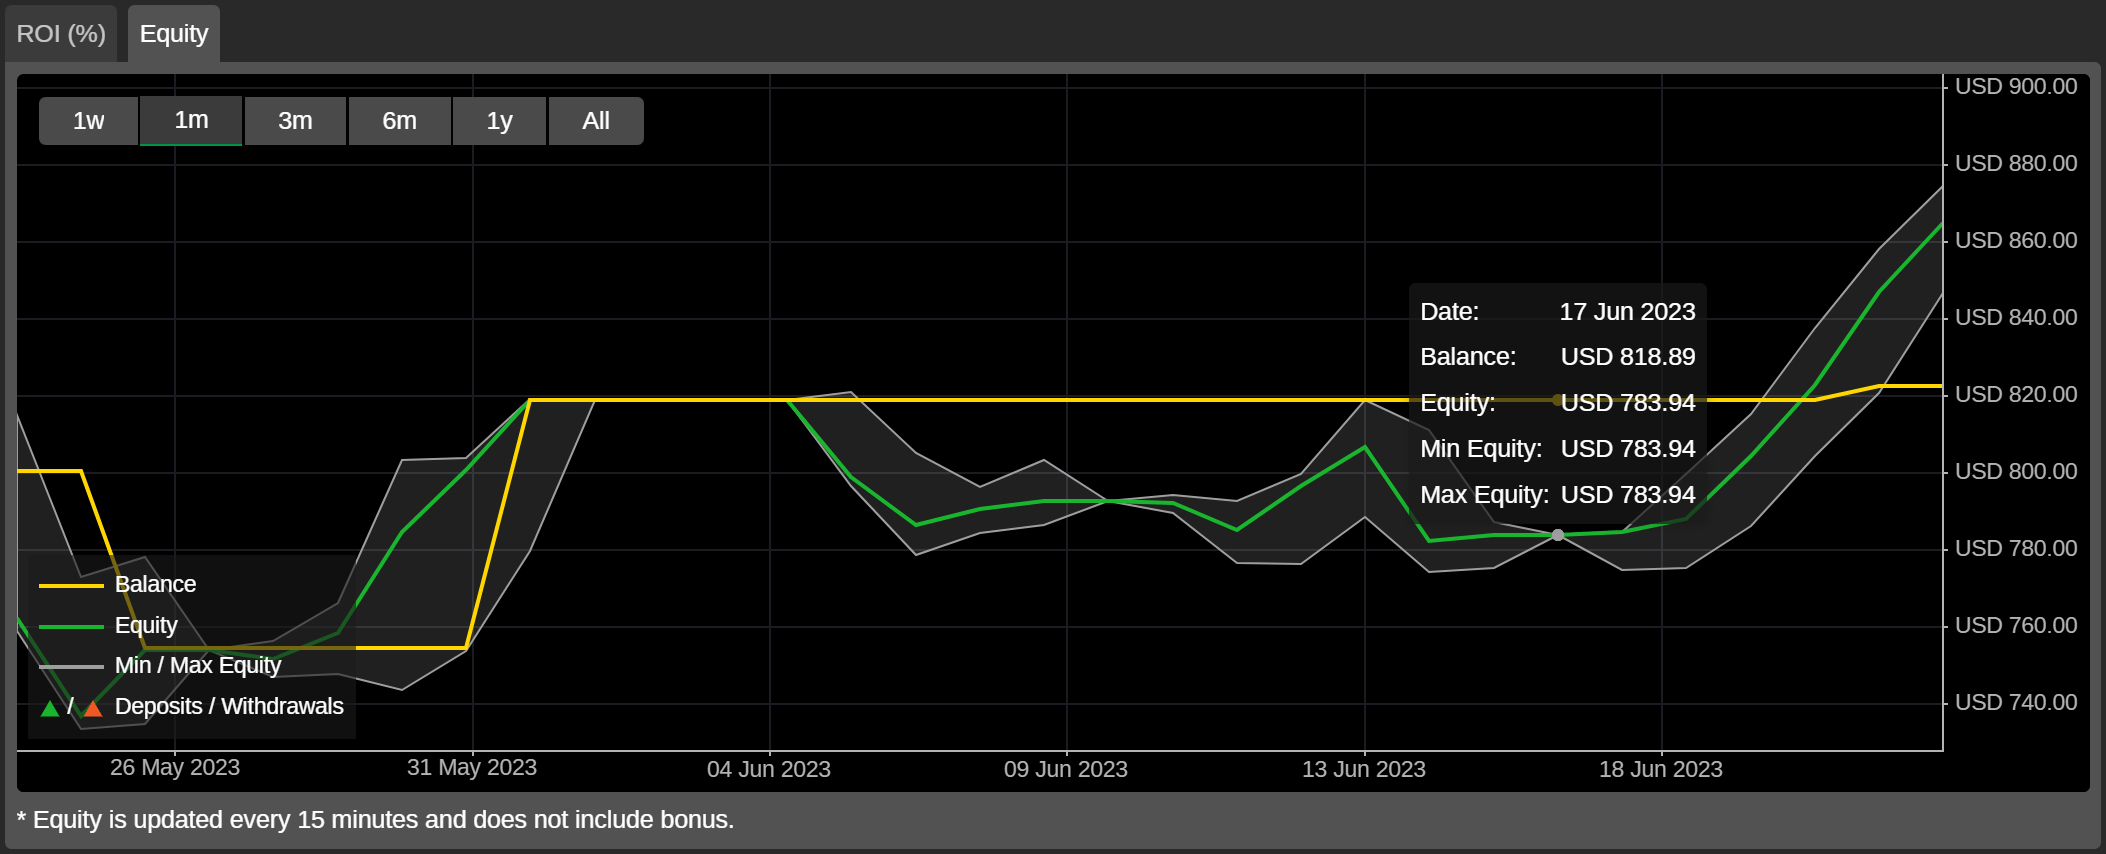
Equity
The equity chart plots time on the X-axis and the cash value on the Y-axis. It indicates the changes in the account equity concerning the account balance over the chosen period. This chart is particularly important to understand the strategy risk factor and what drawdown can be expected.
Details
The basic strategy details are displayed in the Details tab.
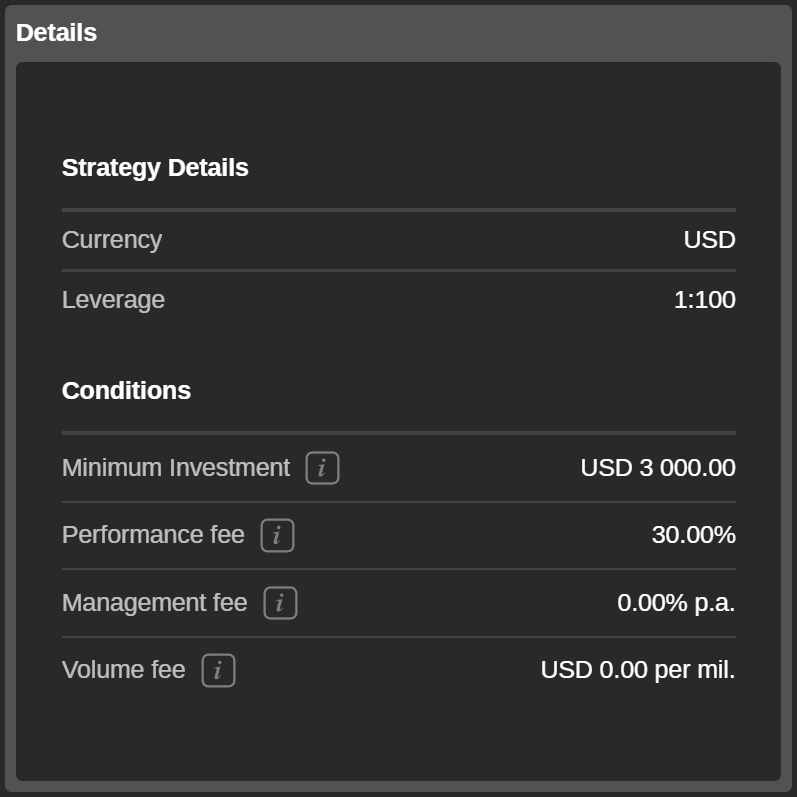
Here, the currency, leverage and copying conditions are displayed. The Conditions section contains information on the investments and fees for copying the strategy:
- Minimum investment – the minimum amount of funds required from the investor's trading account to start copying the strategy. The funds cannot be withdrawn from the copy-trading account if it results in equity falling below the minimum investment level while the strategy is being copied.
- Performance fee – the amount charged for copying the strategy on net profit made, using the high-water mark (HWM) model.
- Management fee – the amount that the strategy provider will charge the investor for managing their funds.
- Volume fee – the amount the investor will be charged per one million of the volume copied.
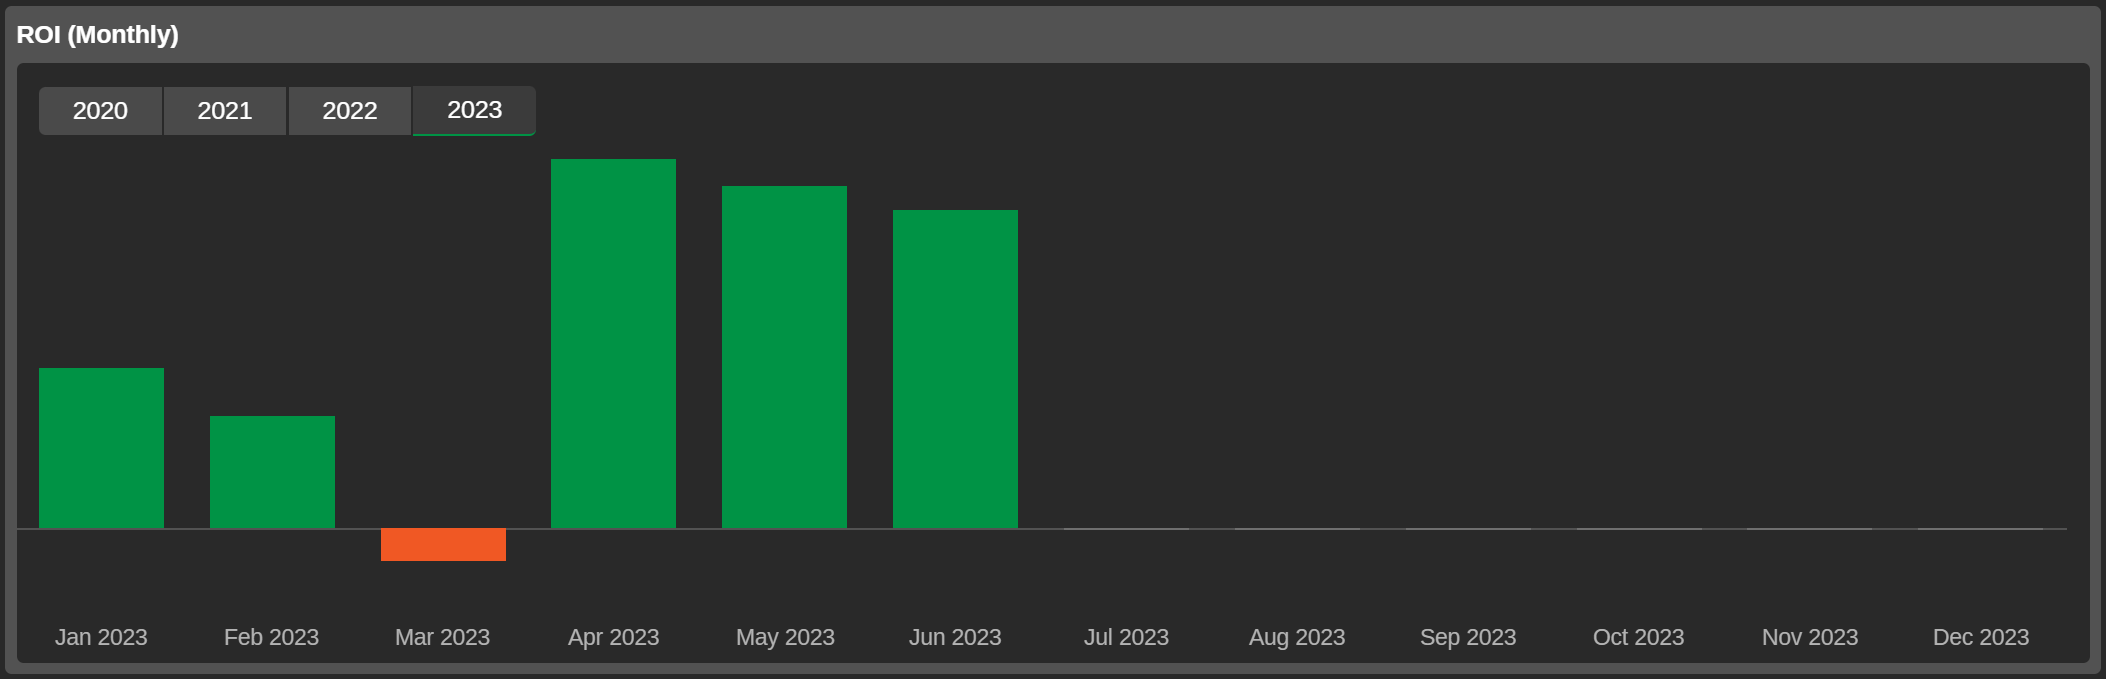
ROI (monthly)
The ROI (monthly) chart displays the return on investment the strategy has generated each month since the account was created.
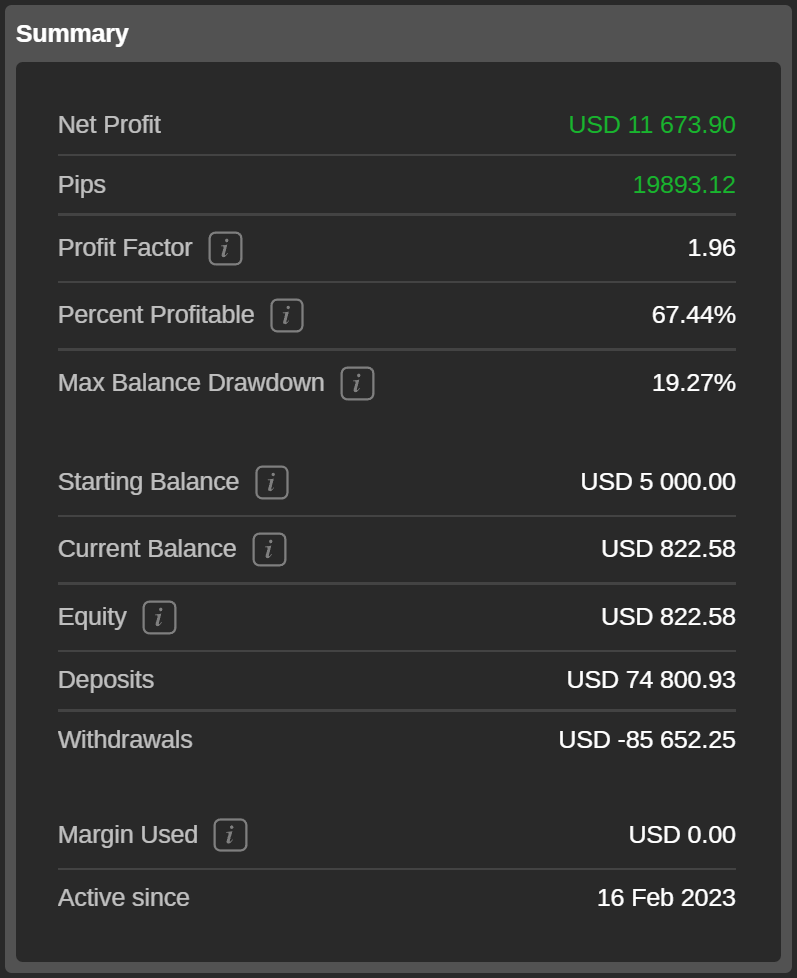
Summary
The Summary section highlights the financial statistics of the strategy provider's account. Here you can view:
- Net profit – the net profit of the strategy provider's account.
- Pips – pips gained by the strategy provider's account.
- Profit factor – the ratio of the total net profit divided by the total net loss of the strategy.
- Percent profitable – the number of winning trades divided by the total number of trades.
- Max balance drawdown – the maximum percentage of balance drawdown.
- Starting balance – the account balance when the account was created.
- Current balance – the current account balance.
- Equity – the account balance minus unrealised net loss, then plus unrealised net profit
- Deposits – the total deposits of the strategy provider's account.
- Withdrawals – the total withdrawals from the strategy provider's account.
- Margin used – the maximum margin between the sum of all long or all short positions margins used.
- Active since – the date when the strategy was provided for copying.
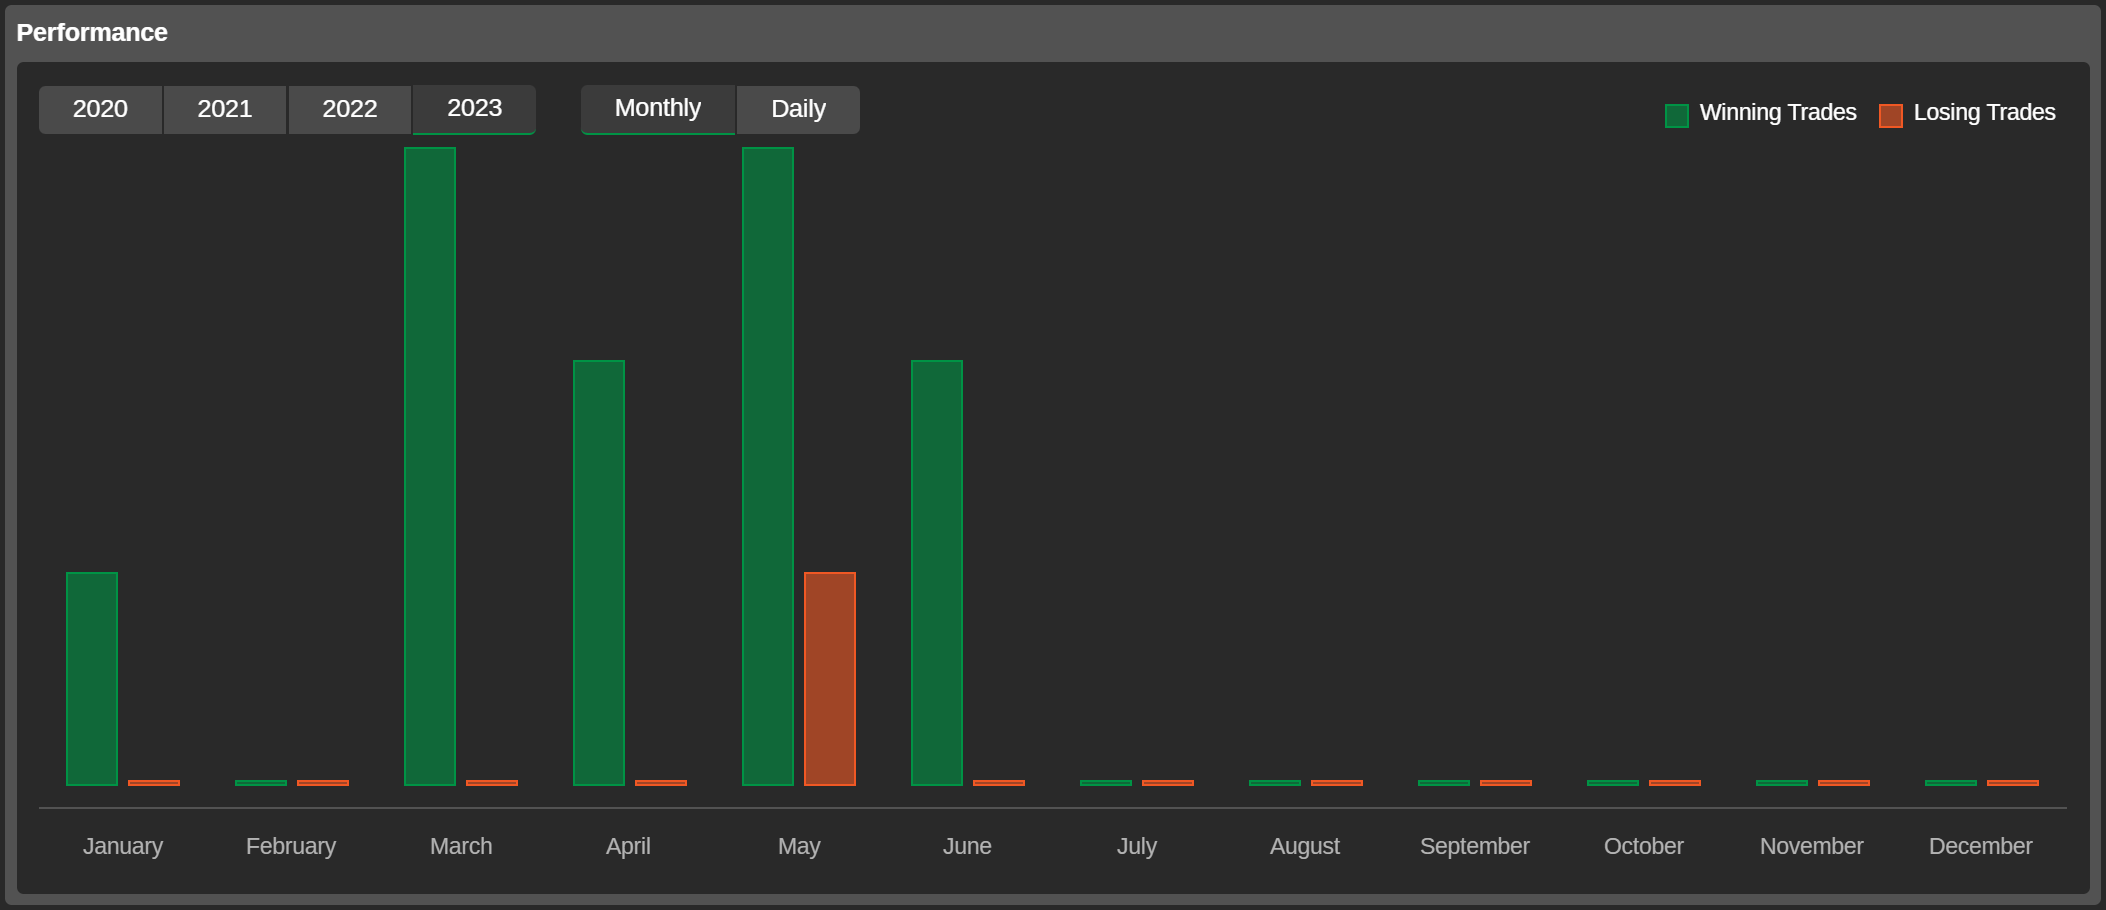
Performance
The performance chart displays the percentage and number of winning and losing trades for the selected periods. Use the period toggles to switch to the desired period. Hover over the chart to see the exact number of trades and their percentage.
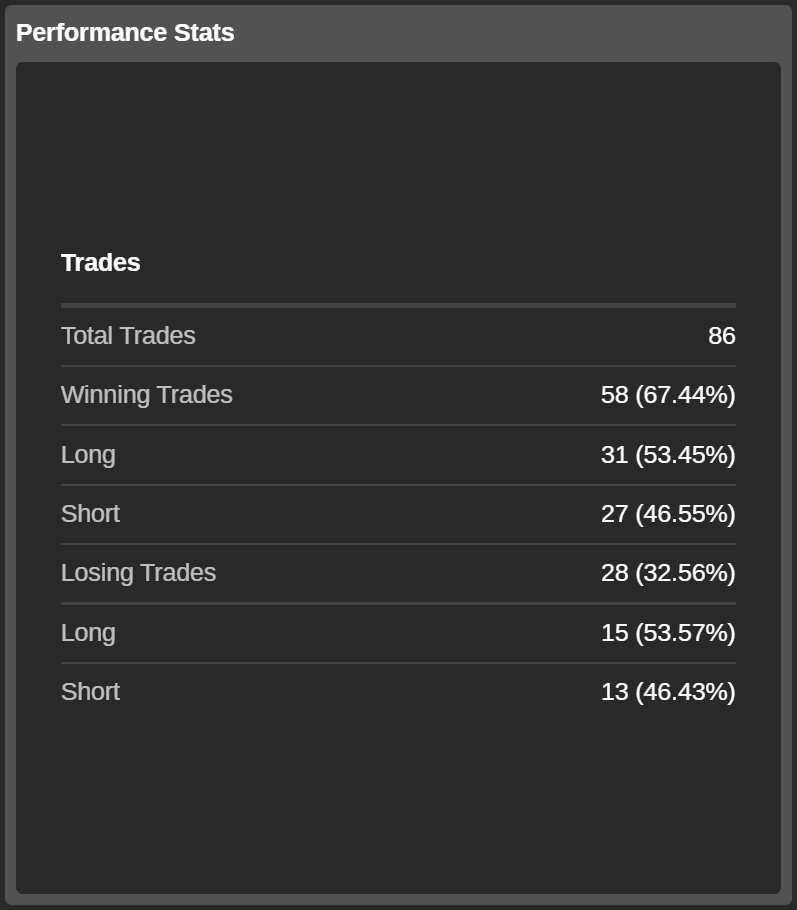
Performance stats
The Performance stats section contains the details on all the trades of the strategy:
- Total trades – the total number of trades of the provider's strategy.
- Winning trades – the total number and the percentage of the winning trades of the strategy.
- Long – the total number and the percentage of all the long winning trades.
- Short – the total number and the percentage of all the short winning trades.
- Losing trades – the total number and the percentage of all the losing trades.
- Long – the total number and the percentage of all the long losing trades.
- Short – the total number and the percentage of all the short losing trades.
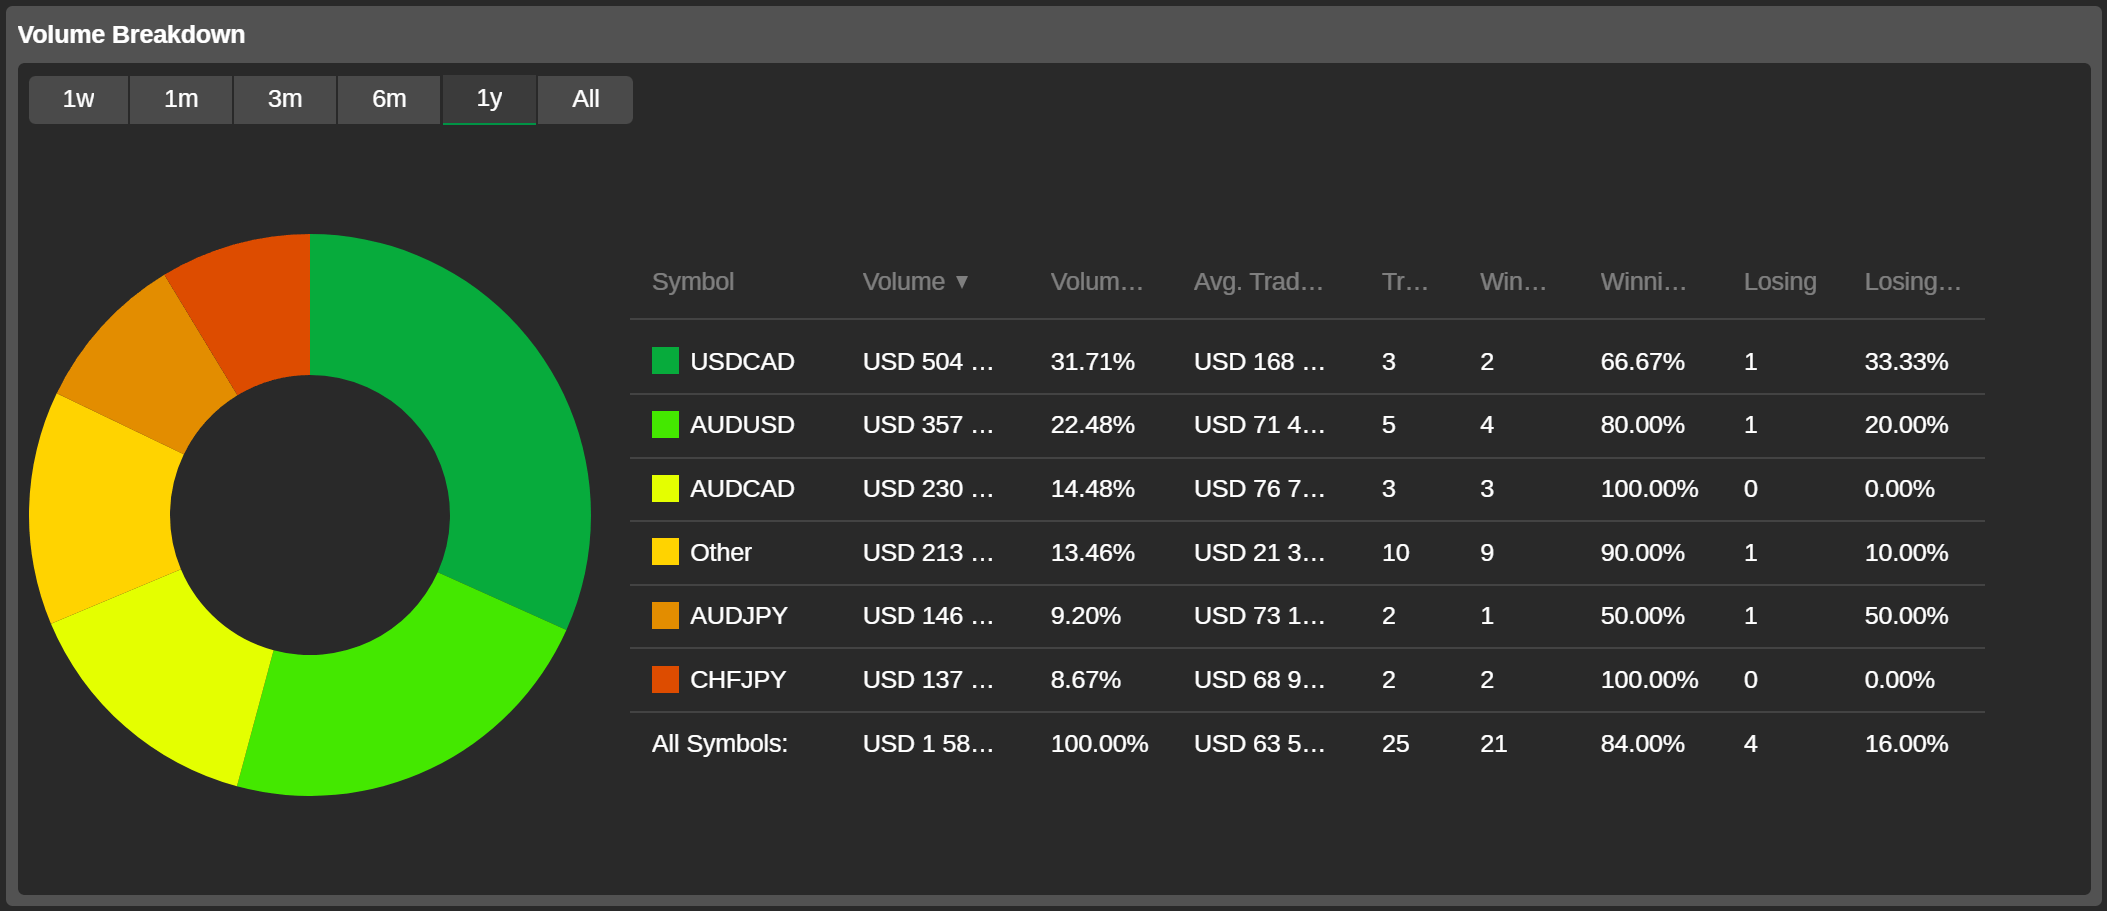
Volume breakdown
The Volume breakdown pie chart displays the symbols that were traded, their respective volumes, average trading size, the number of trades per symbol and the number of winning and losing trades with their percentage from the total traders throughout the strategy.
Note
When choosing a strategy to copy, check whether the strategy provider is trading the same symbols as those that are available from your broker.
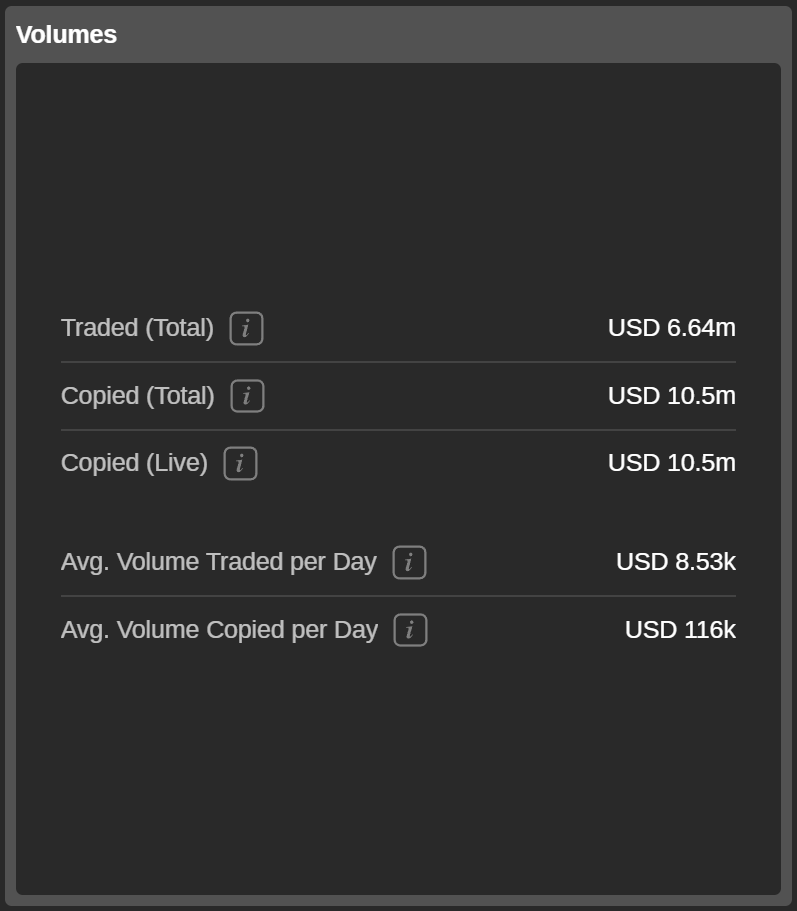
Volumes
The Volumes section displays all the strategy traded volumes statistics including:
- Traded (total) – the total volume traded by the current strategy.
- Copied (total) – the total volume that has been copied by all the investors of the strategy since it was created.
- Copied (live) – the total volume copied by the investors with live accounts.
- Average volume traded per day – the average volume traded by the strategy per day.
- Average volume copied per day – the average volume copied from the strategy by all the investors per day.
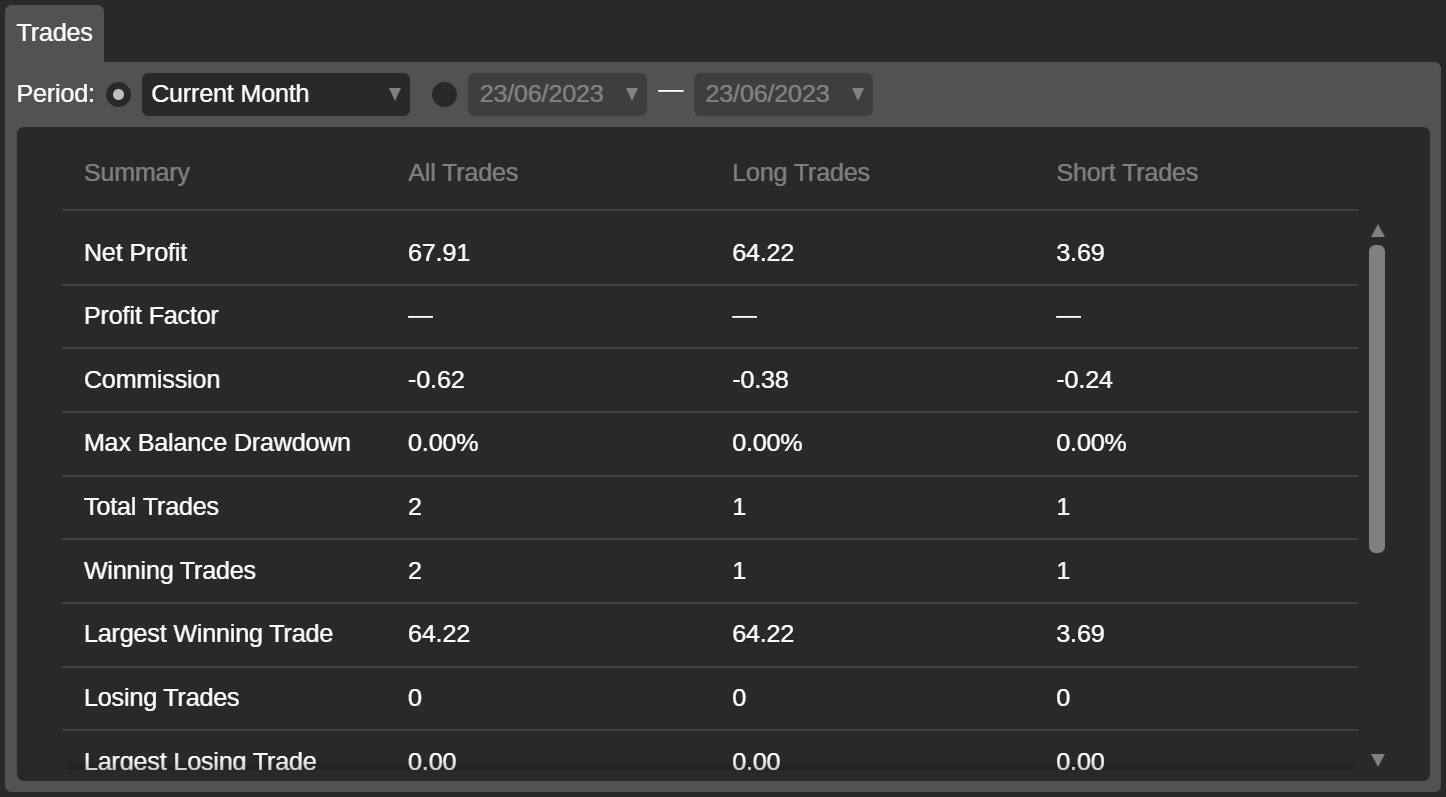
Trades
All the strategy trades information is displayed in the Trades tab.
The trade information can be filtered by the standard period from Today to All history, or by the custom period specified by investors.
Below the period filter, you can find the following trades statistics with the division into all trades, long trades and short trades.
- Net profit – the net realised profit of all trades throughout the strategy.
- Profit factor – the ratio of the total net profit divided by the total net loss.
- Commission – the total amount of commissions paid to the broker.
- Maximum balance drawdown – the maximum percentage of the balance drawdown recorded for the strategy.
- Total trades – the total number of closed positions throughout the strategy.
- Winning trades – the total number of the strategy winning trades.
- Largest winning trade – the closing deal with the largest positive result throughout the strategy.
- Losing trades – the total number of the strategy losing trades.
- Largest losing trade – the closing deal with the largest negative result throughout the strategy.
- Average trade – the average profit for all trades throughout the strategy.
- Total pips won – the number of pips that the strategy has won.
- Average pips won per trade – the total pips divided by the number of trades throughout the strategy.
- Average trade duration – the total time of open trade for the account divided by the number of trades.
- USD volume traded – the total amount in USD traded throughout the strategy.
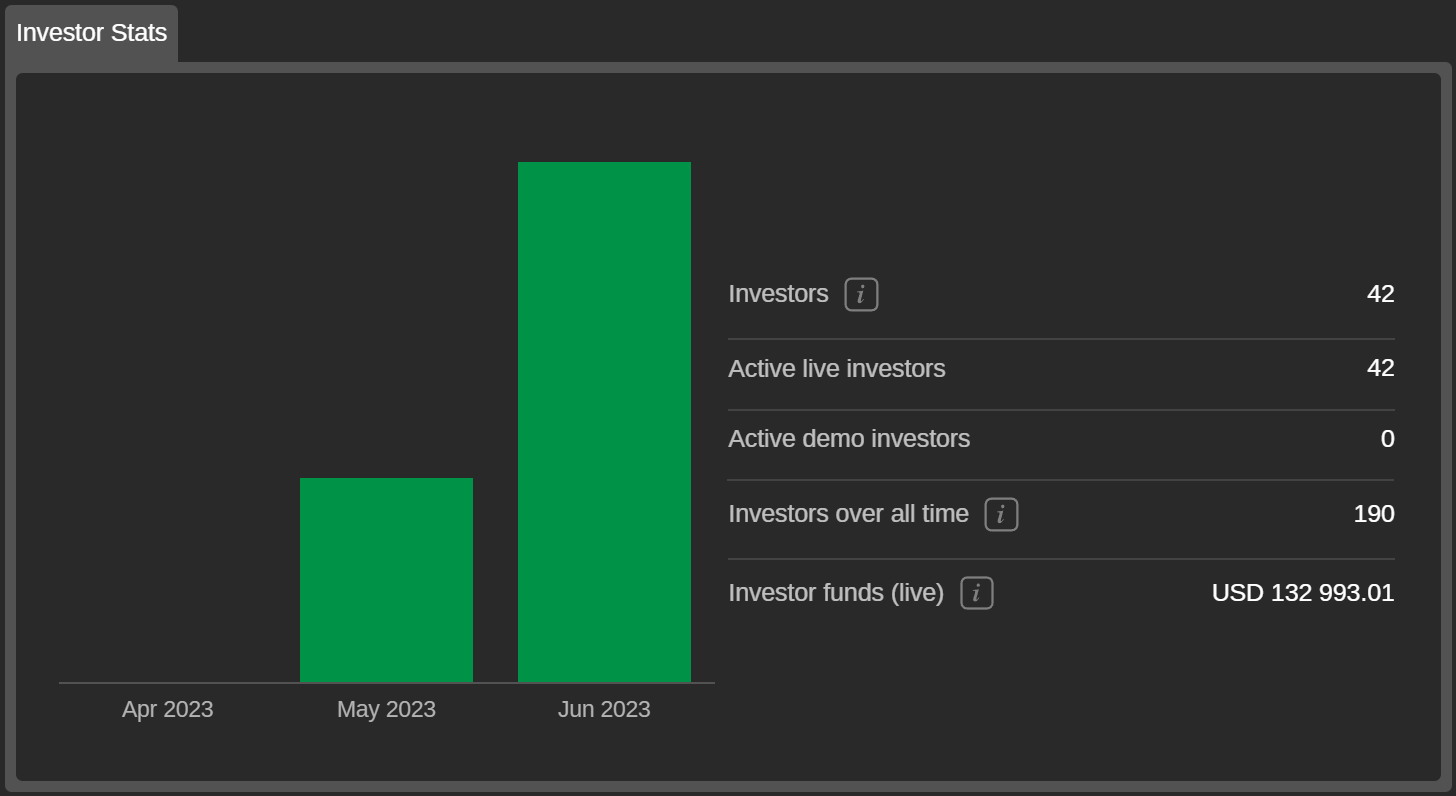
Investor stats
The Investor stats chart displays the statistics of the strategy investors.
- Investors – the total number of investors currently copying the strategy.
- Active live investors – the number of investors currently copying the strategy on live accounts.
- Active demo investors – the number of investors currently copying the strategy on demo accounts.
- Investors over all time – the total number of investors who have copied the strategy since it was created.
- Investor funds (live) – funds currently copied by investors with live accounts.
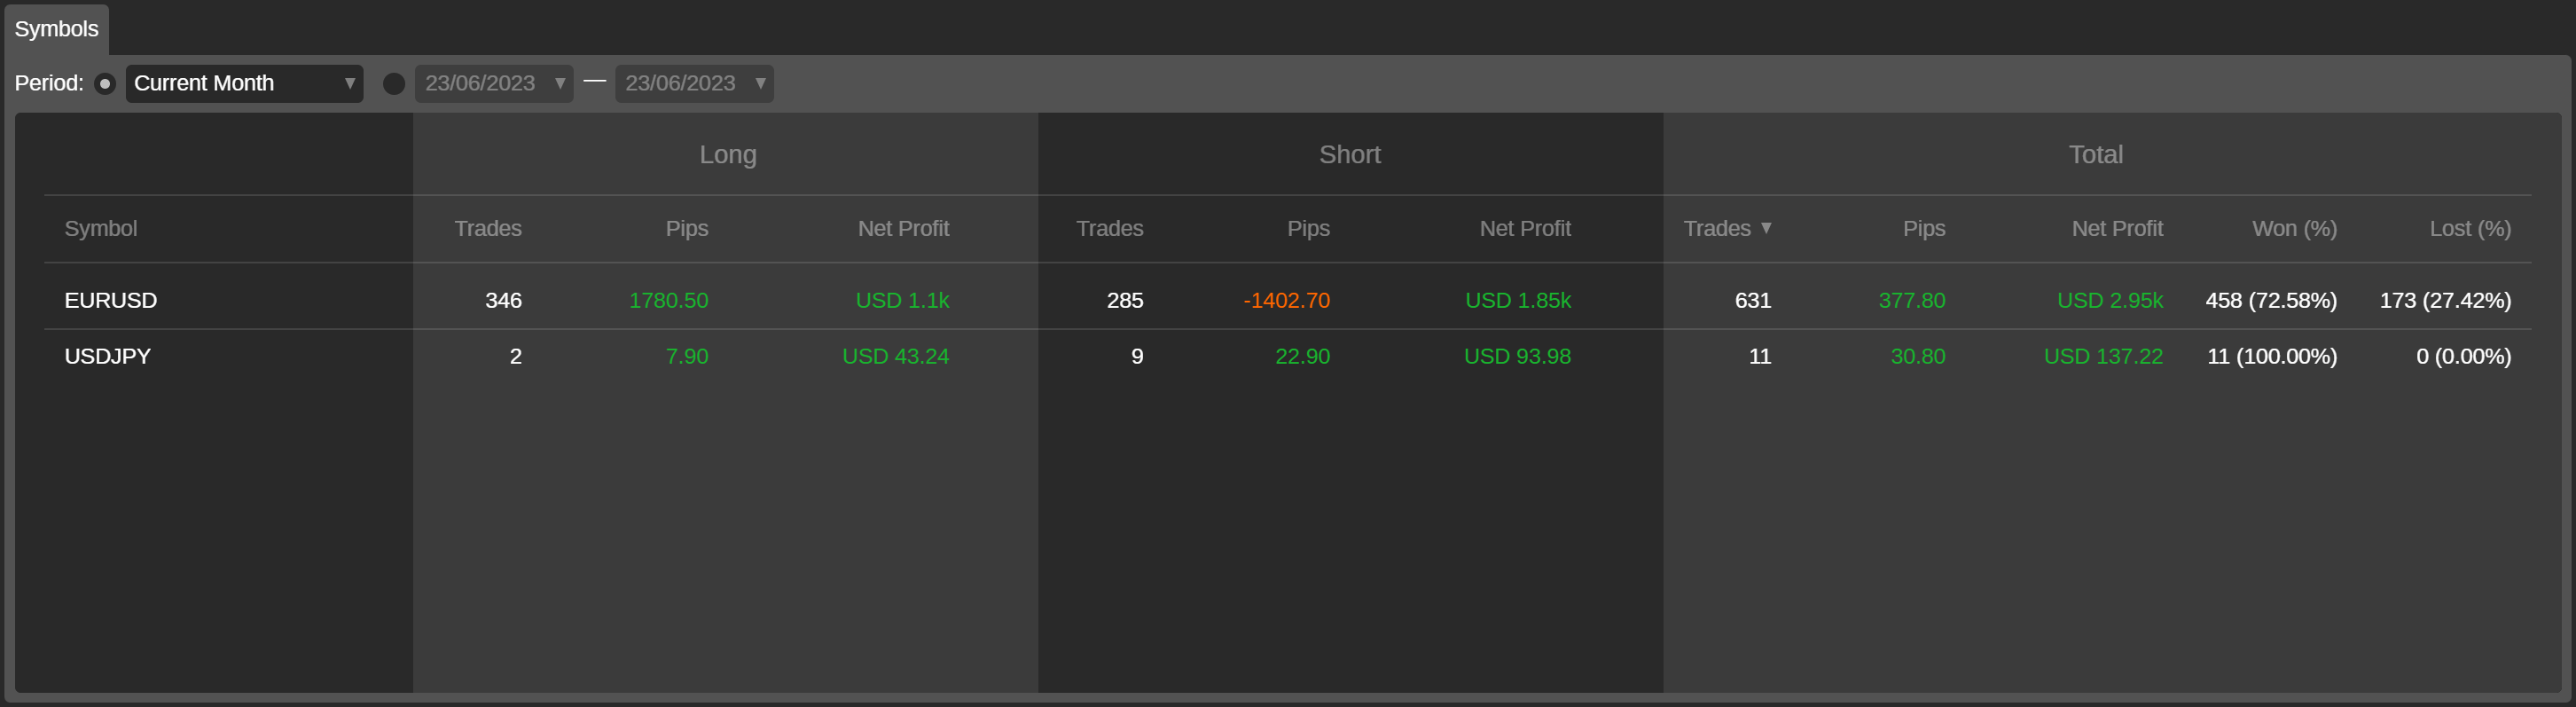
Symbols
The Symbols tab lists all the symbols the current strategy is trading, based on the closed positions. The statistics on trades, pips, net profit and won and lost percentage are displayed in the columns corresponding to long, short and total positions.
You can filter the list of symbols by applying standard and custom periods.
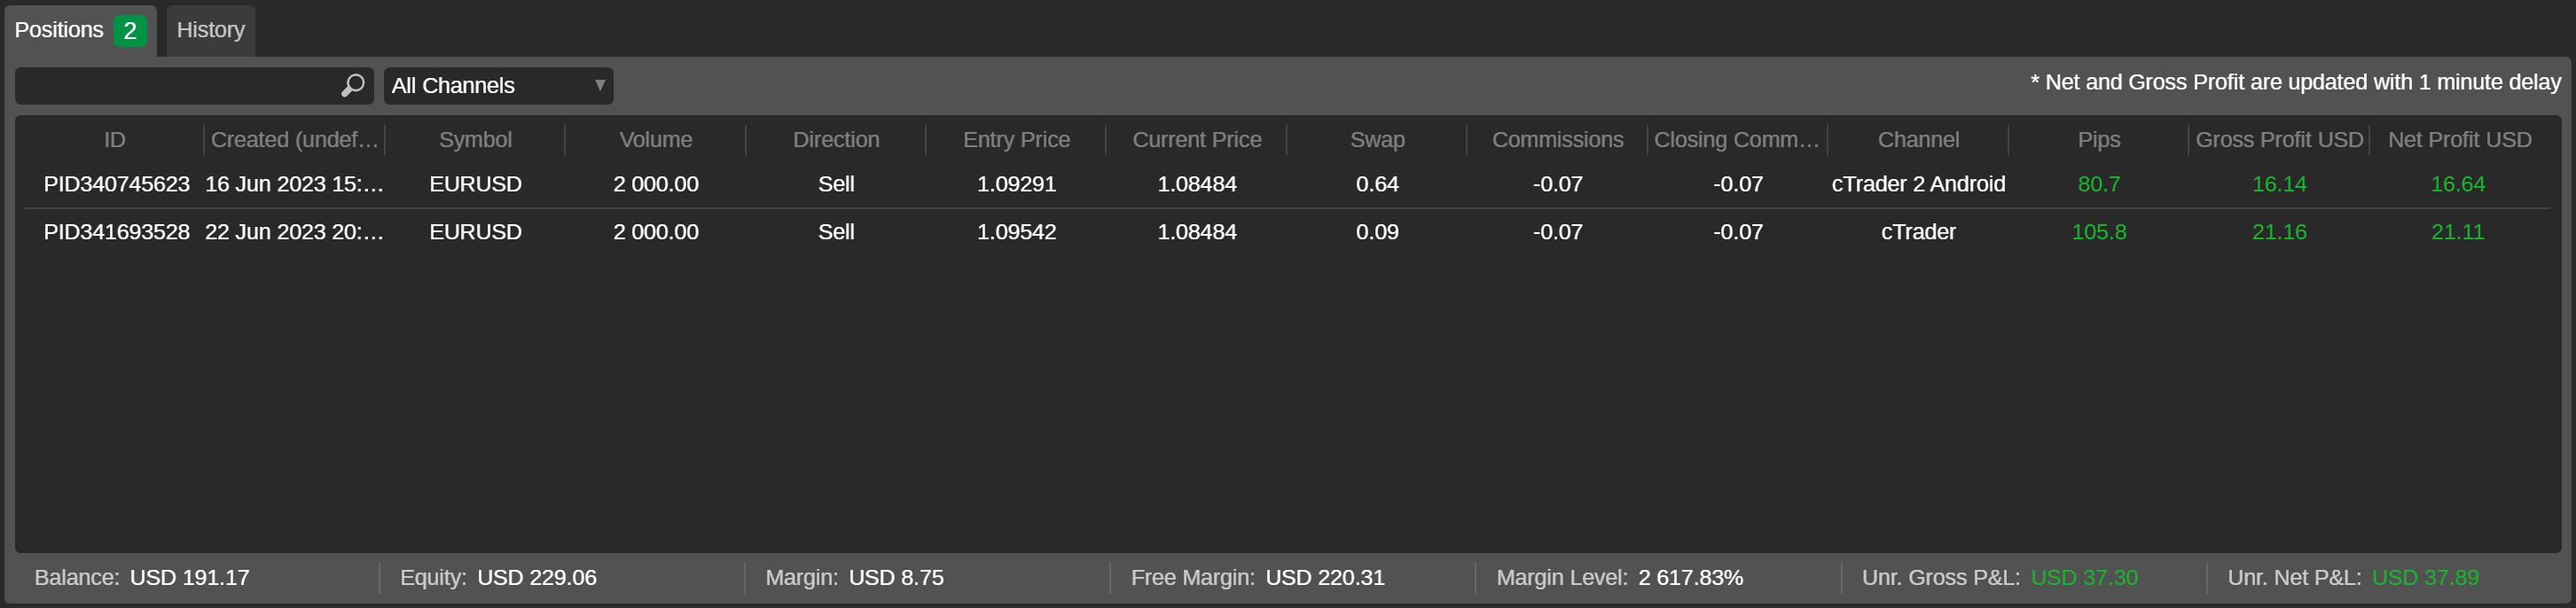
Positions
In the Positions tab, the current open positions of the copied strategy are listed.
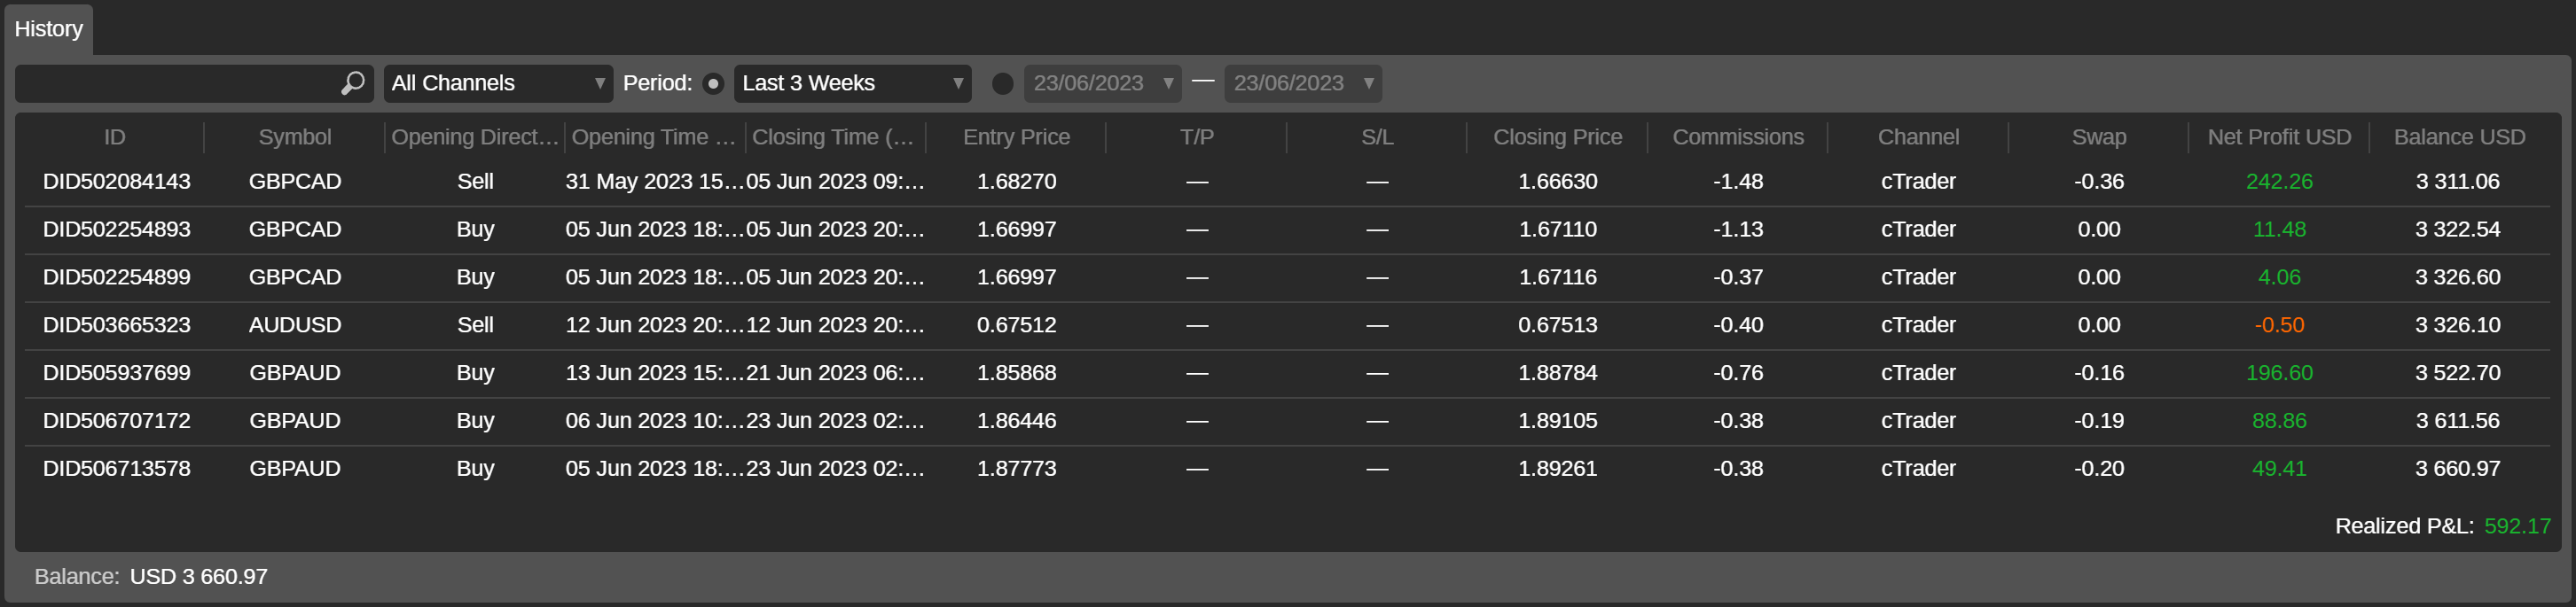
History
The History tab lists all the closing deals of the strategy.