Charts
cTrader charts graphically represent price movements of a symbol over time. A chart is the most basic tool for trading and technical analysis.
Note
In the Chart section of cTrader settings, you can set the mouse wheel to zoom or scroll the chart. Spinning the mouse wheel while holding Cmd performs the other action.
View other default hotkeys for cTrader Mac in a separate guide.
You can also drag the chart up and down, left and right to view the desired area.
Open a chart
There are several ways to open a new chart in cTrader Mac.
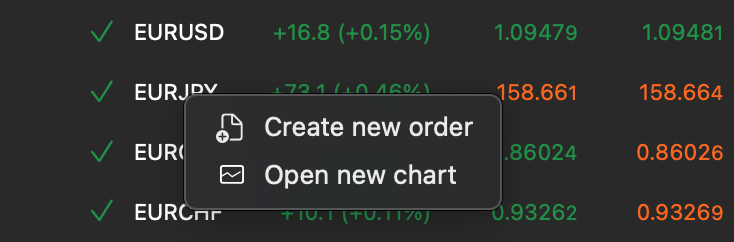
Double-click a symbol in the Market Watch panel and the corresponding chart will open. You can also right-click the needed symbol and select Open new chart in the context menu.
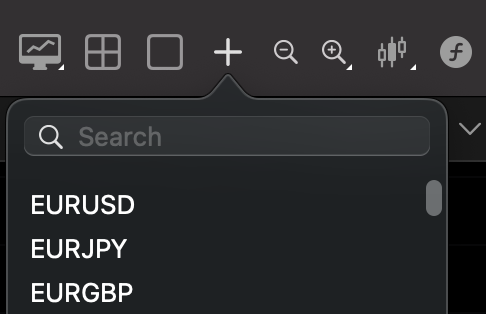
Alternatively, click the Open new chart button in the Chart toolbar and select a symbol from the list for which you want to open a chart.
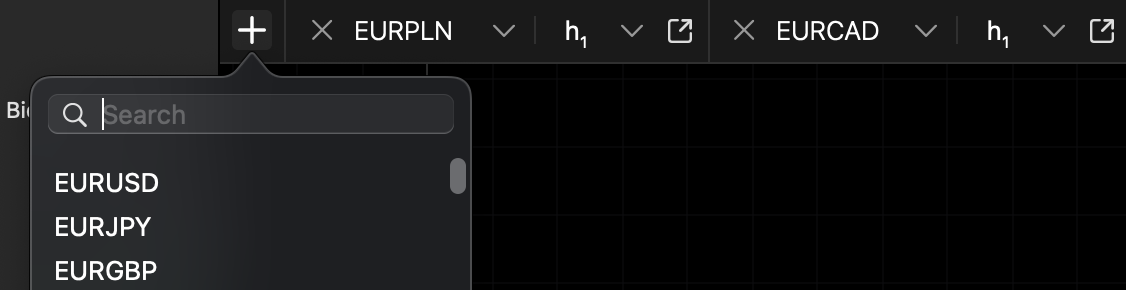
If the Single-chart mode is on, you can add new charts by clicking the + icon located to the left of all tabs.
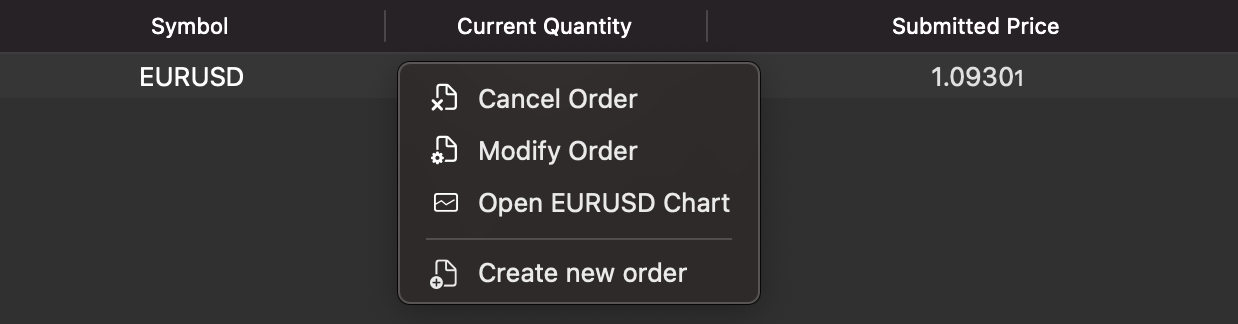
By accessing positions and pending orders in the Trade Watch panel and right-clicking them, you can open the corresponding charts from the context menu.
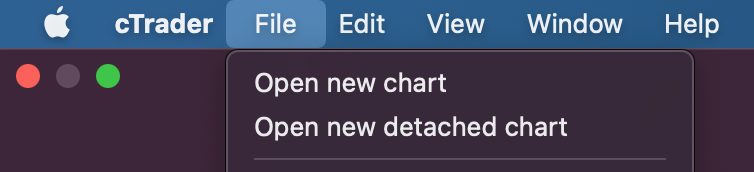
Finally, you can open a new chart or a new detached chart from the menu bar of cTrader Mac in the File menu. The hotkeys for these actions are Cmd+N and Cmd+Shift+N respectively.
To display another symbol in the active chart tab, click a symbol in the Market Watch panel or click a position or pending order in the Trade Watch panel. You can also switch between symbols in the chart tab or via the chart context menu.
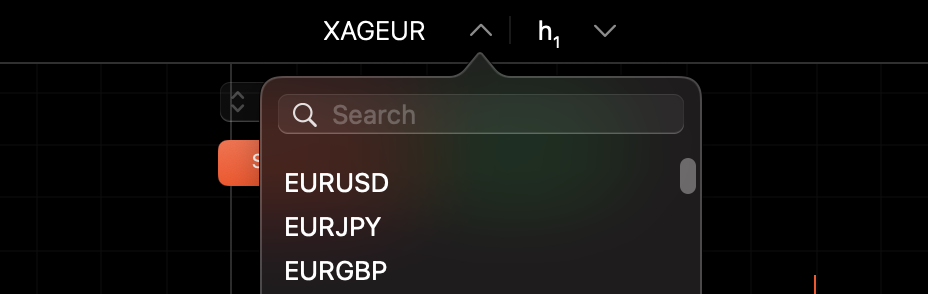
Chart modes
In cTrader Mac, you can switch between single-chart and multi-chart modes by clicking the corresponding icons in the Chart toolbar.

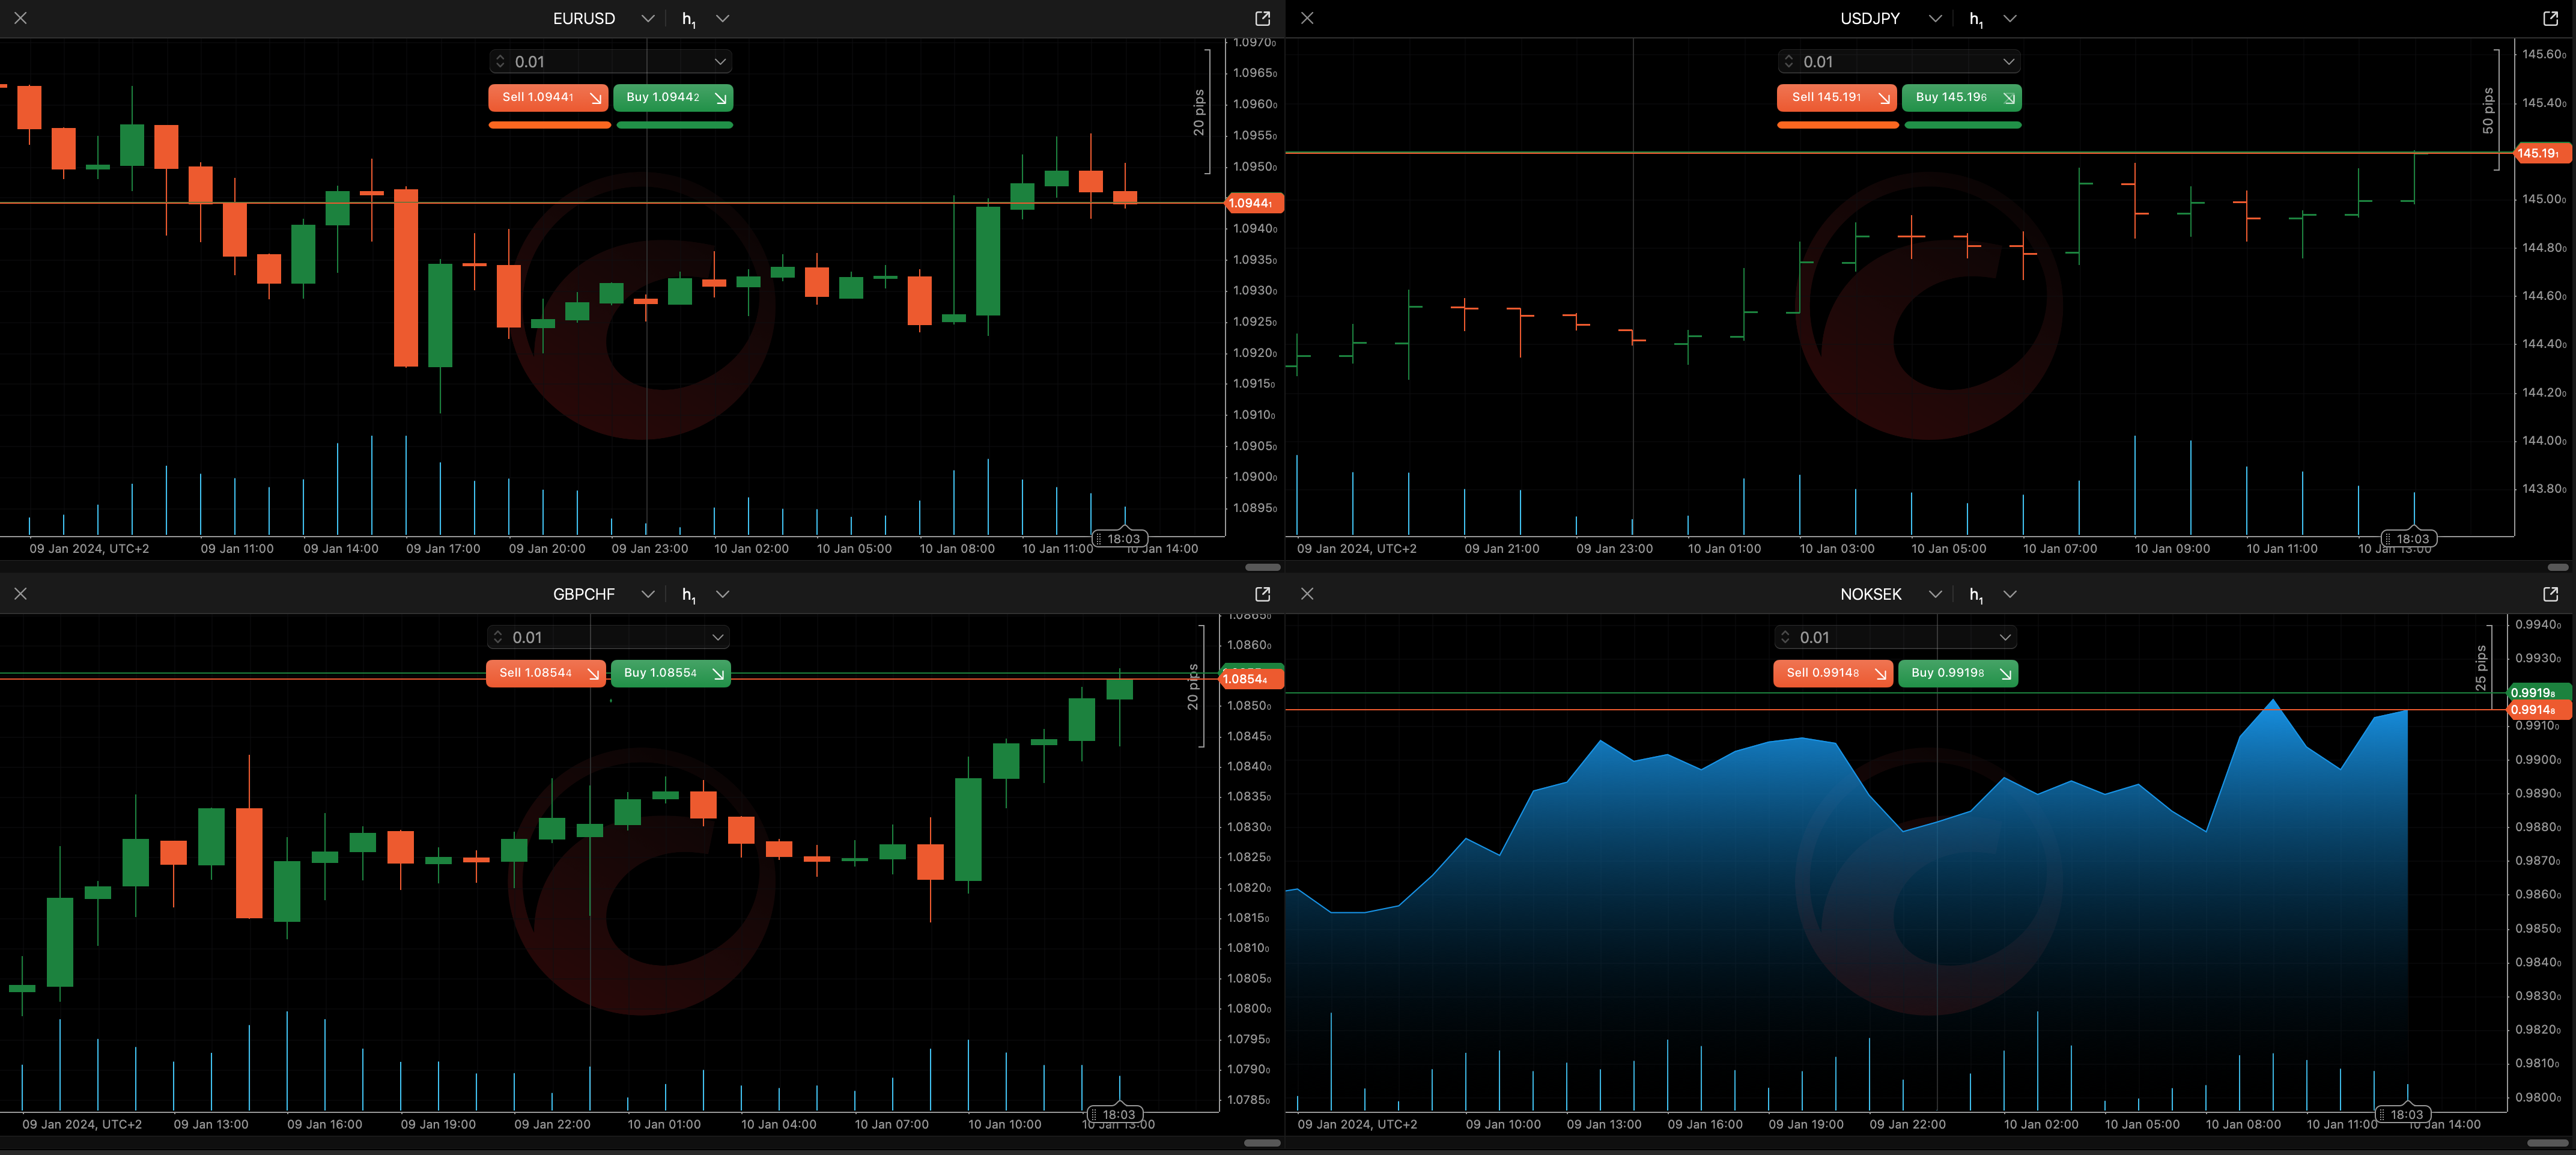
Chart types
cTrader Mac offers several types of charts for trader convenience.
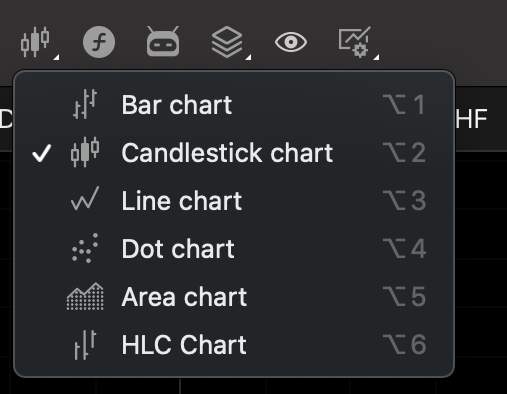
Learn more about chart types in cTrader.
Chart context menu
Click anywhere on your active chart to open the Chart context menu, which gives you quick access to many cTrader features and UI elements such as creating new orders, setting price alerts, modifying the chart and managing chart objects directly from the chart.
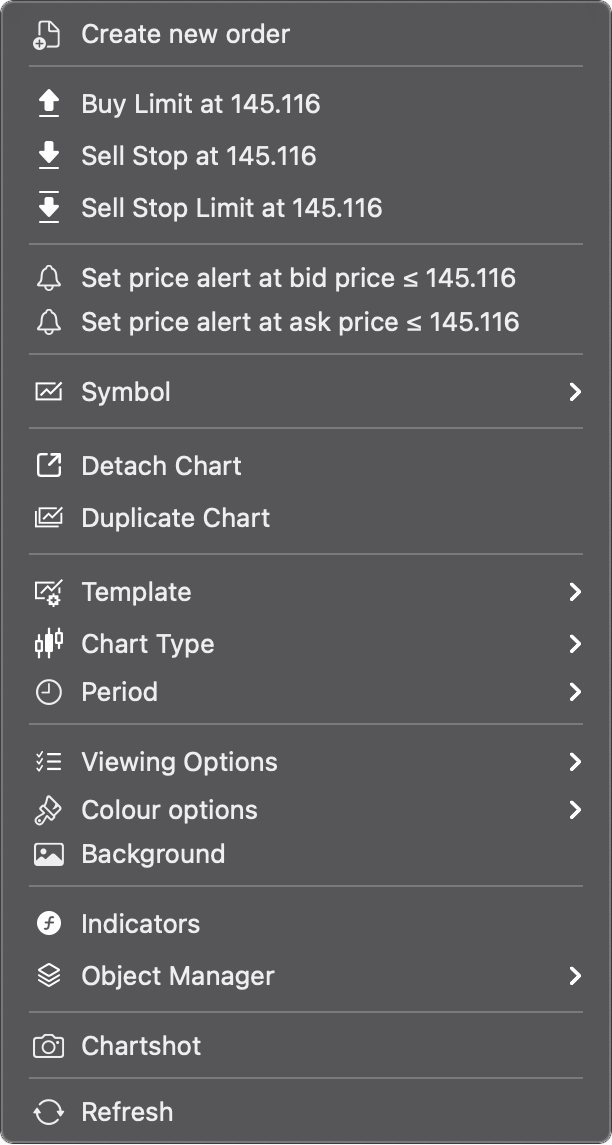
Learn more about the Chart context menu in our cTrader Web guide.
Chart tab
Regardless of the chart mode, you can detach specific charts and open them in a new window along with the Chart toolbar. To do so, click the Detach chart button in the top-right corner of each chart tab.
In the chart tab, you can modify the symbol displayed on the chart.
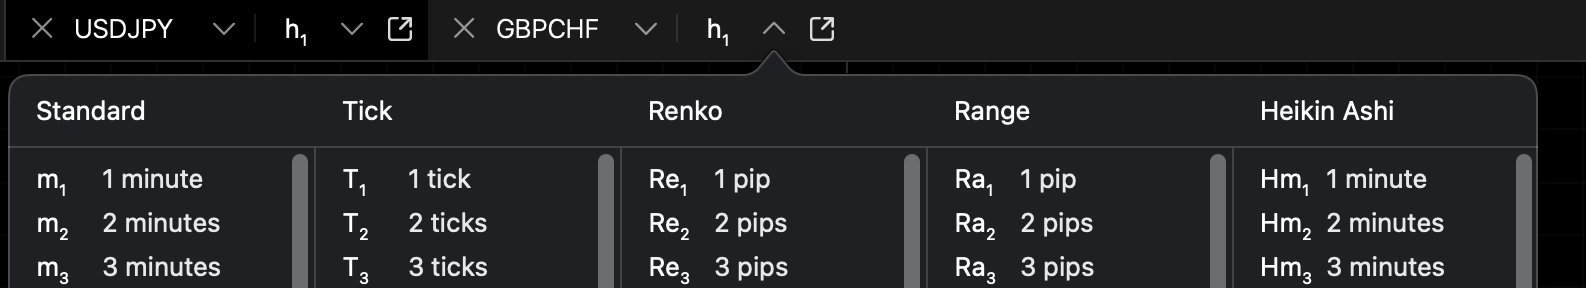
The period menu for each chart type is available in the chart tab to the right of the symbol selector.
Chart toolbar
The Chart toolbar is located above the charts area.

It contains the following tools:
- Sidebar and Trade Watch controls
- New order
- Workspaces
- Multi-chart mode
- Single-chart mode
- Open new chart
- Zoom in/out
- Chart types
- Indicators
- cBots
- Object manager
- Hide/show all drawings
- Chart templates
Learn more about the Chart toolbar in our cTrader Windows guide.
Instrument toolbar
cTrader Mac offers a comprehensive set of line studies and special objects for advanced technical analysis.

The Instrument toolbar contains the following tools:
- Cursor
- Crosshair
- Synchronised crosshair
- Market snapshot
- Lines
- Equidistant price channel
- Andrews' pitchfork
- Fibonacci tools
- Shape objects
- Markers
- Text
- Colours
- Chartshot
- Price alert
Learn more about the Instrument toolbar in our cTrader Windows guide.
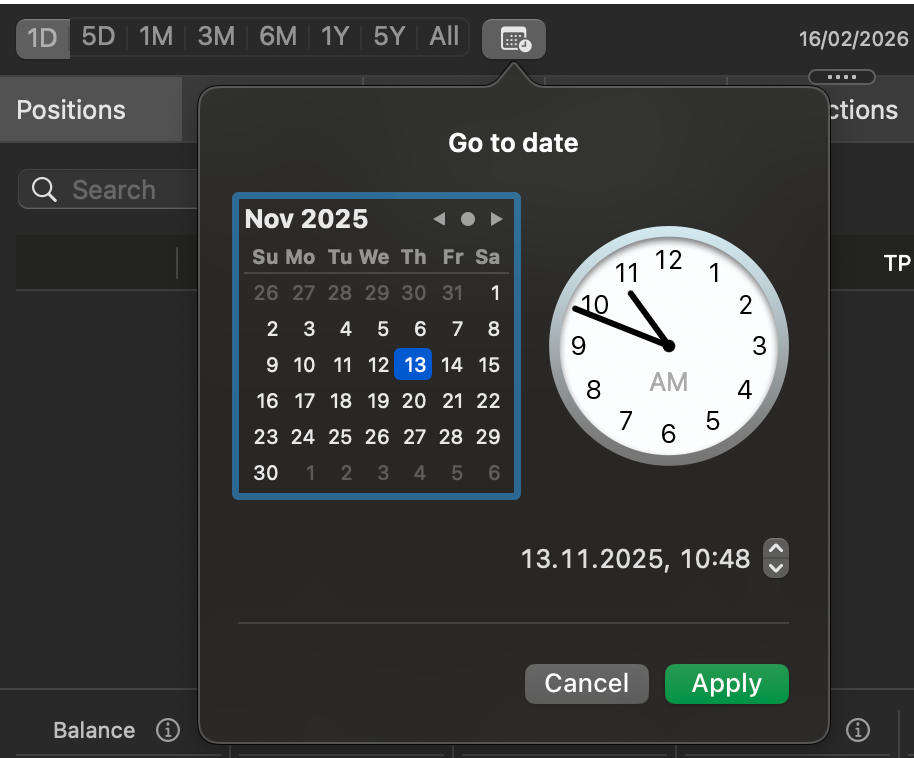
Chart navigation
Display any chart within a popular date range by clicking a preset option below the chart, such as 1D, 5D, 1M, 3M, 1Y, 5Y or All.
You can also jump instantly to a specific point in history without manual scrolling. Click the calendar icon below the chart, choose a date and time, then click Apply.
Object manager
The object manager allows you to manage all active drawings or indicators from a single location. To open the object manager, click the Object manager icon in the chart toolbar, then select Drawings or Indicators.
![]()
Note
You can also open the object manager via Cmd+D or Cmd+I.
The Drawings tab lists all objects on the chart, excluding indicators.
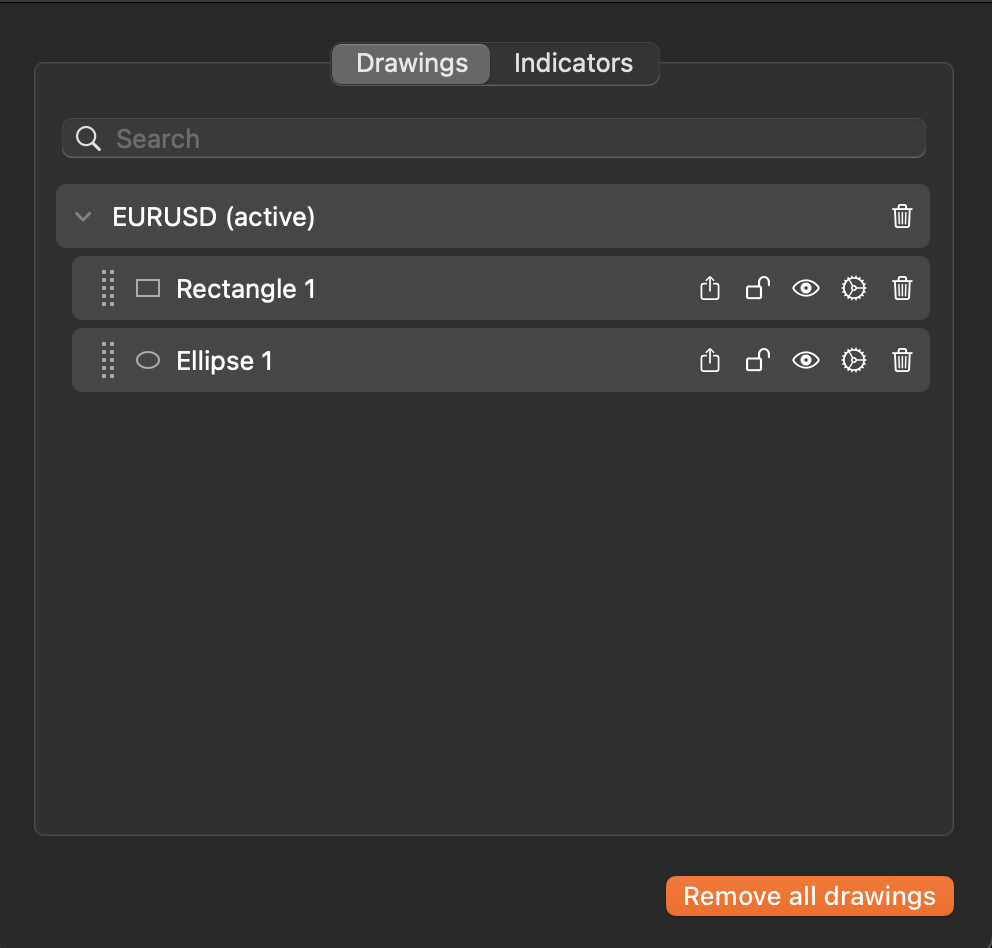
Dragging the control to the left of each object name allows you to reorder the list, determining how objects overlap on the chart. The icons to the right of each object include:
-
Move to all symbols – display the object on all available charts.
-
Lock – lock the object to its current position on the chart, or unlock the object.
-
Hide object – make the object invisible on the chart, or restore its visibility.
-
Settings – choose new parameters for the object, such as colour, line type and line thickness, and access controls for locking, duplicating, restoring settings and more.
-
Remove – delete the object from the chart.
Clicking the Remove all drawings button deletes all objects from the chart at once.
The Indicators tab lists all indicators on the chart. Clicking the Add icon to the right of Chart or Panel reveals the menu for selecting indicators.
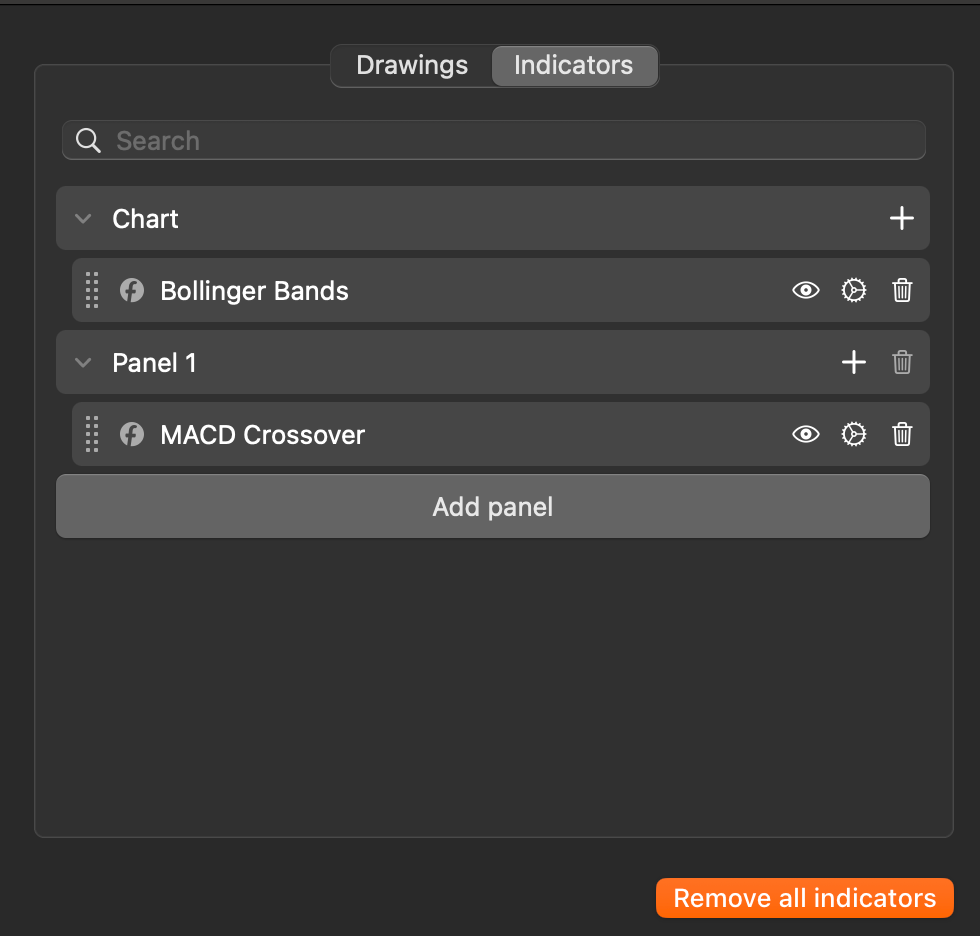
You can drag the control to the left of each indicator to move the indicator in the chart, a separate panel or across both. The icons to the right of each indicator include:
-
Hide object – make the indicator invisible on the chart, or restore its visibility.
-
Settings – open the indicator settings window, where you can specify its parameters, line colours and other properties.
-
Remove – delete the indicator from the chart.
Clicking the Remove all indicators button deletes all indicators from the chart at once.