Charts
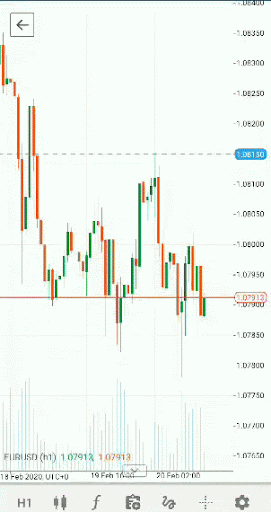
The trading instrument's price fluctuations are displayed in the symbol chart in real time.
To take full advantage of the charts, select a symbol and proceed to the symbol details, scroll to the symbol chart, and open it by tapping the Full-screen button in the upper-left.
Alternatively, double-tap the chart to open it in full-screen mode.
The standard chart contains the price axis (vertical), the time axis (horizontal), the ask price line (green) and the bid price line (orange).
All open positions, pending orders, stop-loss and take-profit protections (if you have set any) are displayed on the chart in real time. You can close or modify them directly from the chart.
Note
Due to mobile performance limitations, you can see up to 20 positions and pending orders on one chart. If you reach this limit, you will see a respective message.
You can modify pending orders and open positions directly from the chart. Tap the desired position and drag the Stop loss and Take profit tiles to the desired level to modify them.
Tap the X icon to close the position or cancel a protection.
Tap a Pending order tile and drag it over the price axis up and down to modify it.
Target – the trading signal from our partner Trading Central is accessible directly in the chart as well.
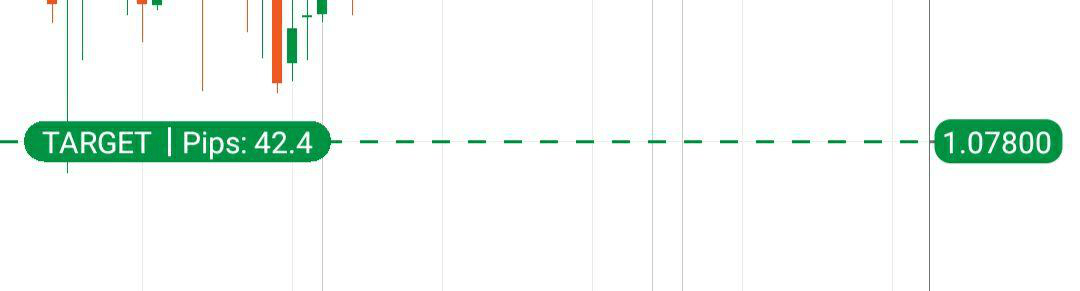
Tap the Target tile to view the details.
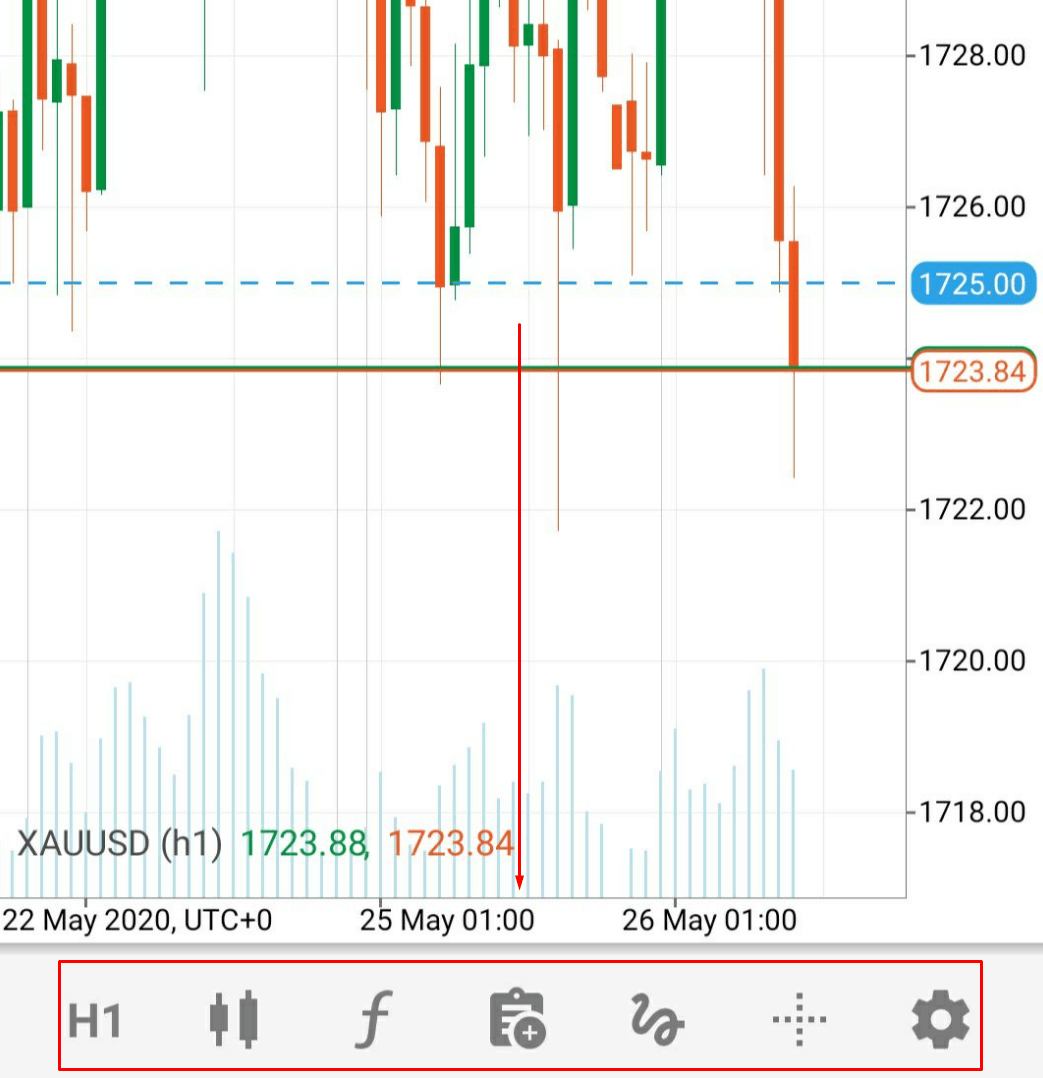
The additional chart options are available at the bottom of the chart.
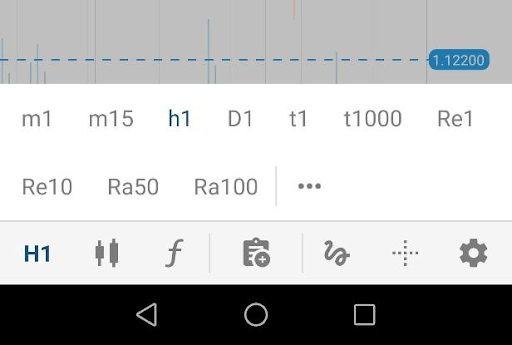
Period
Tap and hold the Chart period button to open the Period selector, which allows you to set a certain period for charts, as well as to set the chart in ticks, Renko or range.
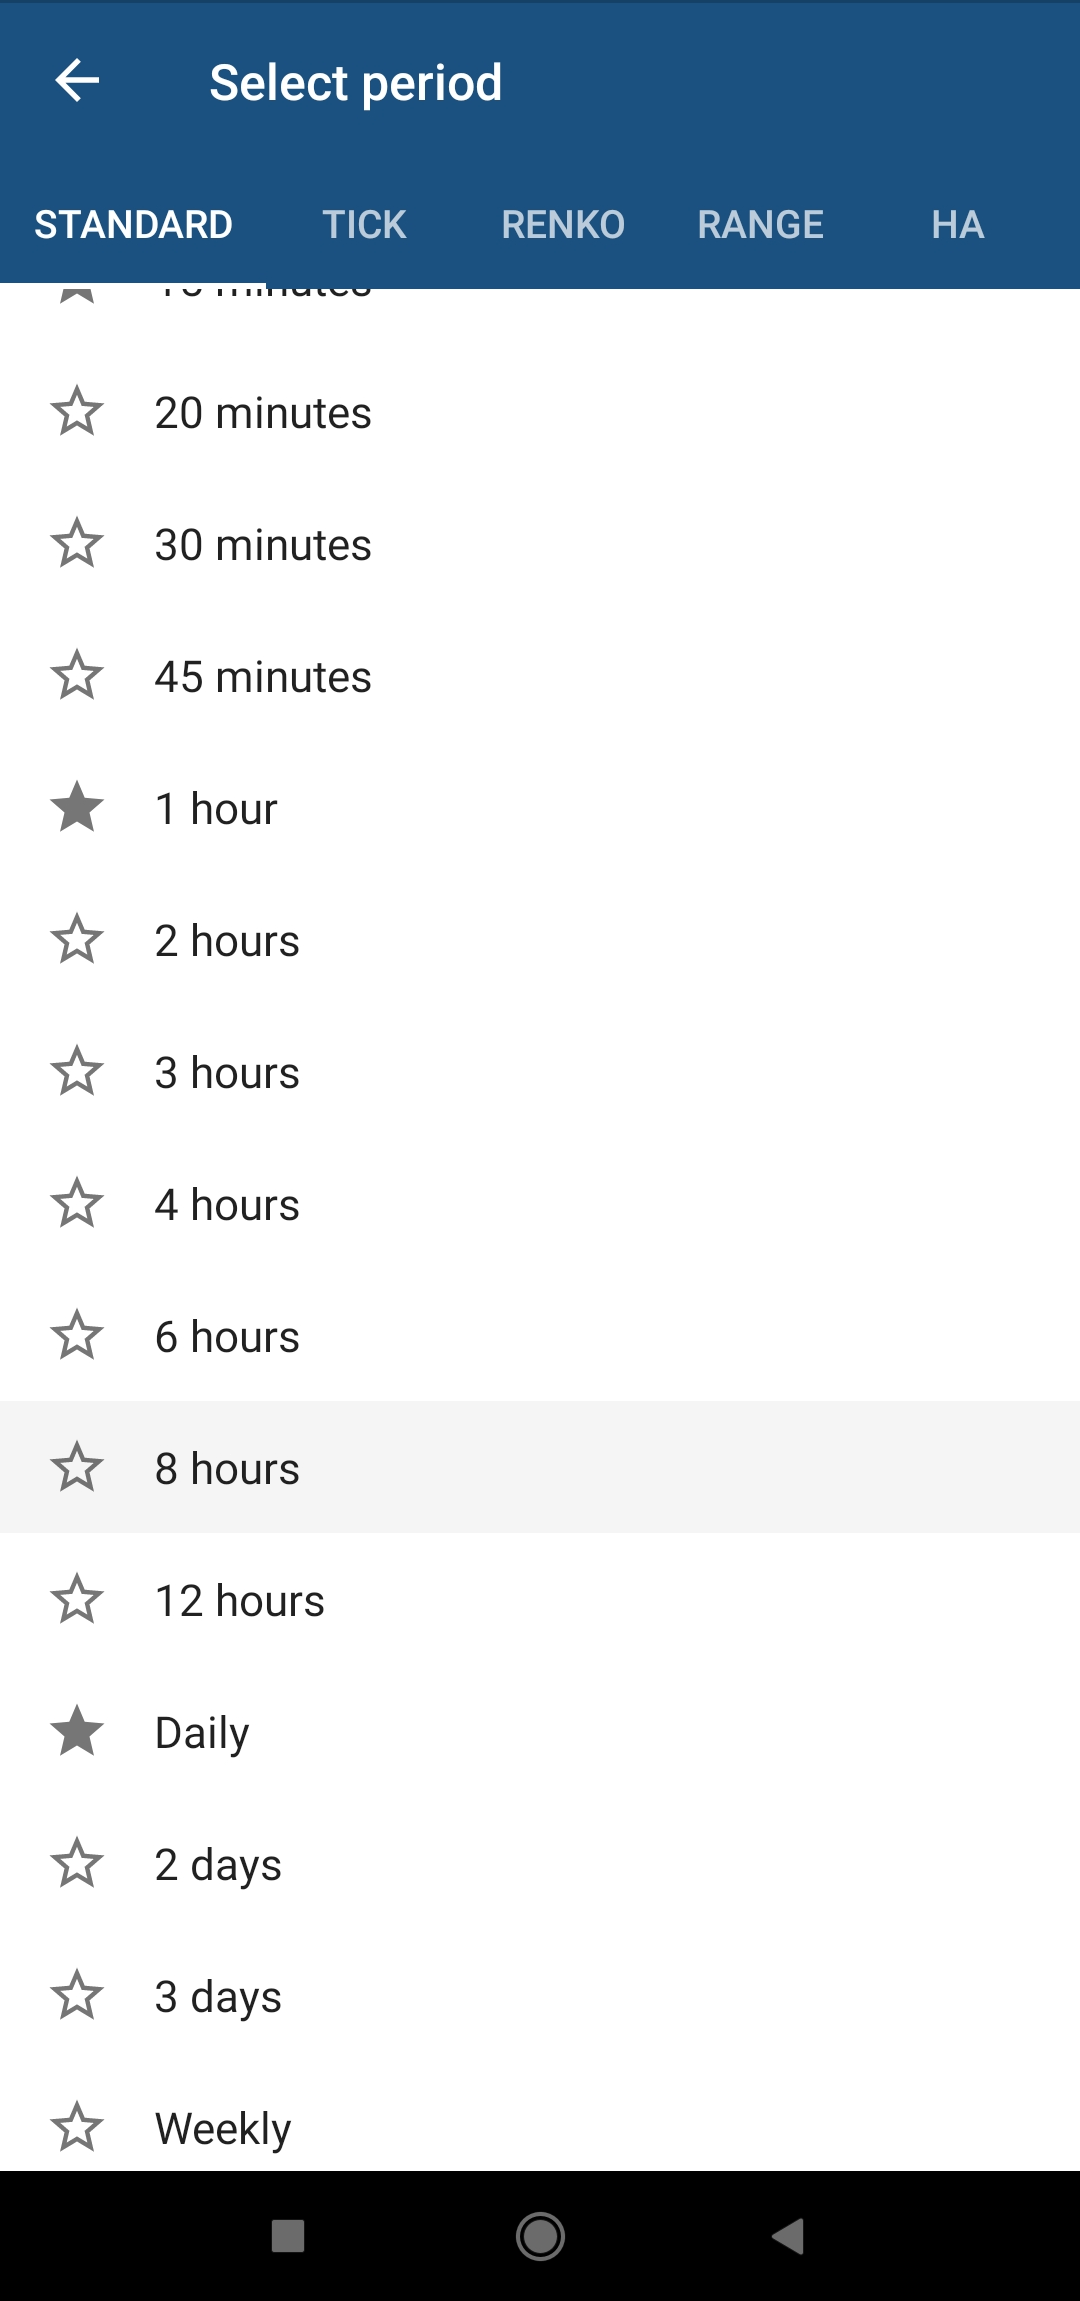
Standard
The standard period allows you to select the desired period from 1 minute to 1 month to apply to the chart.
Tick
Tick-based bars allow you to select the desired number of ticks and construct the bars based on that. You can select the number of ticks from 1 to 1000.
Range
In the Range bar, all price bars are of equal length. So, for example, if you set a 10-pip range bar, then all bars are of a 10 pips range (high to low, or low to high). The close of a bar is always equal to the open of the next bar. The range is measured between the high and low price. Learn more about Range charts.
Renko
In the Renko bars, every bar is of the same length (including reversals, but the price must travel two times the Renko bar in the opposite direction). Learn more about Renko charts.
Heikin Ashi
Heikin-Ashi means "average bar" in Japanese and it is an offshoot of the candlestick technique. Heikin-Ashi candlestick use the open-close data from the prior period and the open-high-low-close data from the current period to create a candlestick. Learn more about Heikin-Ashi charts.
Tap the Star icon to add a period to your favourites (you can choose no more than 20 periods. If you reach this limit, you will see a respective message), tap the period row to immediately apply it to the chart.
Tap the Chart period button to quickly switch between your favourites.
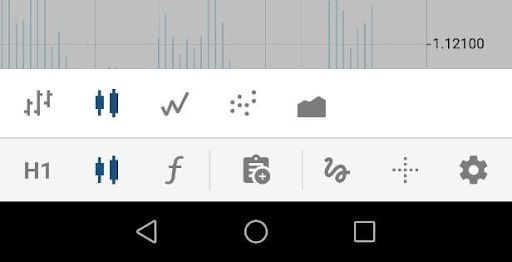
Rendering style
The charts rendering type options allow setting the chart style. Currently, cTrader mobile app supports the following styles:
- Bar chart – provides the opening, closing, high and low prices for the selected period in the form of bars.
- Candlestick chart – composed of a series of open-high-low-close (OHLC) candles set apart by a time series.
- Line chart – a graphical representation of an asset's historical price action that connects a series of data points with a continuous line. Line charts can be used on any period but are most often used for day-to-day price changes.
- Dot chart – displays only the closing prices for the selected period as dots.
- Area chart – based on the line chart. The area between the axis and line is commonly emphasised with colours, textures and hatchings.
Tap to open the Chart style submenu, then tap the desired rendering type to apply the changes.
Indicators
The cTrader indicators section allows you to add or edit indicators on the chart.
Tap and hold the Indicators button (or quick tap the Indicators button and then tap the More icon) to add new indicators and adjust added indicators.
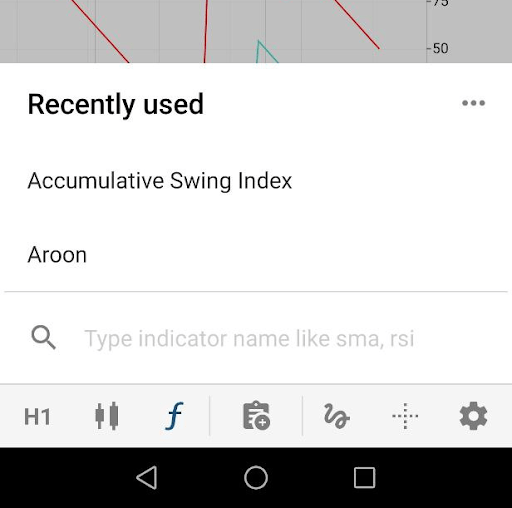
Tap the Plus icon in the upper-right to add indicators.
All existing indicators are grouped by functionality in the respective lists: Trend, Oscillators, Volatility, Volume and Other indicators.
Tap the desired group to expand the list of indicators. All indicators that were recently used are listed in the Recently used list at the top.
Alternatively, you can use the search box at the top to find the desired indicator by its name.
Tap an indicator to open its settings (shift, colour, etc.)
When done, tap Back. The indicators will appear on the chart immediately.
To remove an indicator, tap the Bin icon next to it directly in the list.
Quick tap the Indicators button to add indicators from the recently used list or find them by name.
New order
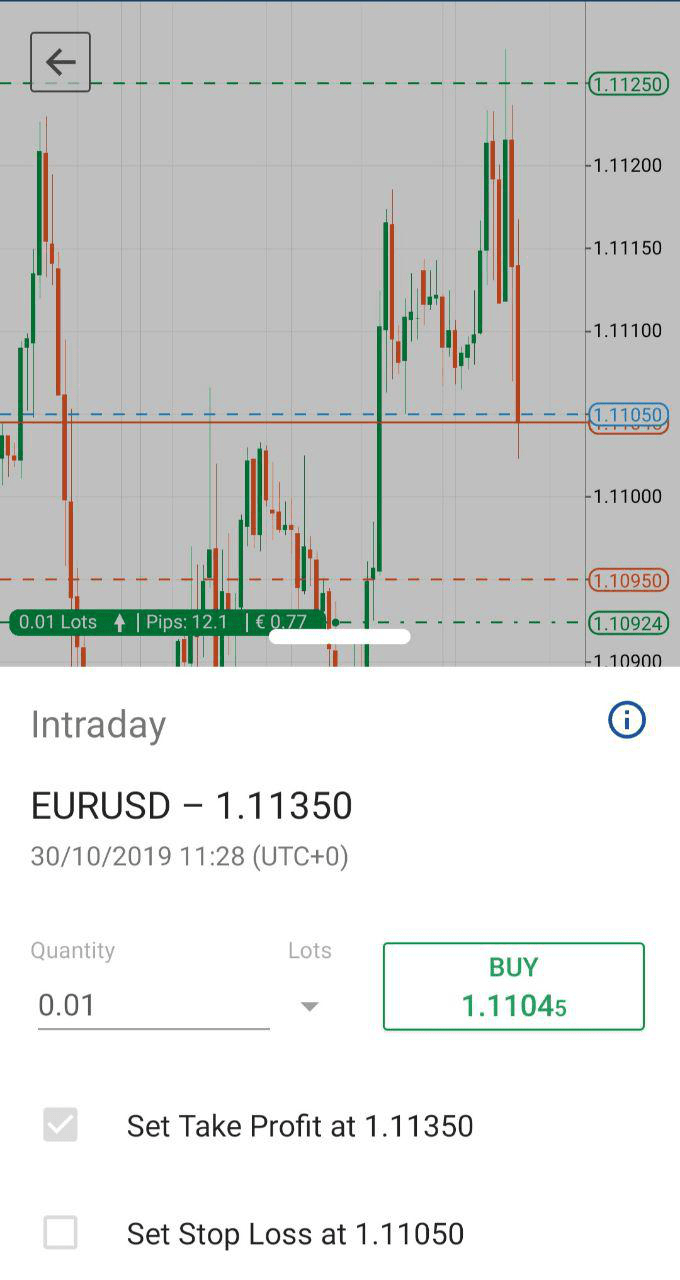
Use the New order button directly from the chart to fill the market orders or create any other types of orders.
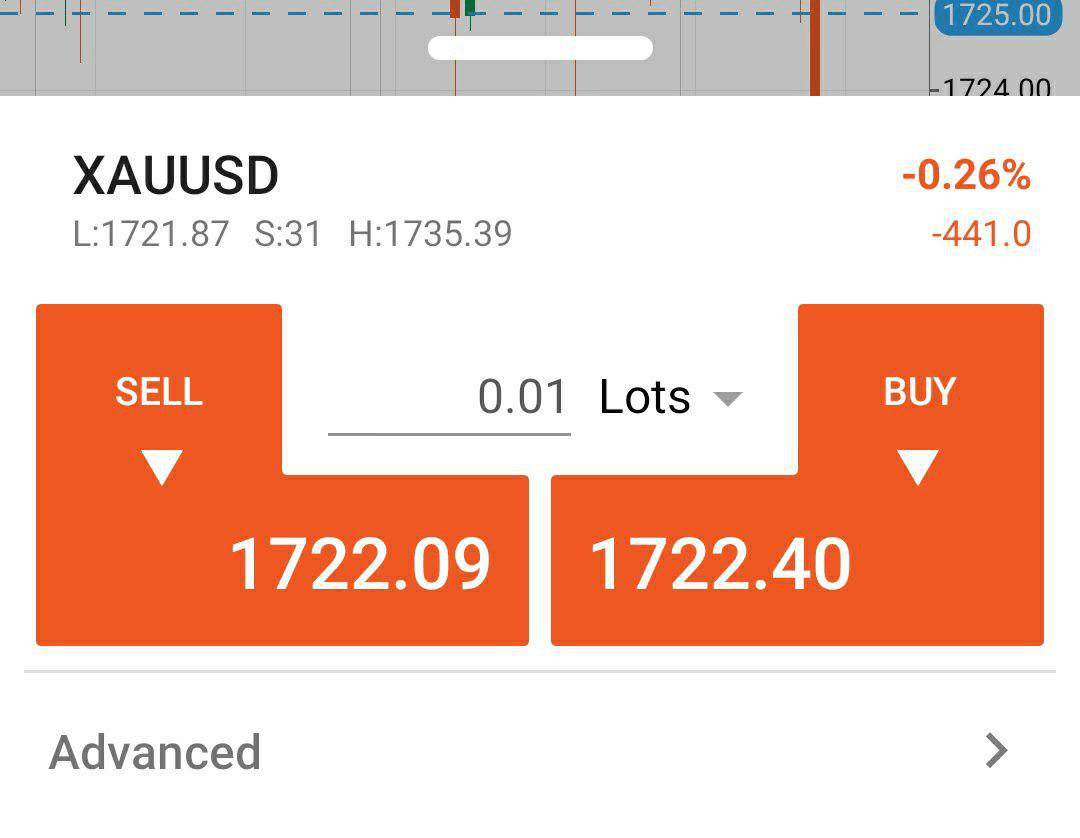
Tap the New order icon to open the New order menu. Tap the Lots selector to set the desired amount of lots to trade, and tap the Sell or Buy button to place a sell or buy market order respectively.
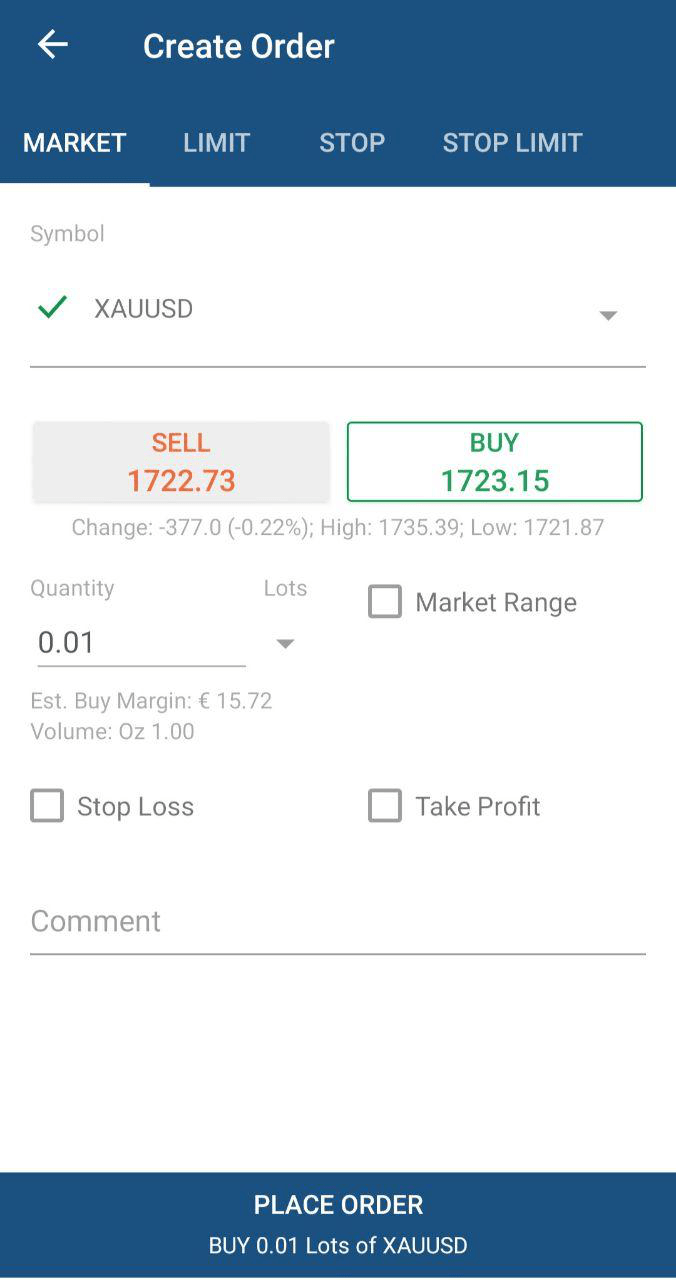
Tap Advanced to open the Create order menu to create the desired type of order.
Line studies and chart objects
cTrader Mobile offers a comprehensive set of line studies and chart objects for advanced technical analysis. Tap the Drawings icon to proceed to the Line studies menu.
Tap the Plus to proceed to the objects selector.
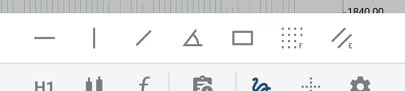
The following lines and chart objects are available here:
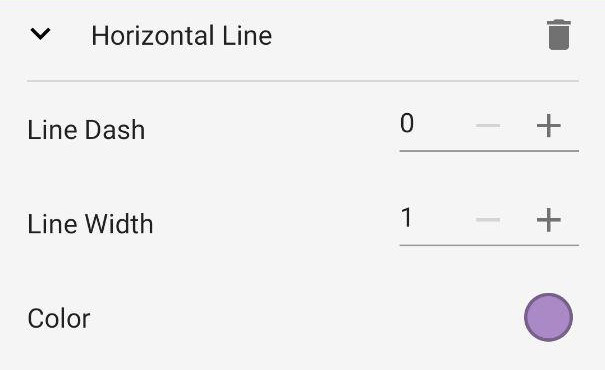
- Horizontal line – a line parallel to the time axis; it can be placed anywhere on the chart. Often used to mark the support and resistance levels on the chart.
- Vertical line – a line parallel to the price axis; it can be set anywhere on the chart. Often used to mark certain areas on the chart, for example, the correlation between the price and indicators below.
- Trend line – bounding line for the price movement of a symbol that allows marking price trends.
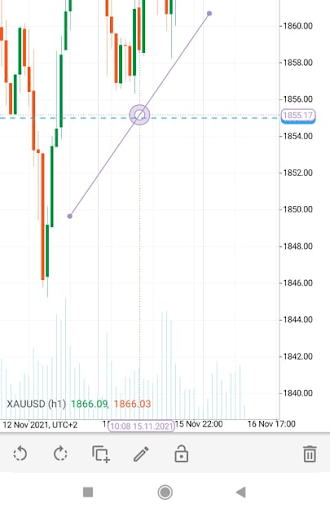
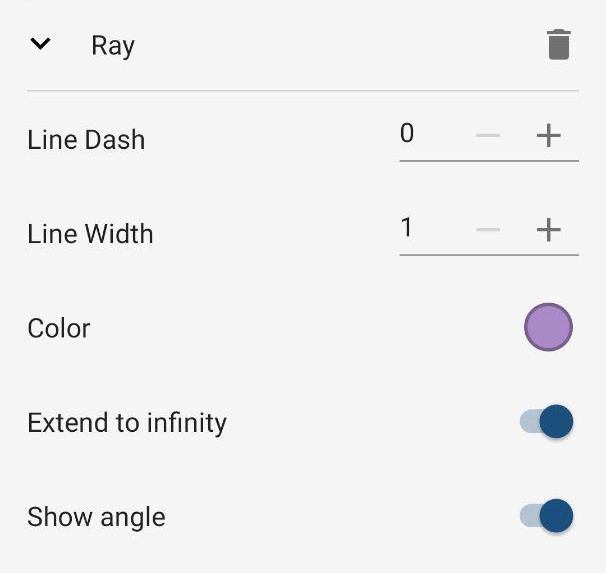
- Ray – very similar to trend lines, but they make it easier not only marking a trend but predicting its further movement.
- Rectangle – allows placing the rectangle shape on the chart.
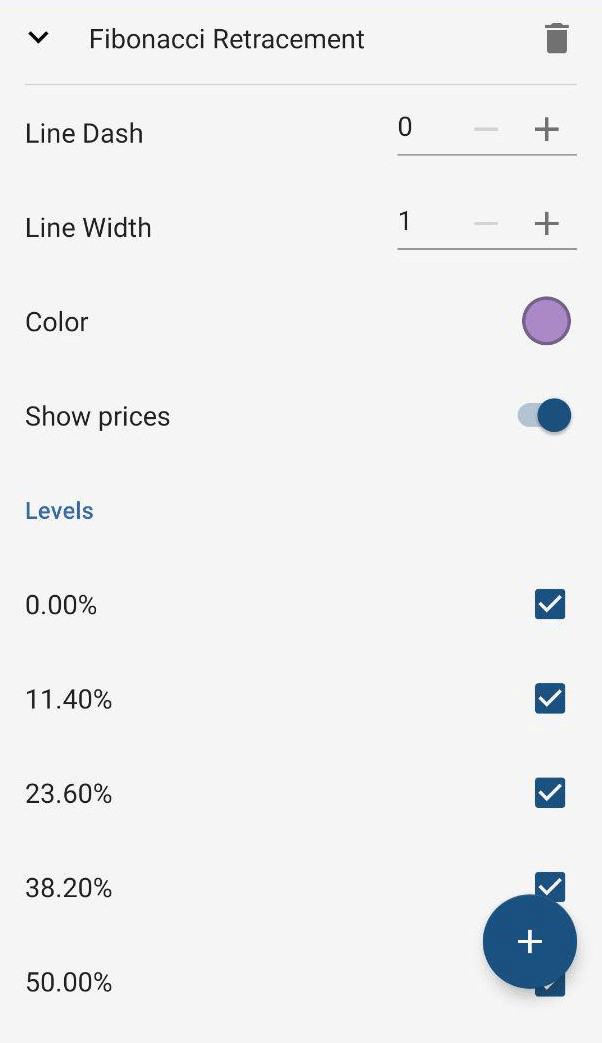
- Fibonacci retracement – a charting technique that uses horizontal lines to indicate areas of support or resistance at the key Fibonacci levels before the trend continues in the original direction. Fibonacci retracement price levels can be used as buy triggers on pullbacks during an uptrend.
- Equidistant price channel – allows drawing two precisely parallel lines on the chart.
Context panel
After adding an object on the chart, the object becomes selectable. When selecting the object, the context panel will appear.
The context panel provides the following options:
- Rotate anti-clockwise – rotates the object in an anti-clockwise direction.
- Rotate clockwise – rotates the object in a clockwise direction.
- Copy – create a copy of the selected object.
- Edit – opens the editing panel that allows you to edit the chart objects.
- Lock – locks the selected object to its current position.
- Delete – deletes the object.
Manage objects
By tapping the Edit button inside the context menu, you will get the objects list where you can edit your chart's objects.
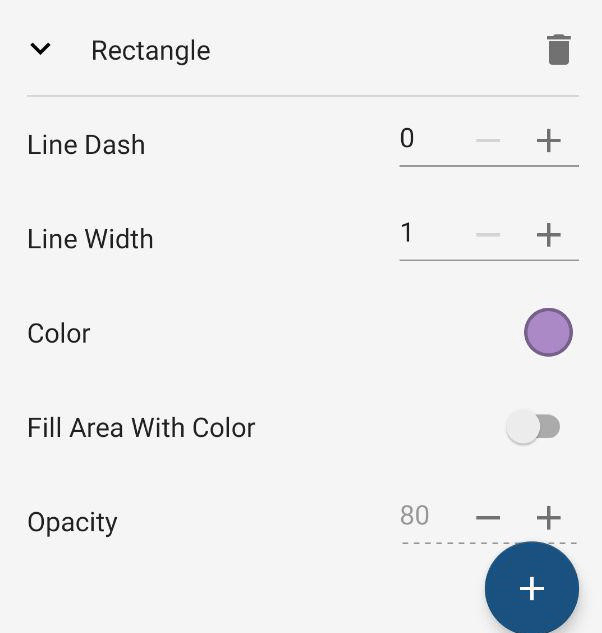
To edit a line or a ray, expand its details from the Drawings list. You can set Line dash, Line width and Colour.
For trend lines, rays and equidistant channel, you can also set the extending to infinity and displaying the angle.
For the Fibonacci retracement, you can also hide or show prices, and set the levels in percent.
For the rectangle shape, you can also set the fill and opacity of the shape.
Any changes made will be applied immediately. Exit the Drawings section to view the changes on the chart.
Crosshair
The crosshair cursor makes it easier to see the exact price at the exact time on the chart. Tap to enable the crosshair cursor on the chart.
Move the cursor to any point on the chart to see the price and time differences between points.
Tap the Triangle at the bottom of the screen to place the second crosshair to check the difference between two points on the chart.
Charts settings
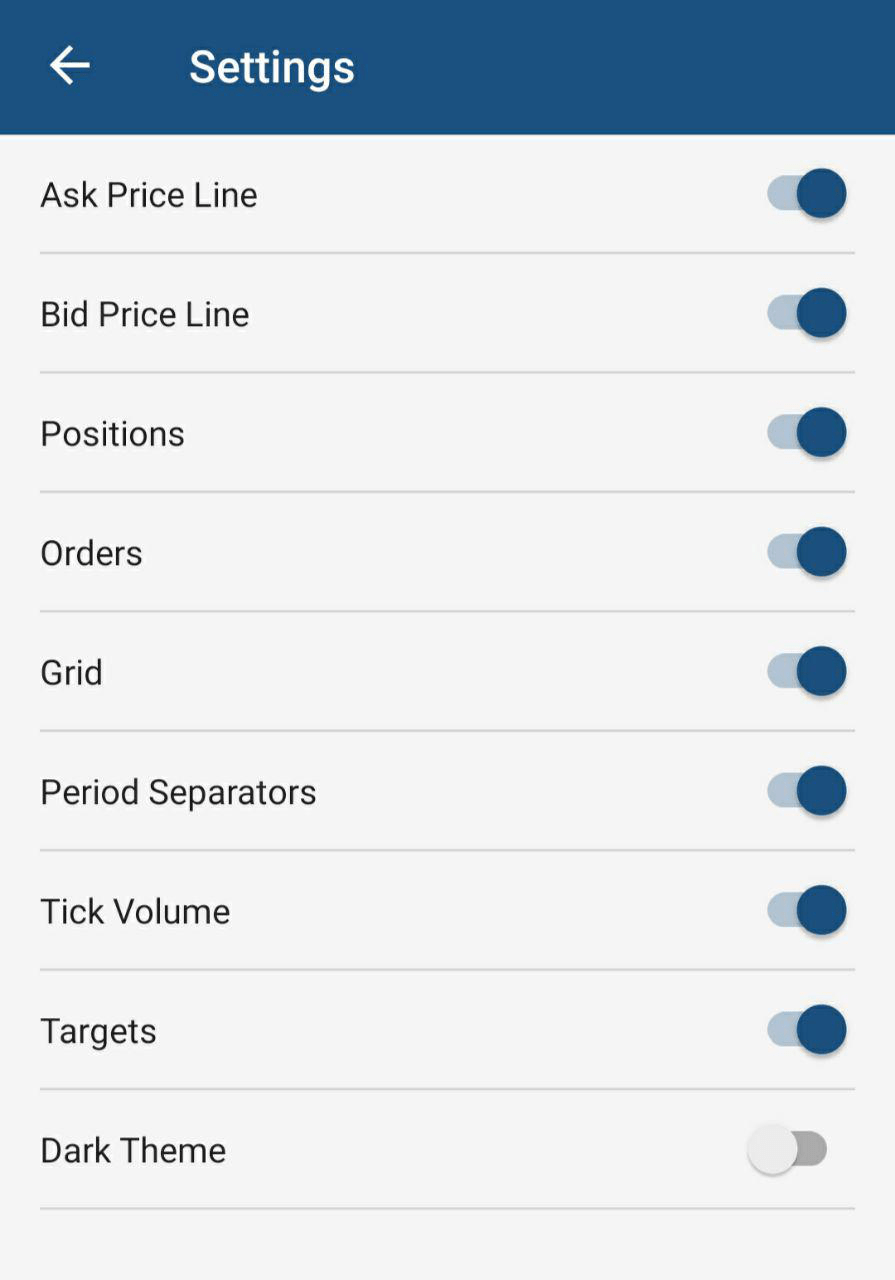
Quick tap the Cog icon to proceed to the chart viewing settings menu. The following settings are available in cTrader Mobile:
- Hide or show the Ask price line – the green line on the chart displaying the ask price level in real time.
- Hide or show the Bid price line – the orange line on the chart displaying the bid price level in real time.
- Hide or show the Positions – the position badge and line on the chart (if any positions are opened for the symbol).
- Hide or show the Orders – the pending order badge on the chart (if any pending orders are placed for the symbol).
- Hide or show Grid – the grid on the chart background.
- Hide or show the Period separators – the vertical line separating the periods on the chart.
- Hide or show the Tick volume – the tick volume bars at the bottom of the chart.
- Hide or show Targets – the indicator displaying Trading Central data on the chart.
- Switch between the dark and light themes.
- Run Chart panel tips – runs a tooltip to show or remind you how to use the chart panel (you can also run it in full-screen by tapping the Help icon).
You can also open the Settings screen by tapping and holding the Cog icon.
Tap the Back arrow in the upper-left to exit full-screen chart mode.