Symbol overview
cTrader Mobile supports all the basic currency pairs, commodity symbols, stocks, indices, metals and other tradable assets.
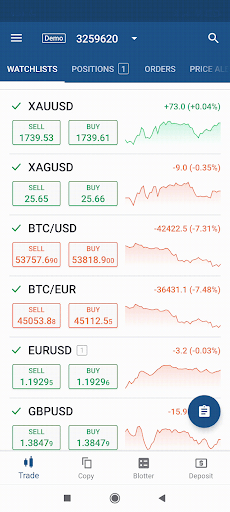
The most convenient way of selecting the symbols to trade is using Watchlists.
To find the desired symbol to trade, swipe up and down the Watchlists or use the advanced search in the upper-right of the Watchlists menu.
Swipe right and left to see all the open positions, pending orders, price alerts and trading history of the symbol.
Alternatively, find the desired symbols using the Find symbols option in the main menu.

When tapping a symbol, the symbol overview is displayed. It includes the following components:
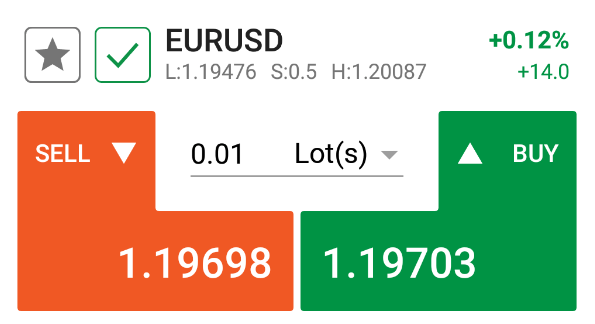
Symbol status bar
The Symbol status bar displays the security trading dynamics in real time.
If the market for the symbol is open, then the Sell and Buy buttons are active and highlighted, and a green checkmark is displayed in the upper-left.
Use the Lots picker to specify the number of lots to trade, and Sell or Buy buttons to create orders of the corresponding direction directly from the Symbol status bar.
Tap the Star icon to add or remove the symbol from the watchlist.
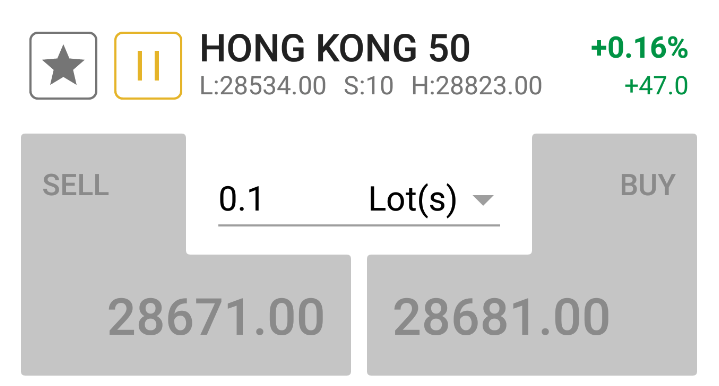
If the market for a symbol is closed, the Sell and Buy buttons are disabled, no live dynamics are displayed and the yellow Pause sign is displayed in the upper-left.
You can still add these symbols to your watchlist by tapping the Star icon.
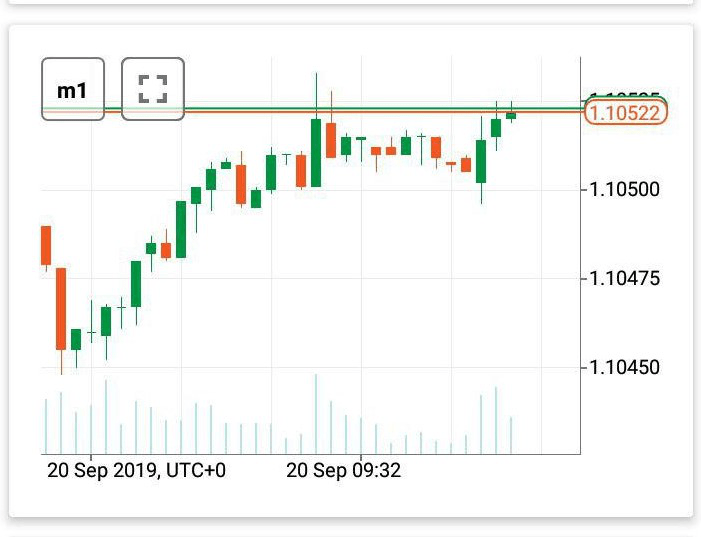
Charts
The symbol price fluctuations are displayed in the symbol chart in real time. The standard chart contains the price axis, the time axis, the ask price line (green) and bid price line (red).
Use the Period selector in the upper-left to view the charts for a certain period.
Use the Full-screen button in the upper-left or double-tap the chart to enlarge it.
Positions, orders, stop-loss levels and take-profit orders (if set) are displayed on the chart, and you can close them directly from the chart.

See the Charts section for detailed information about cTrader Mobile charts functionality.
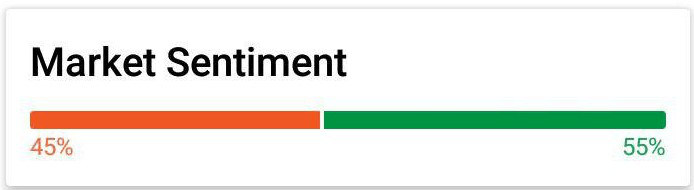
Market sentiment
Market sentiment for the symbol is displayed in a separate bar. The sentiment displays the percent of cTrader accounts with an open position in the symbol that expects the price to fall or to rise.
It refers to the overall attitude of investors toward the symbol. It is the feeling or tone of a market, or its crowd psychology, as revealed through the activity and price movement of the symbol. The information is cross-broker and it is collected from all available cTrader servers.
Depth of market (DoM)
The depth of market is a measure of the total amount of the open buy and sell orders for a symbol at different prices.
The higher the number of buy and sell orders at each price, the greater the depth of market is. The cTrader DoM feature allows tracking the depth of market of a required symbol in real time.
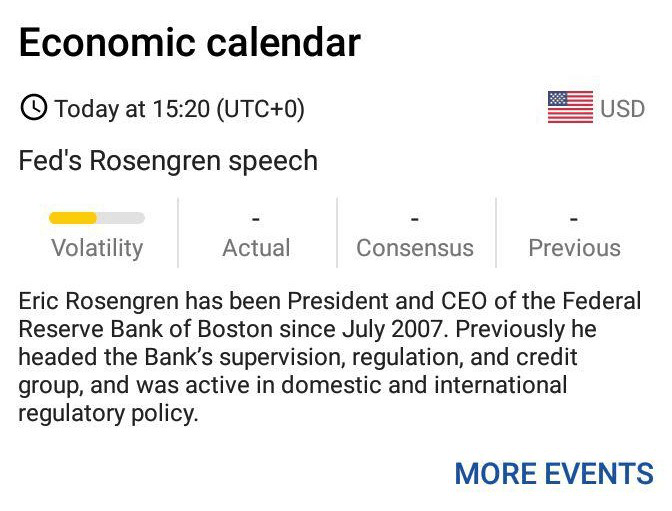
Economic calendar
The Economic calendar automatically displays the most significant events of the main markets. Data in the calendar is displayed in chronological order, divided by day.
Tap More events to proceed to the full calendar.
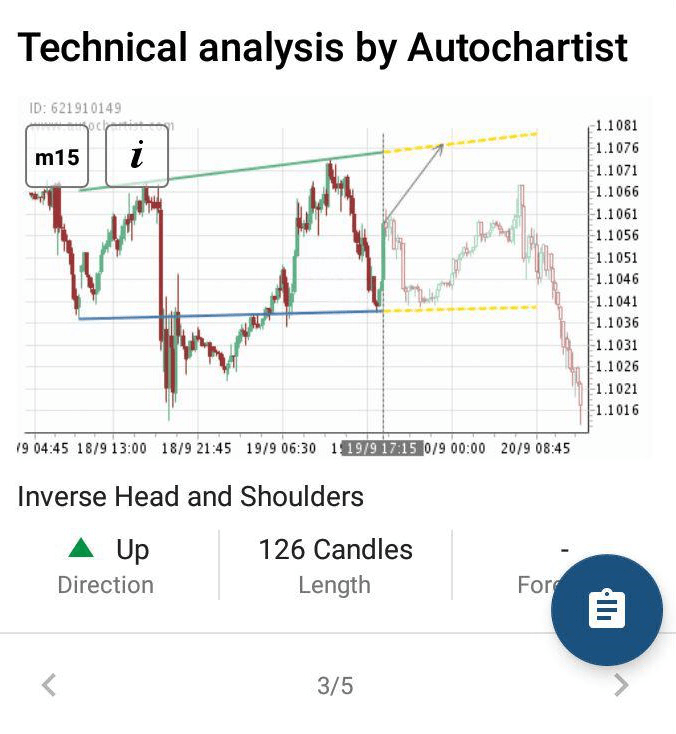
Autochartist
Autochartist is a market-scanning tool designed to highlight the best trading opportunities, helping traders to decide what and when to trade, finding good trade opportunities in real time.
These opportunities are represented on price charts, so a trader can choose trades by simply evaluating the images.
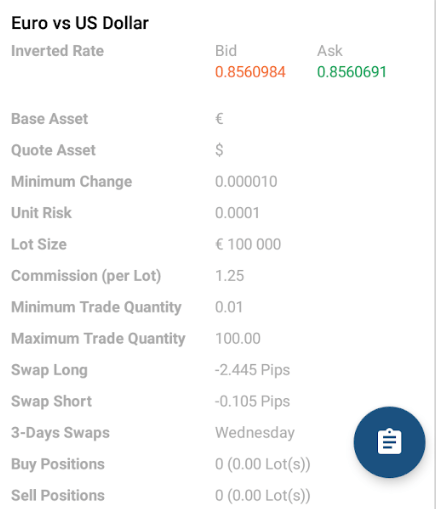
Symbol details
Detailed symbol information with the real-time bid and ask price fluctuations is displayed in a separate bar.
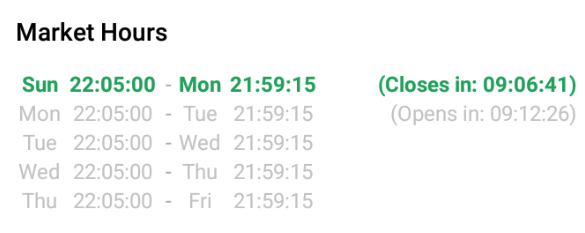
Market hours
The Market hours bar allows checking the open and close market hours for the symbol in real time. The open hours are highlighted with green.
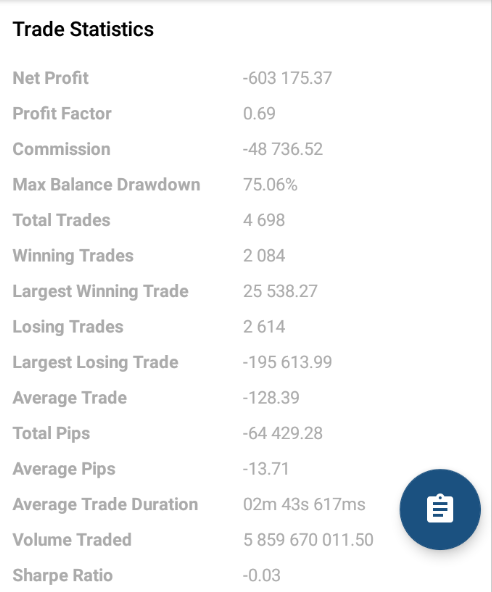
Trade statistics
View your account trading statistics for the symbol displayed in the Trade statistics bar.
The section includes such information as net profit, total trades, losing and winning trades, total and average pips, volume traded, etc.
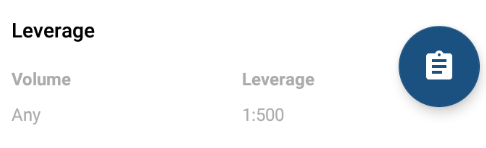
Leverage
The dynamic leverage for the symbol with the specified possible volume is displayed in the Leverage bar.
Note
When using a demo account, the symbol leverage is a constant value and does not depend on the account preset leverage.