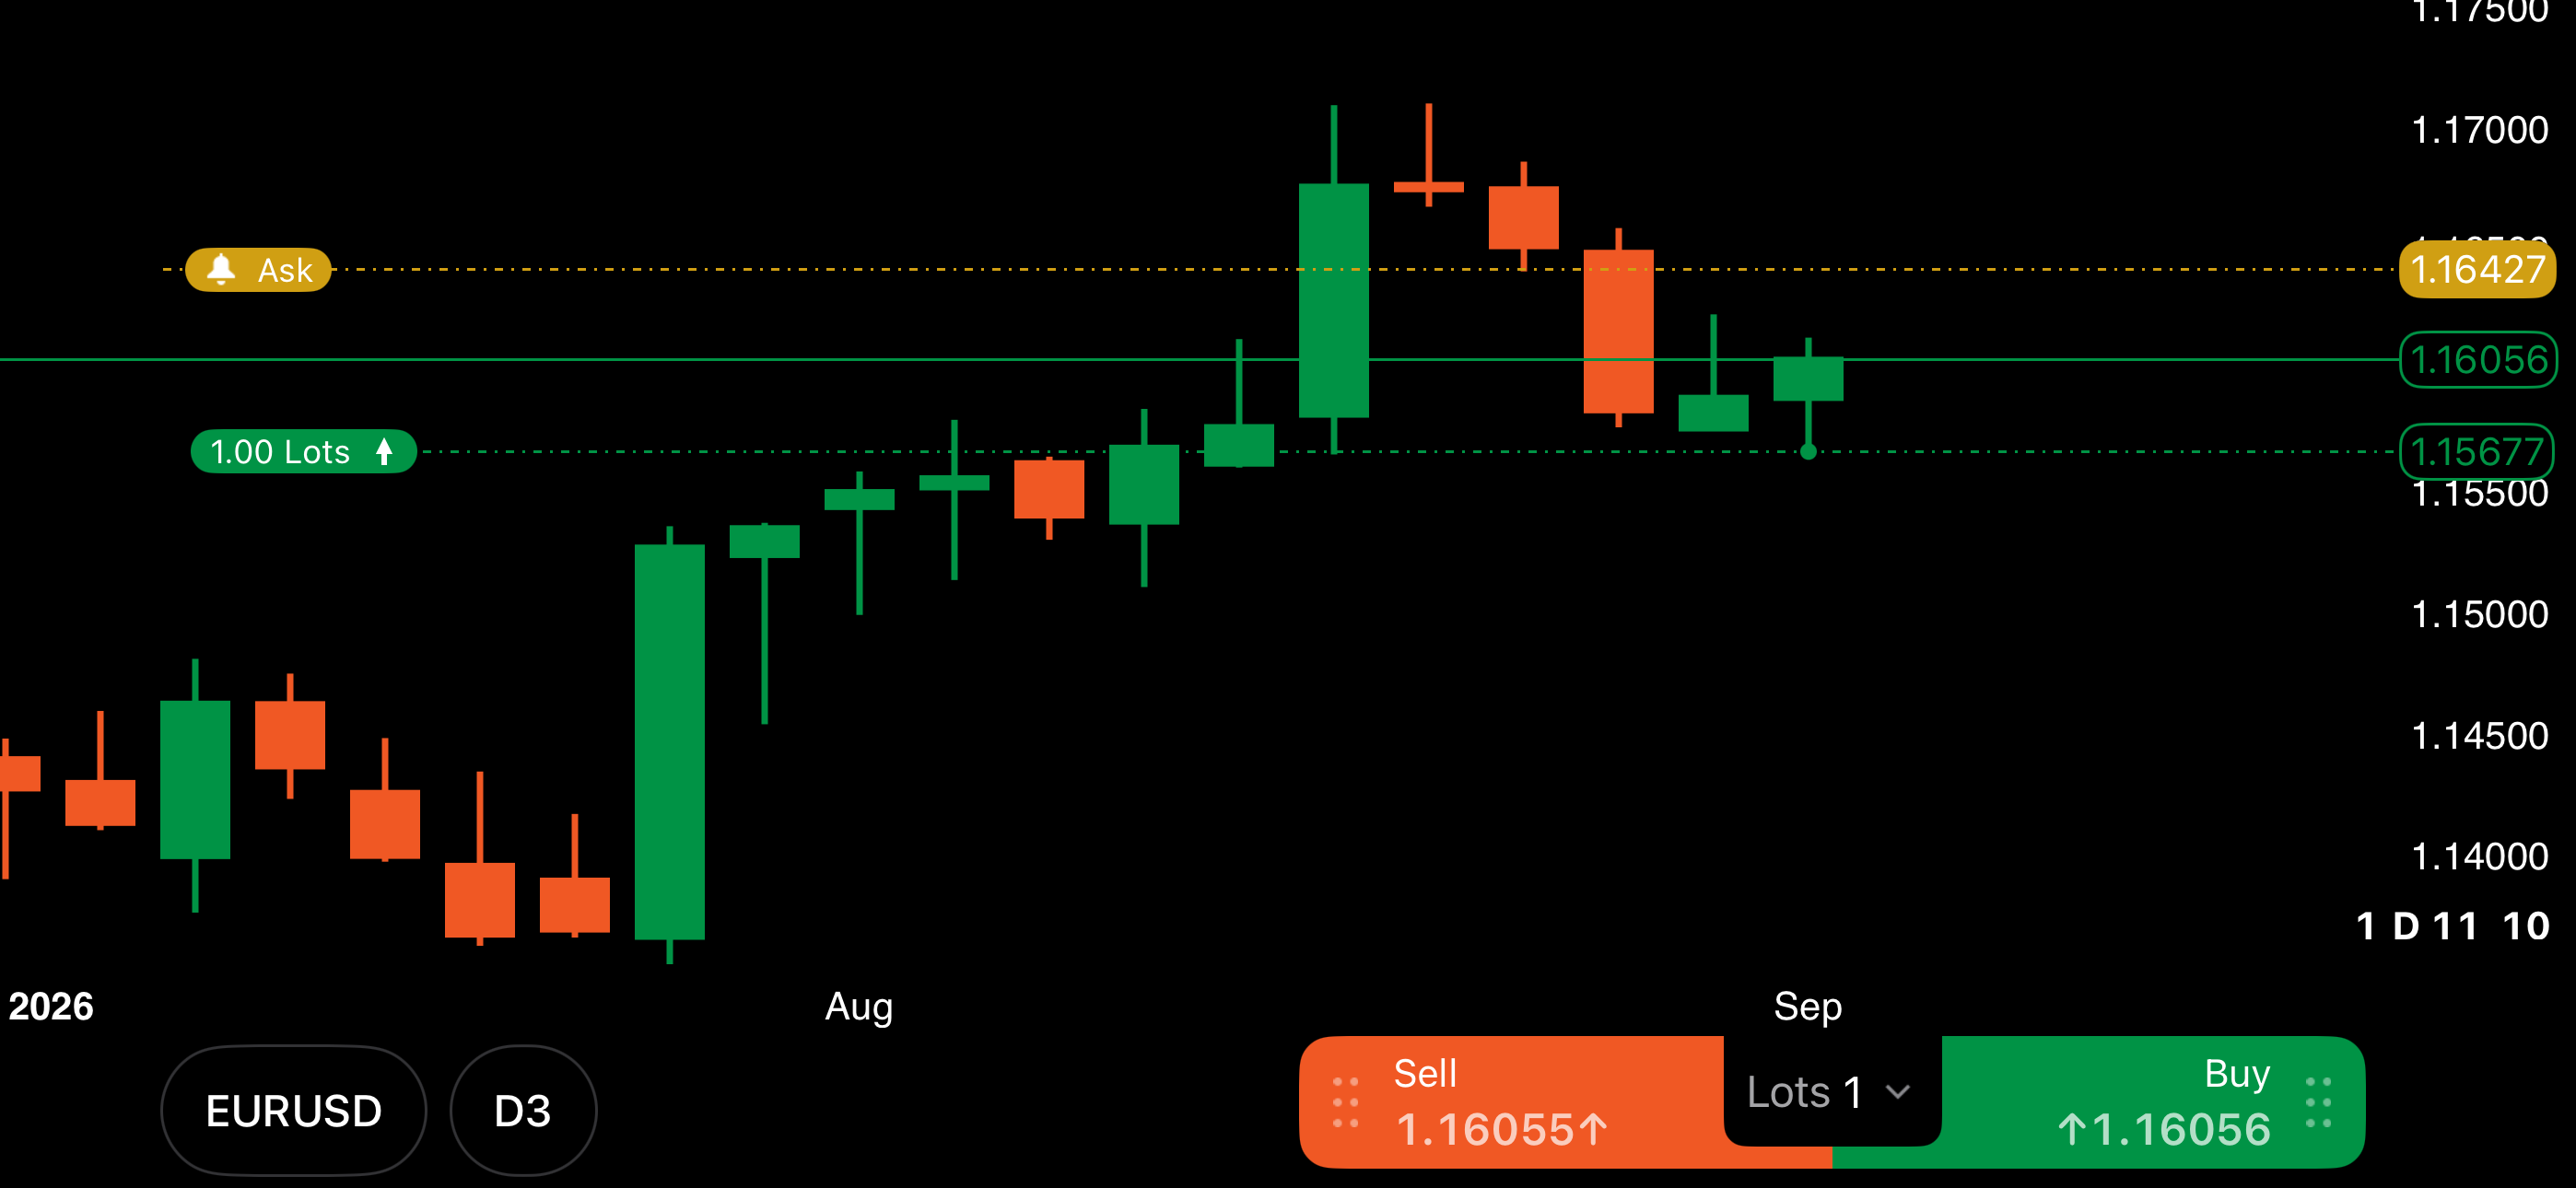
Chart controls
A chart plots a symbol's price over time. It also shows your positions, pending orders, protections, price alerts, as well as chart objects for the symbol as controls, and chart trading lets you act on them without leaving the chart.
Open a chart
There are several ways into a chart, depending on where you already are in the app:
Tap Charts in the bottom bar. The app opens on the last viewed symbol chart.
In a chart preview block of the symbol overview, tap either or the chart. It opens on that symbol, with the full chart toolbar.
Tap a position to open its menu, then the Chart tab. Tap or double-tap the chart to open it on that position's symbol and manage the position with chart trading.
Long-tap a symbol's row in a watchlist. The chart opens on that symbol.
Turn the phone on its side, anywhere in the app. The chart opens on the last symbol you viewed. See Landscape view.
To exit the full-screen mode, tap in the upper-left corner of the chart. The button stays on screen even with the chart toolbar hidden.
Chart toolbar
Tap anywhere on the chart to show the toolbar, and tap again to hide it. The symbol and period selectors and the Quick Trade buttons stay either way, unless you have turned the buttons off under Visibility.
Note
The button is always visible. You cannot hide it under Visibility.
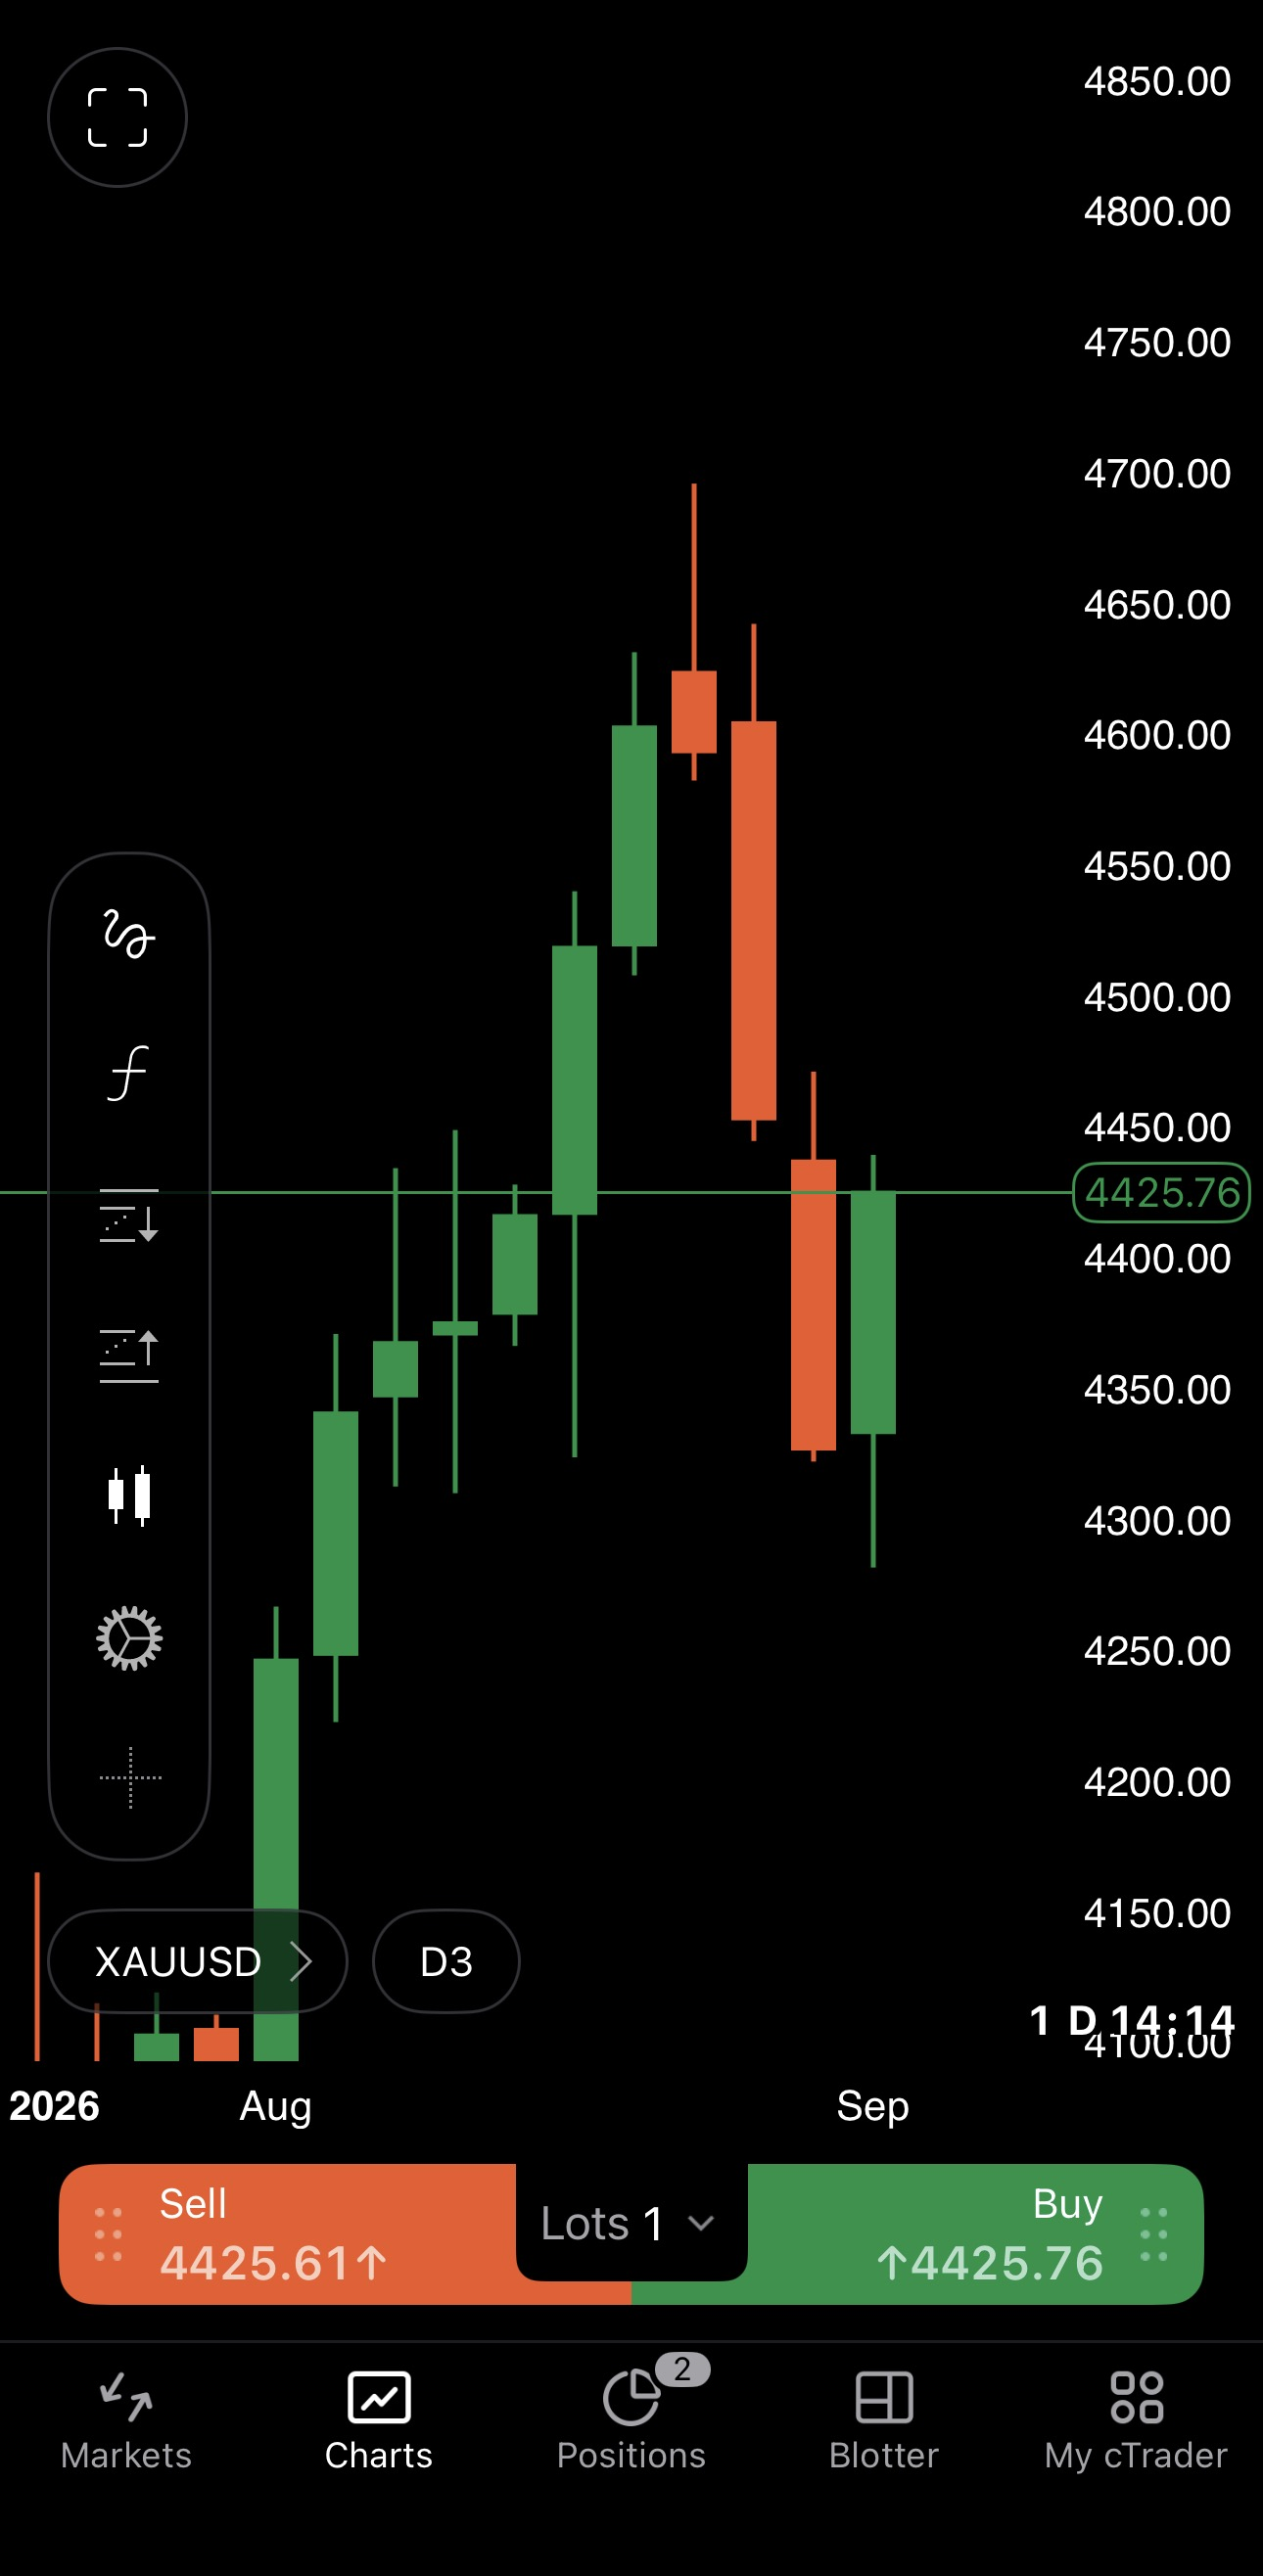
The chart toolbar contains the following elements:
Most tools open in the bottom sheet, leaving the price in view. , and work on the chart itself.
Axes and zooming
Pinch the chart to zoom. Pinching horizontally changes how many bars fit across the screen, vertically how much of the price range fills the height and diagonally both at once. Either axis stretches without disturbing the other.
Zooming in narrows what is on screen and makes small movements readable: the same price change covers more of the chart. Zoom out to trade that detail for more history.
Drag the chart back through history. A button appears beside the price axis. Tap it to return to the latest price.
Drag forward past the latest price and the chart empties. A button appears instead. Tap it to bring the price back into view.

Symbol
The symbol selector sits in the lower-left corner, next to the period selector. Tap it to list the symbols you can switch to, with a tick against the one on screen. Tap another symbol to redraw the chart on it.
If the symbol you want is not listed, use the Find symbol field at the foot to search every symbol your broker offers.
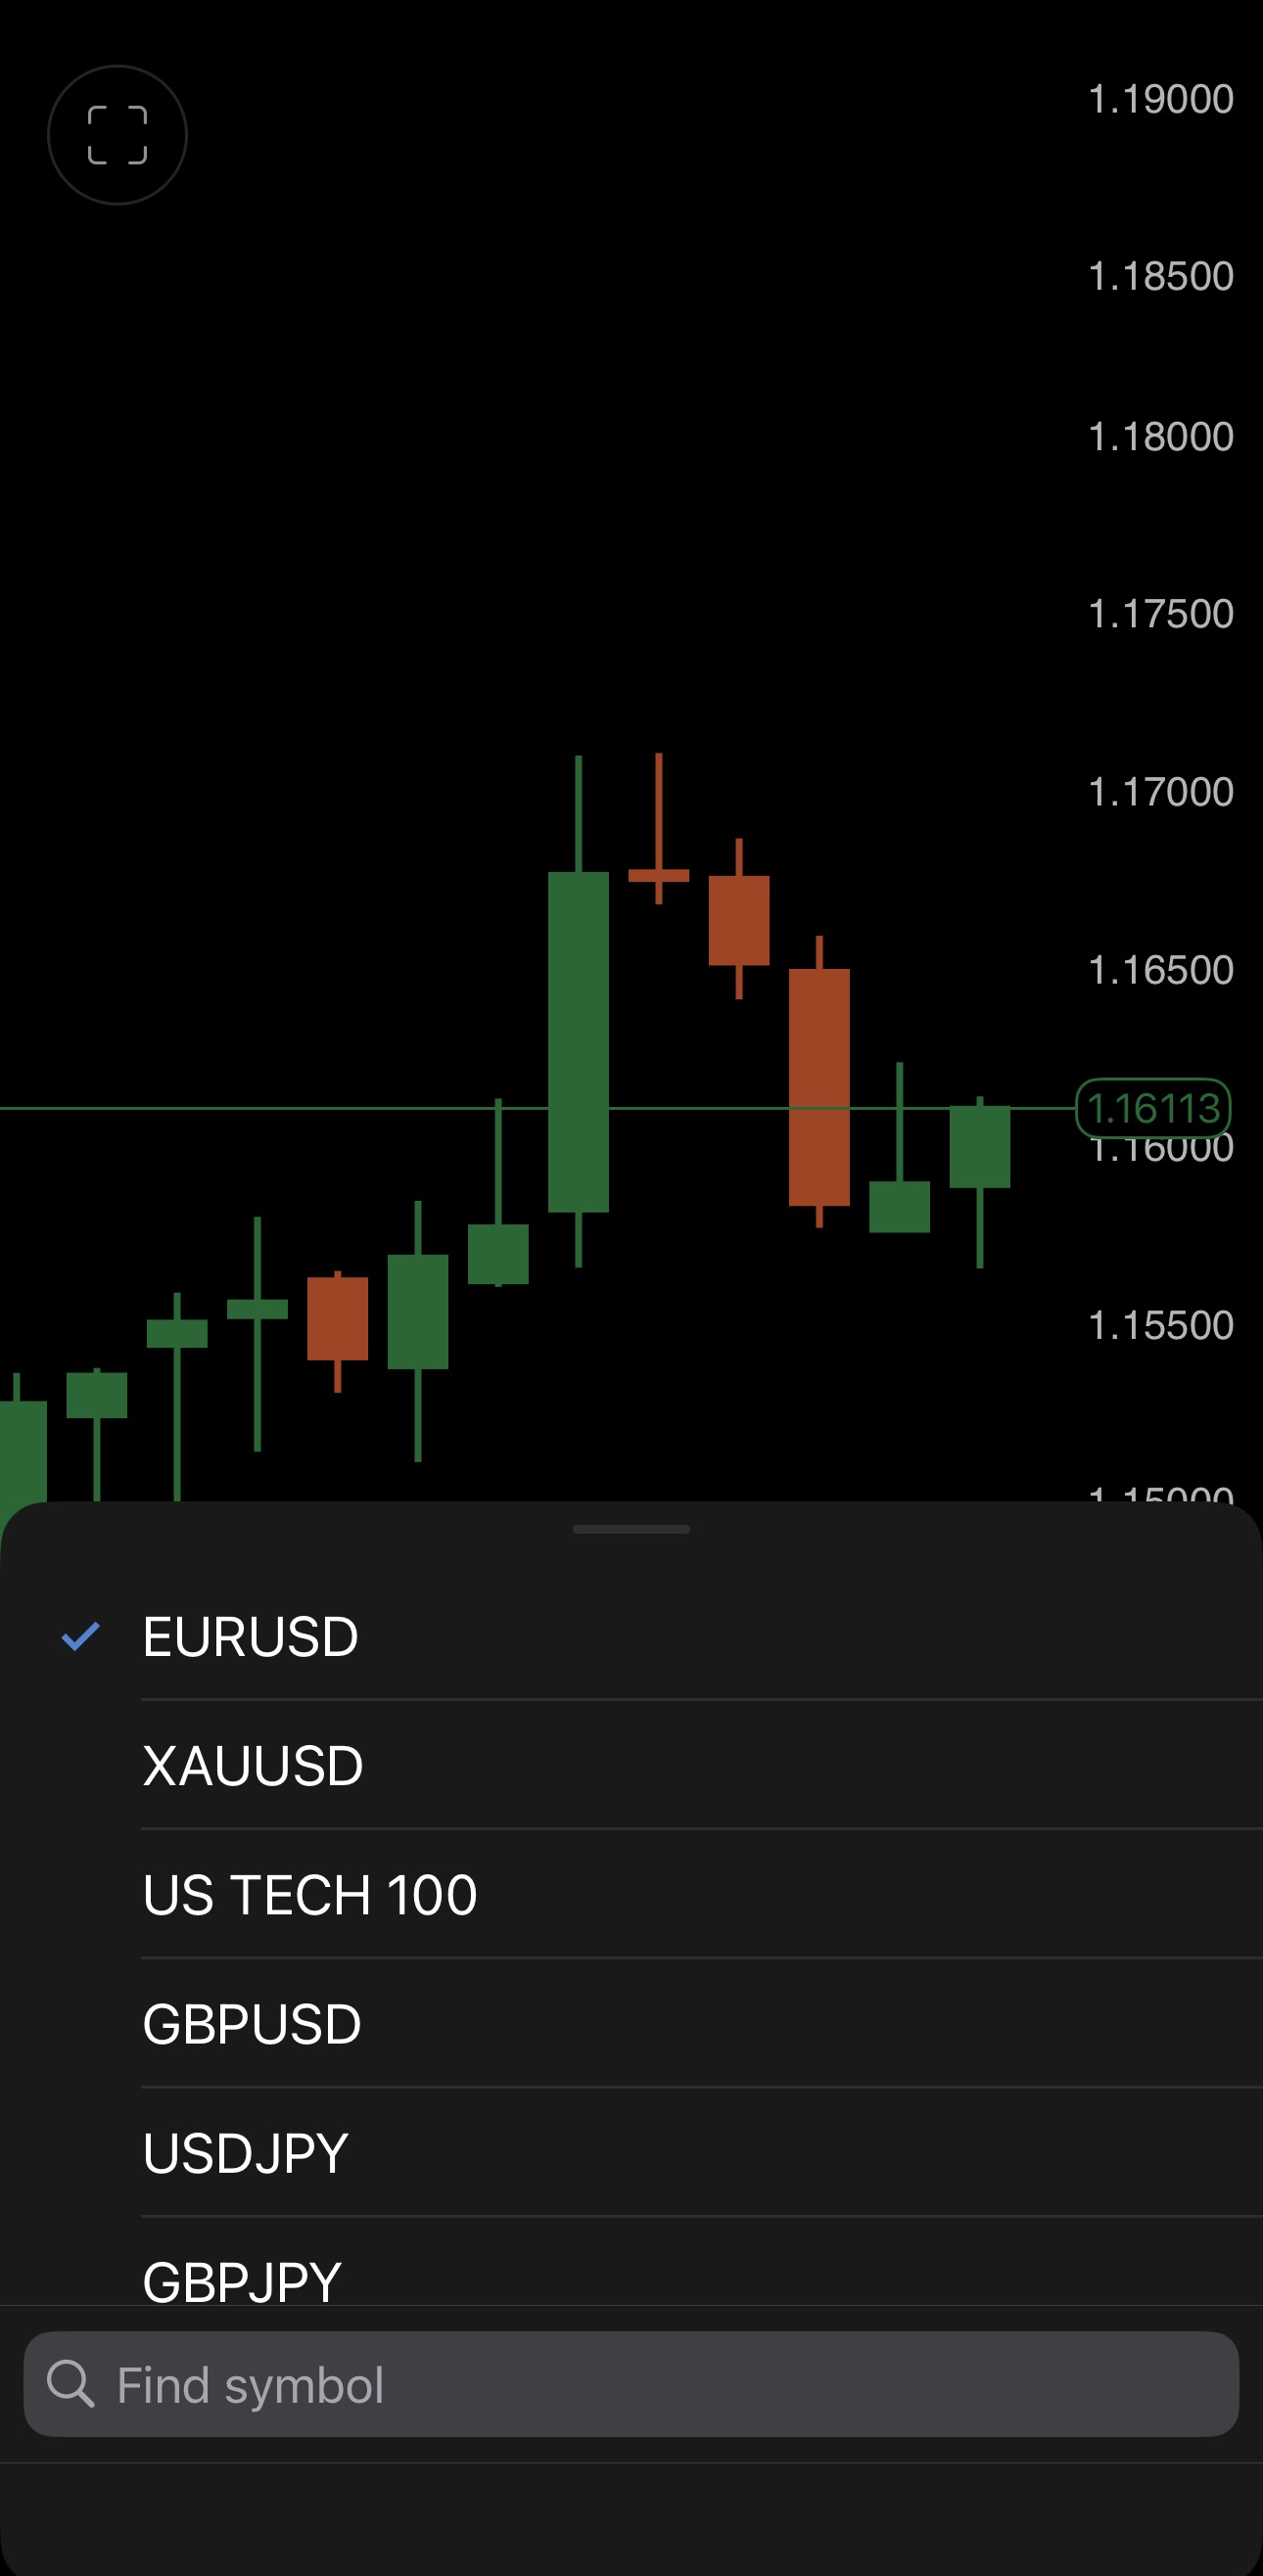
Chart type
Tap in the chart toolbar to open a chart type bottom sheet.
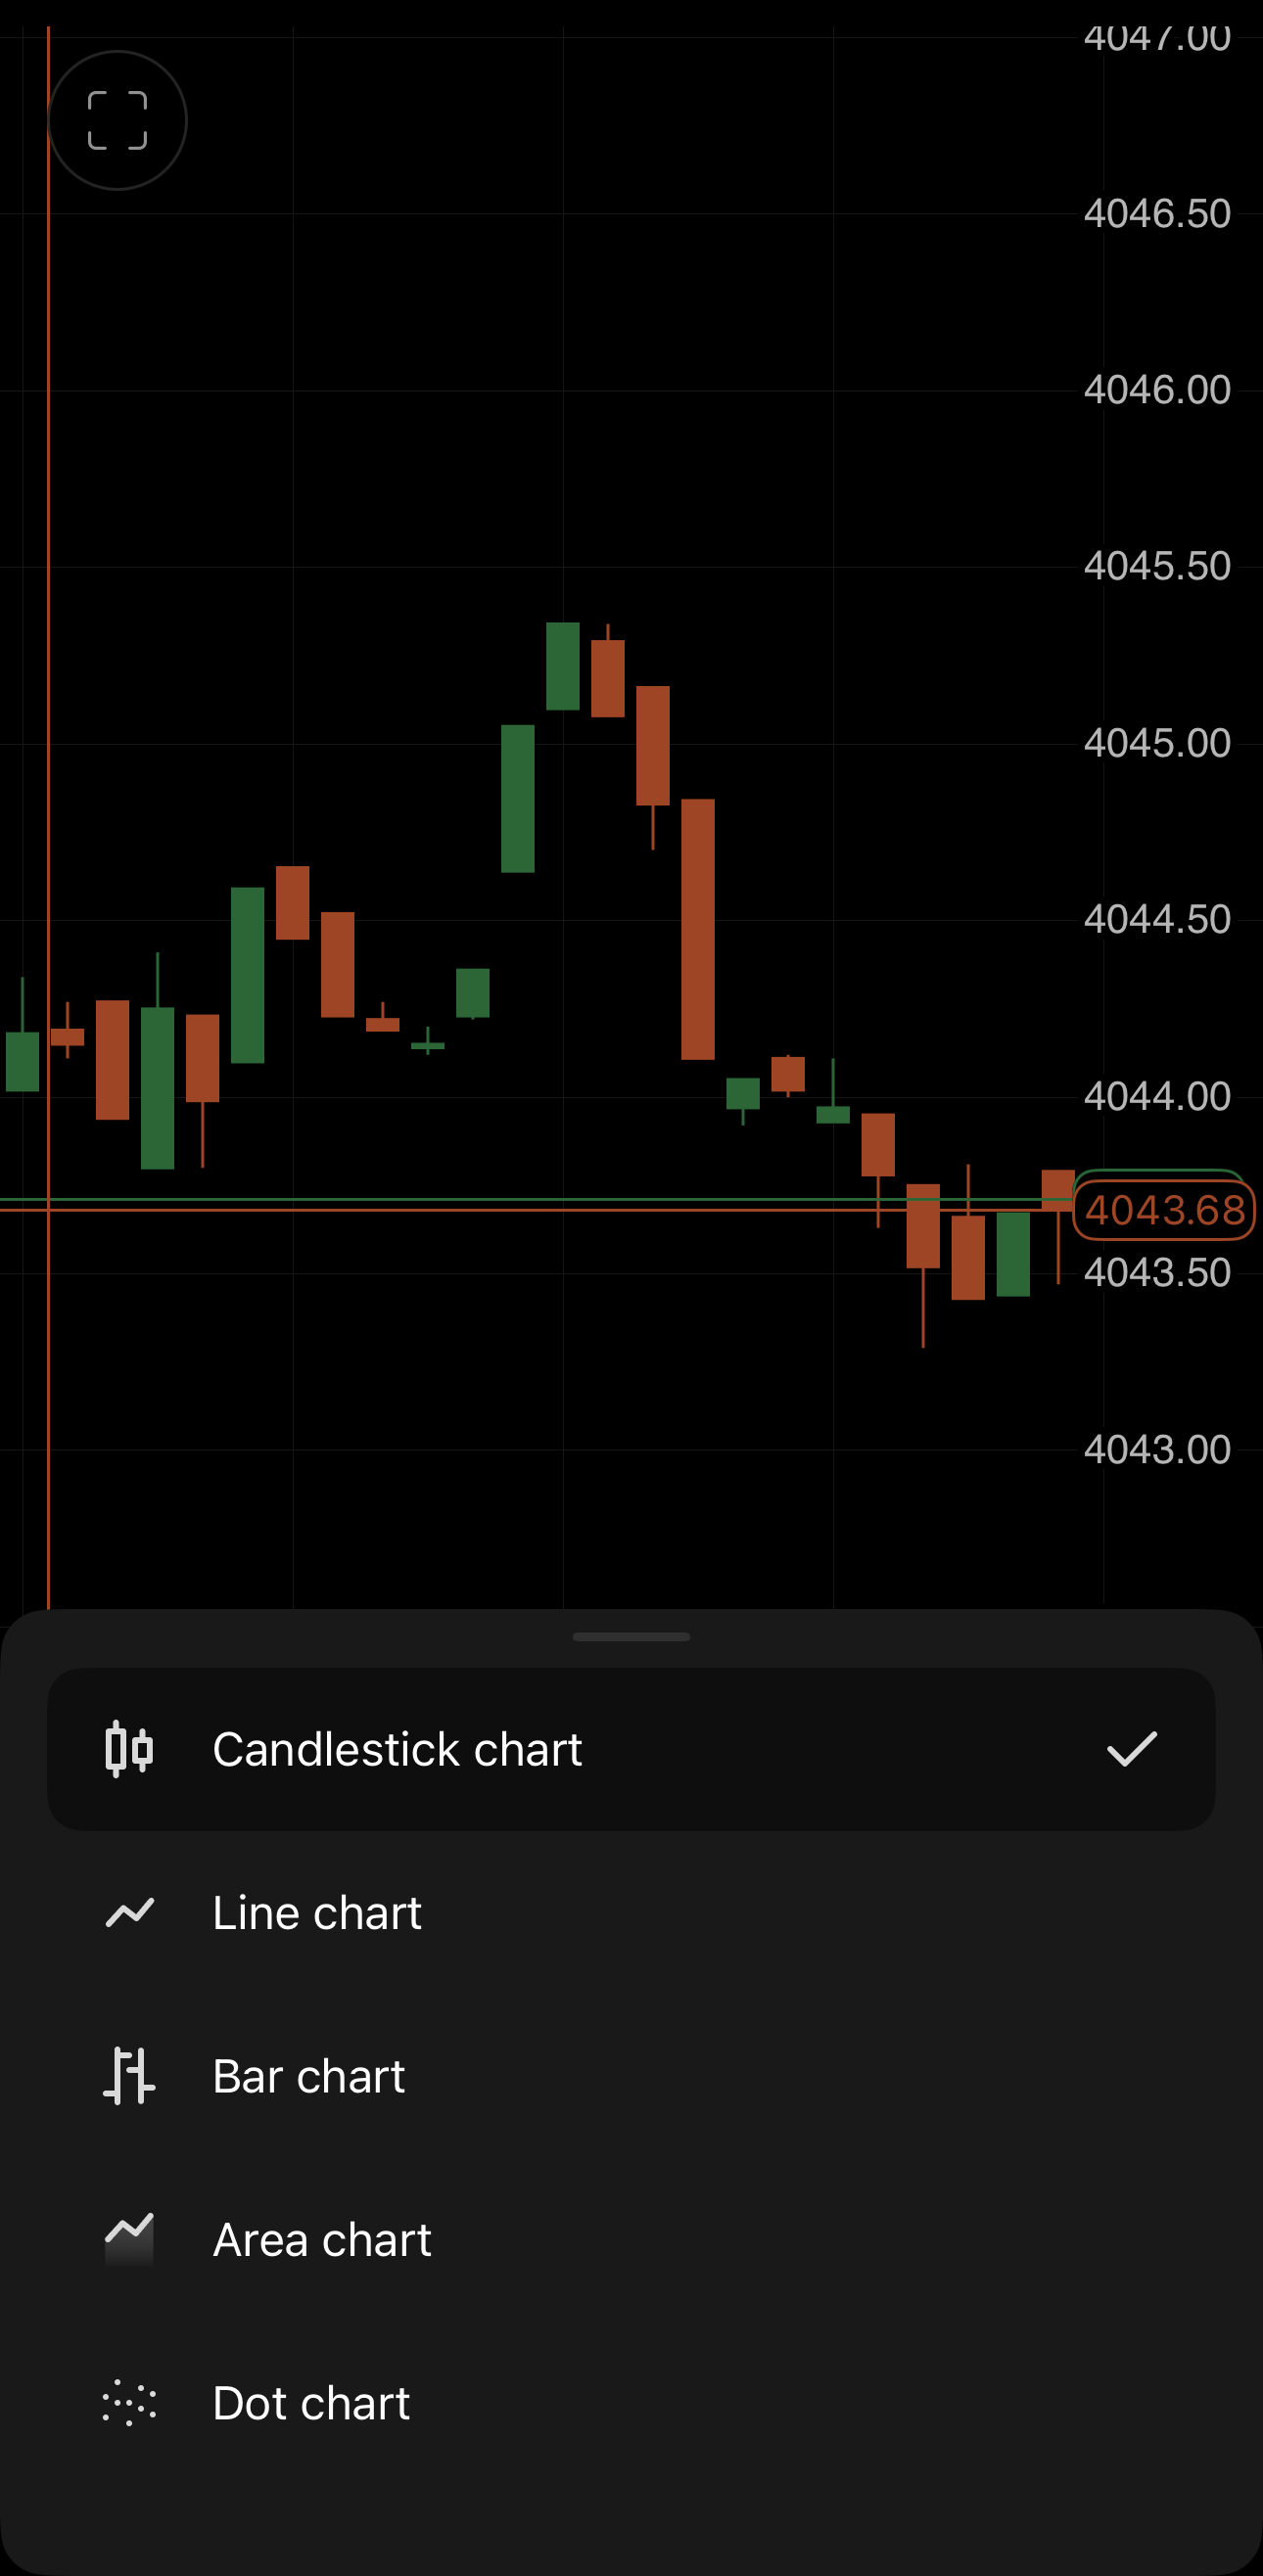
It lists the five chart types, with a tick against the selected one:
- Candlestick chart
- Line chart
- Bar chart
- Area chart
- Dot chart
Note
Heikin Ashi, Renko, Range and Tick charts redefine what a bar covers rather than how it is drawn, so they are set through the period.
Period
The period selector next to the symbol selector opens one menu holding two separate controls. They work independently: a 1M range can be drawn in m5 or h4 bars.
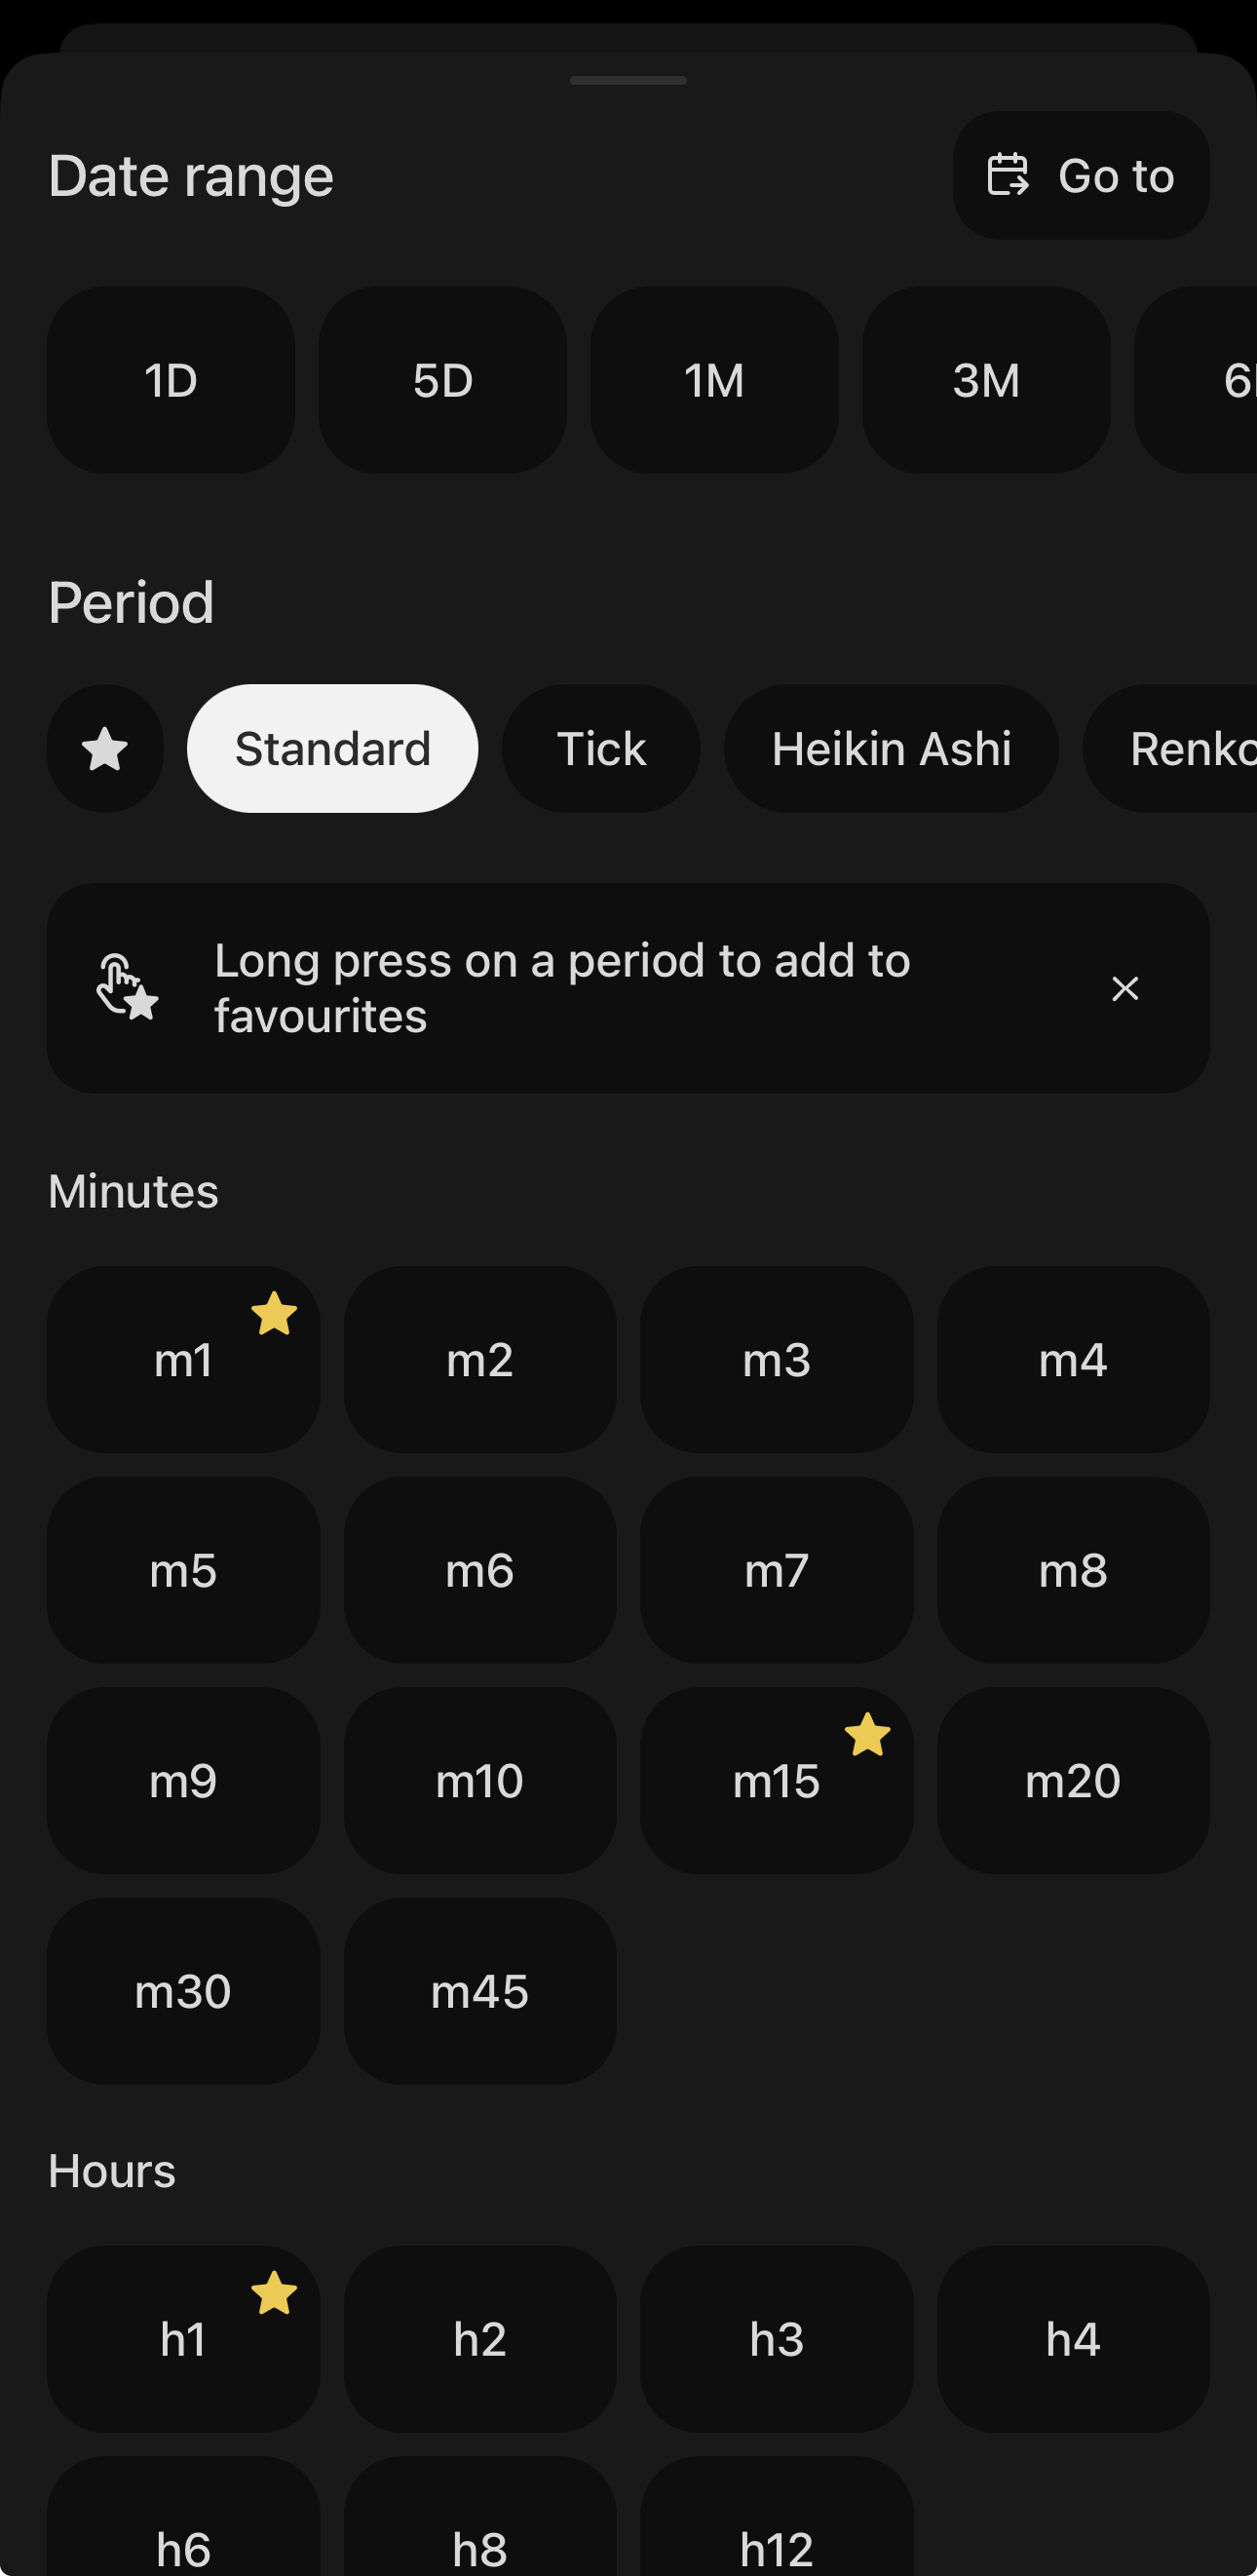
The groups below the date range set how much time a single bar covers. They sit under a row of tabs, one per kind:
Standard holds Minutes (m1 to m45), Hours (h1 to h12) and longer. Tick covers 1 to 1000 ticks a bar.
Long-tap any period to add it to your favourites. A marks the ones you have selected, and the tab at the front of the row gathers them in one place.
Candle countdown
The candle countdown reports the time left before the current bar closes, at the foot of the price axis. It follows the period on screen, so an m5 chart counts down from five minutes and an h1 chart from an hour.
Turn it off under Visibility.
Date range
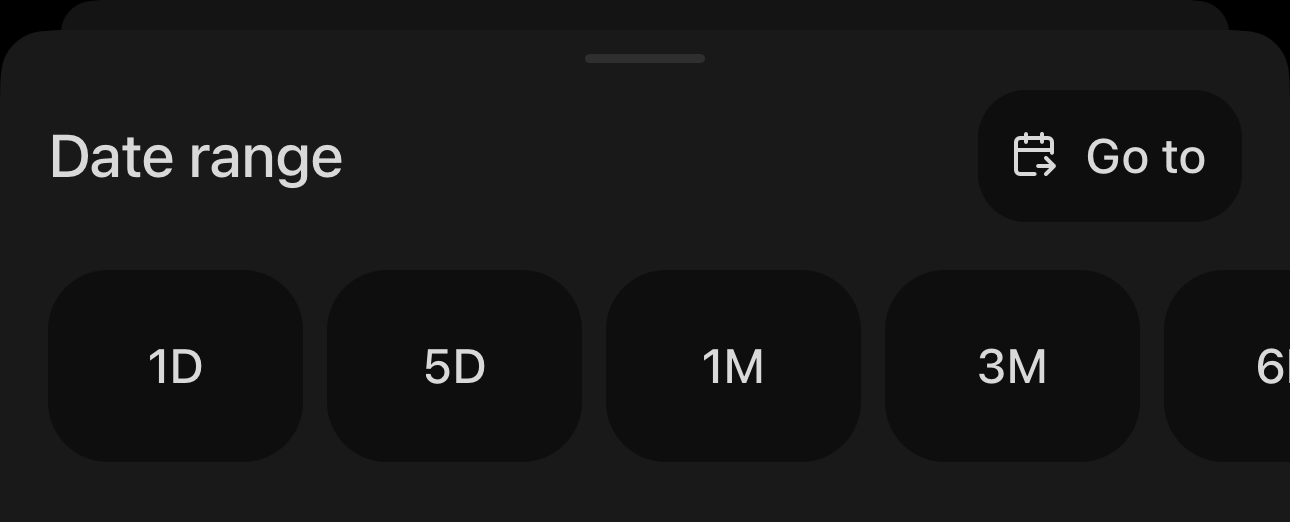
The date range at the top sets how much history is on screen: one day (1D), five days (5D), one month (1M), three months (3M), six months (6M), one year (1Y) or five years (5Y).
Go to
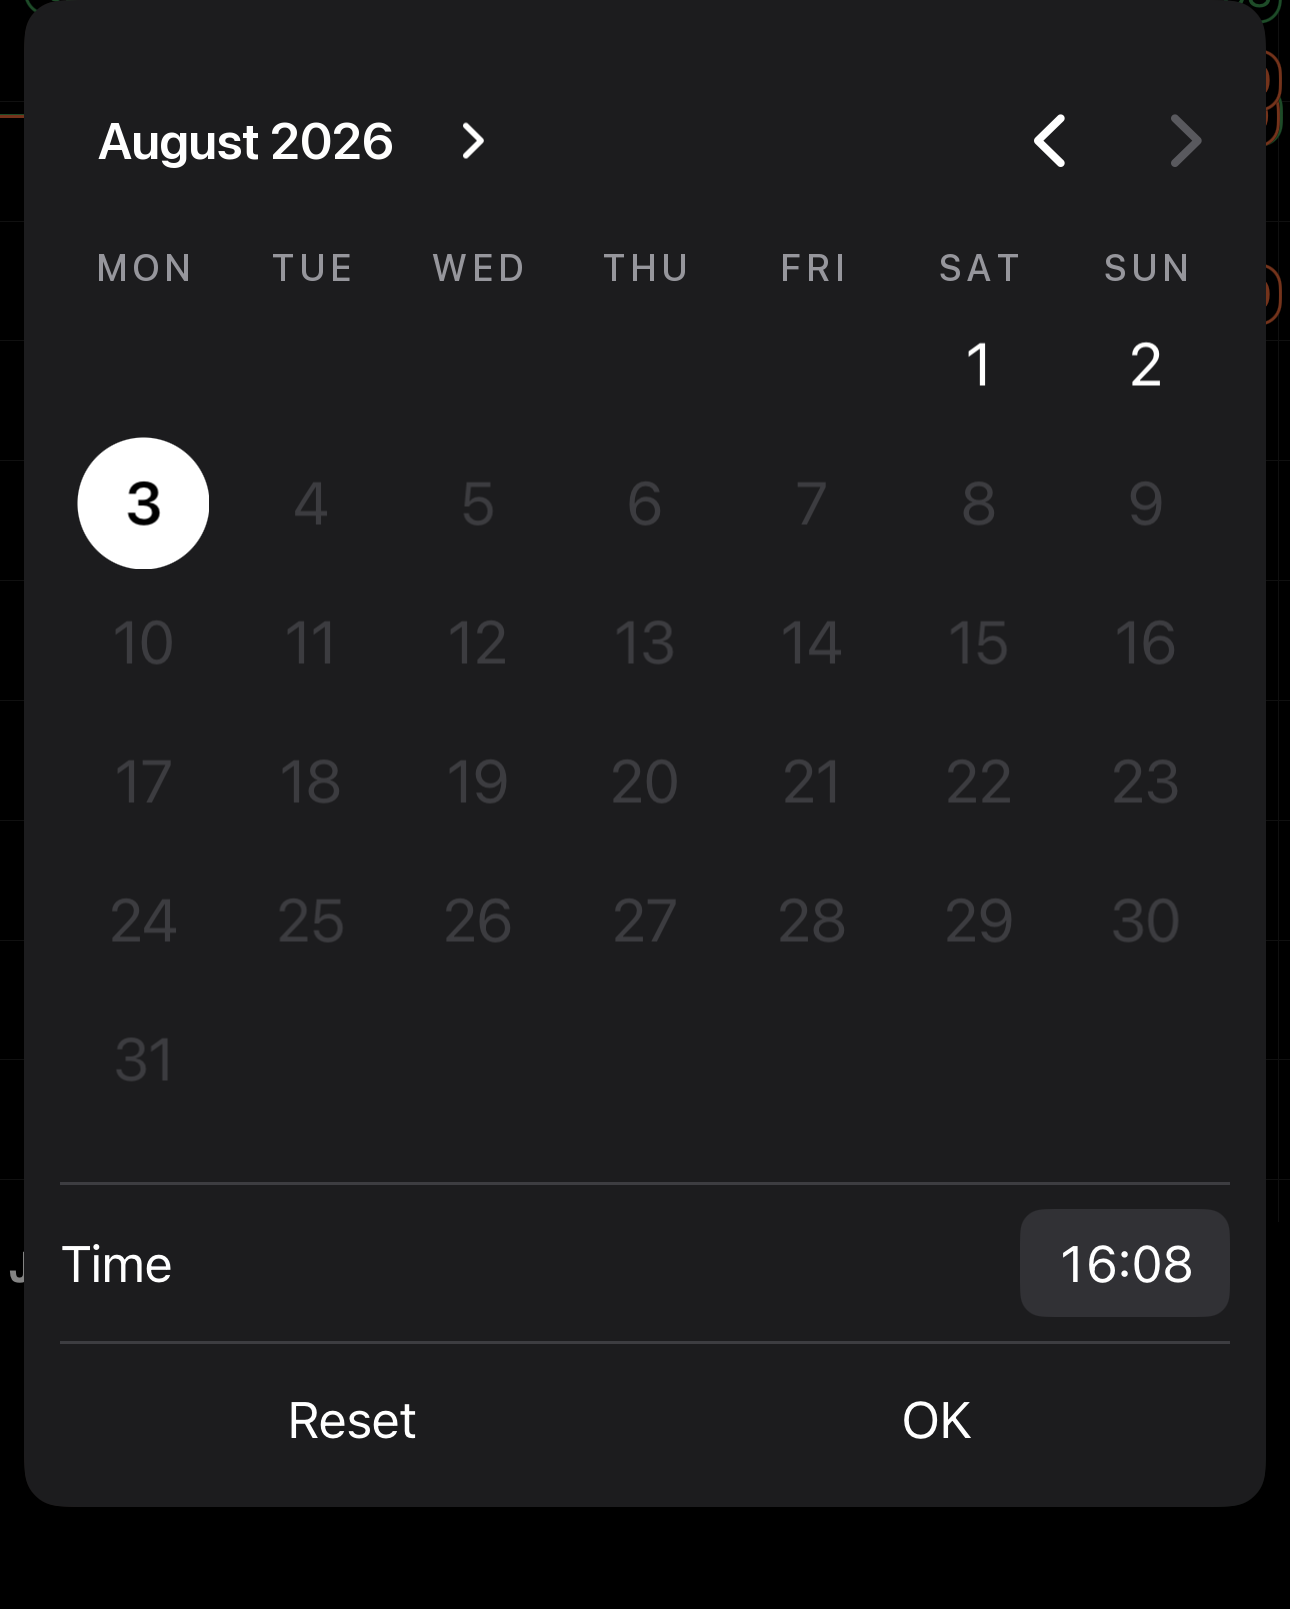
Tap Go to in the corner of the period menu to jump the chart to a particular moment. Pick a date, set a Time for the exact bar, then tap OK. Tap Reset to return the chart to the live edge.
Focus mode
Tap an item on the chart to focus it. The selected position, order or price alert stays at full brightness, together with any protection controls belonging to it, while everything else fades to a dim outline. Tap the chart again to leave focus mode.
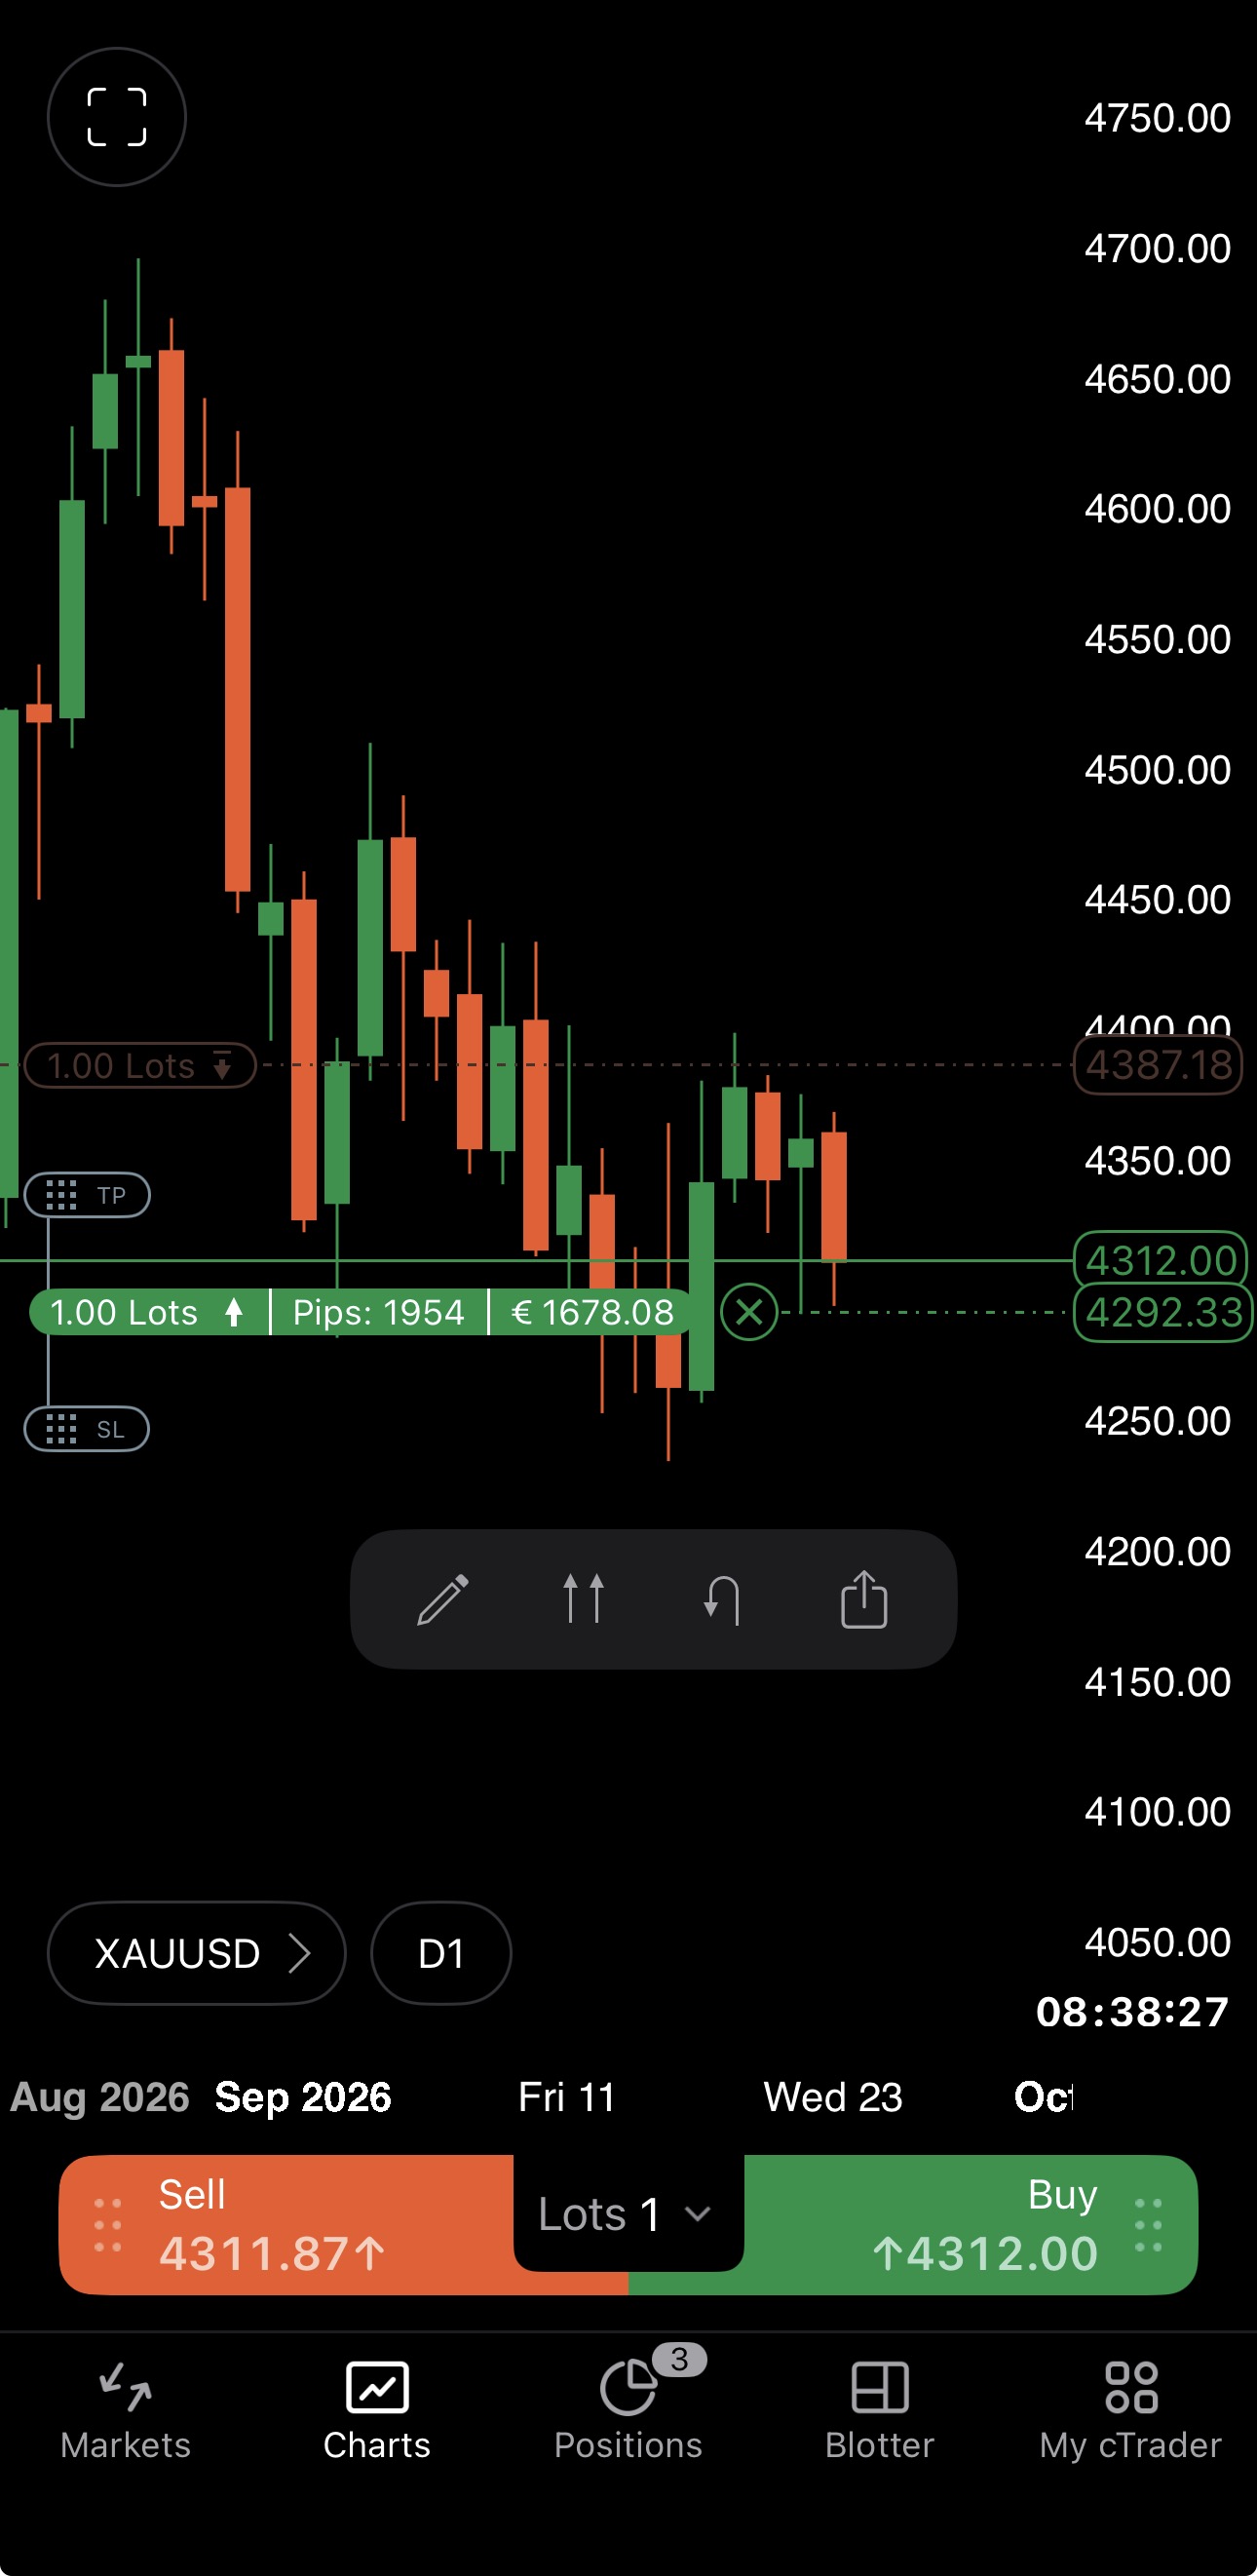
Selecting an item also raises its actions in a toolbar, which you can drag anywhere on the chart. A position or an order gets the trading actions. A price alert gets its condition, duplicate and share actions. A drawing gets the appearance actions, such as colour and line thickness.
Landscape view
Turn the phone on its side and a landscape chart opens on the last symbol you viewed. This works anywhere in the app, not only in Charts. Turn the phone upright to return to the screen you left.
The extra width shows more history at the same period.