Chart objects
Chart objects are the tools you add to a chart to read the price: drawings, indicators, the crosshair and the risk-reward tool.
For what each tool is for and how traders read it, see Line study tools.
Drawings
Drawings are the lines, channels and shapes you place over the price to mark a level, a trend or a range. They stay with the symbol and are visible only to you.
Add a drawing
In the chart toolbar, tap . A sheet opens with the tools grouped into five categories, one per tab along the bottom. Tap a tool to select it.
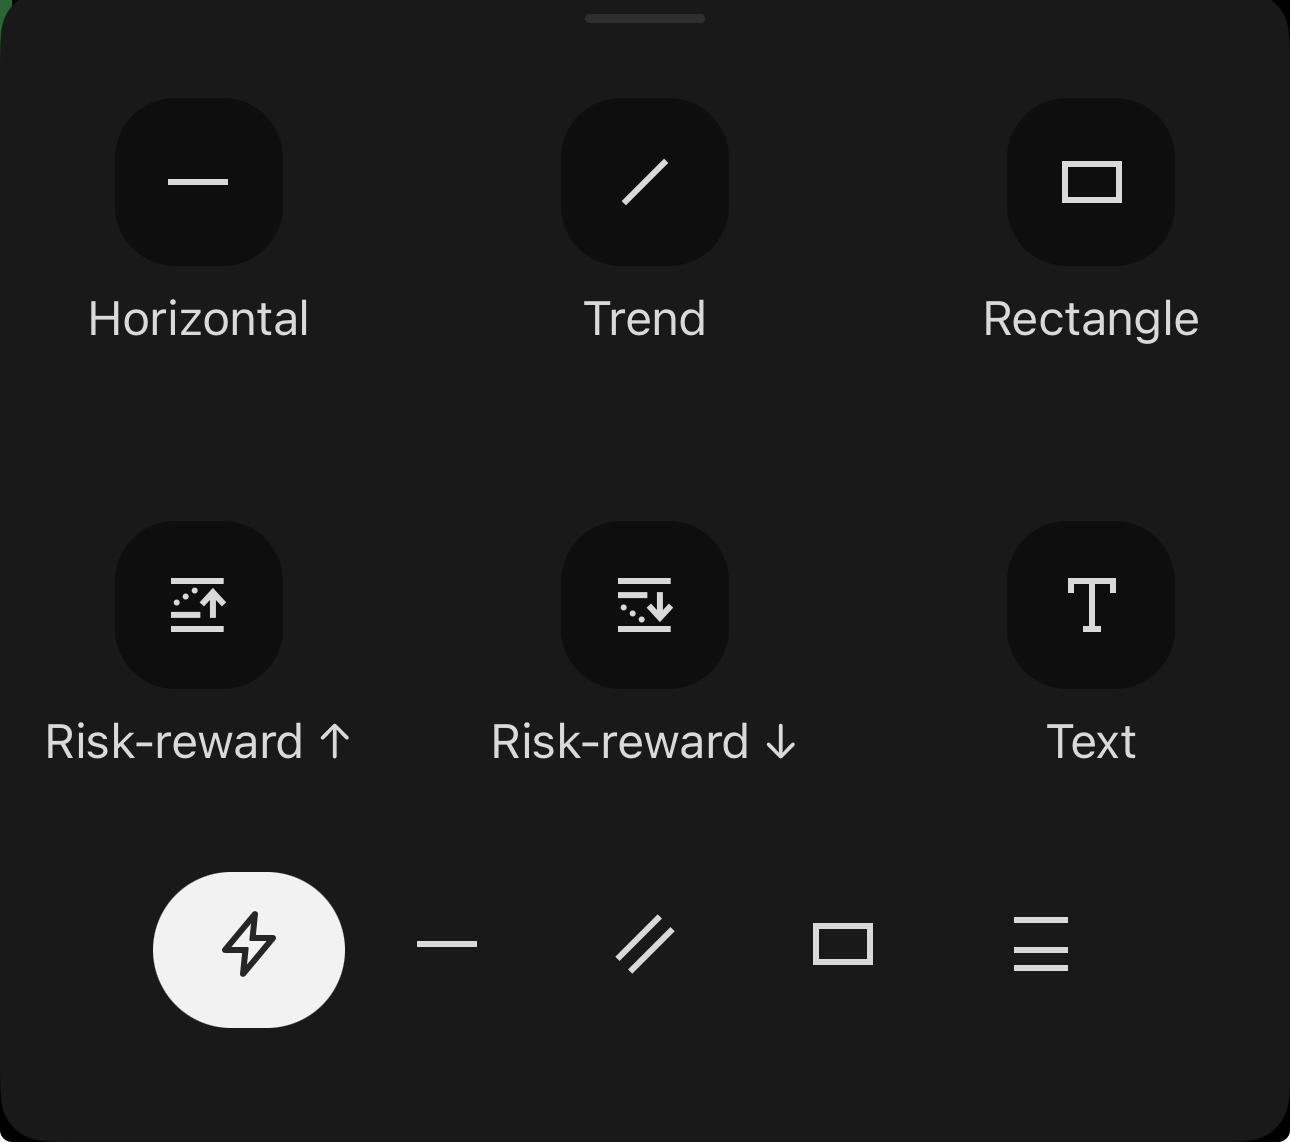
A fixed set of shortcuts that you cannot add to:
- Horizontal, Trend and Rectangle – repeated from their own categories.
- Risk-reward ↑ and Risk-reward ↓ – an executable risk-reward tool for a planned buy or sell.
- Text – a note placed on the chart.
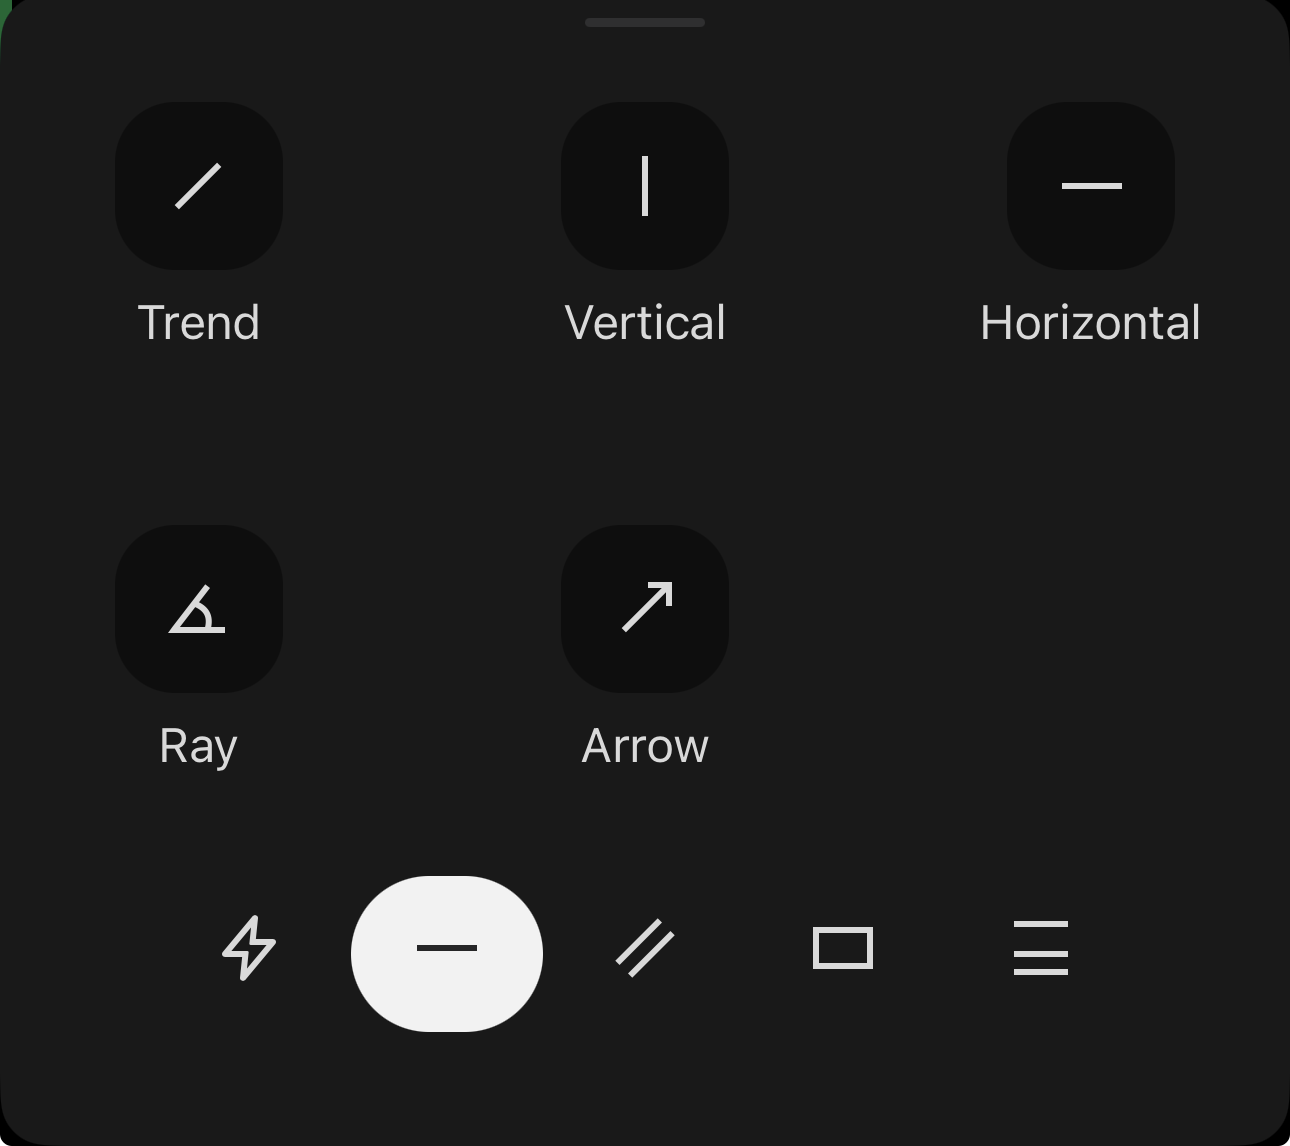
Straight lines, each set by one or two points:
- Trend – joins two points, usually a pair of highs or a pair of lows, to show the direction the price is holding.
- Vertical – marks a moment rather than a price, such as a session open or the bar a move began on.
- Horizontal – marks a price level that keeps mattering.
- Ray – a trend line that carries on past its second point, so a line drawn from history projects into the future.
- Arrow – a trend line with a head on it, for pointing at what you want to find again later.
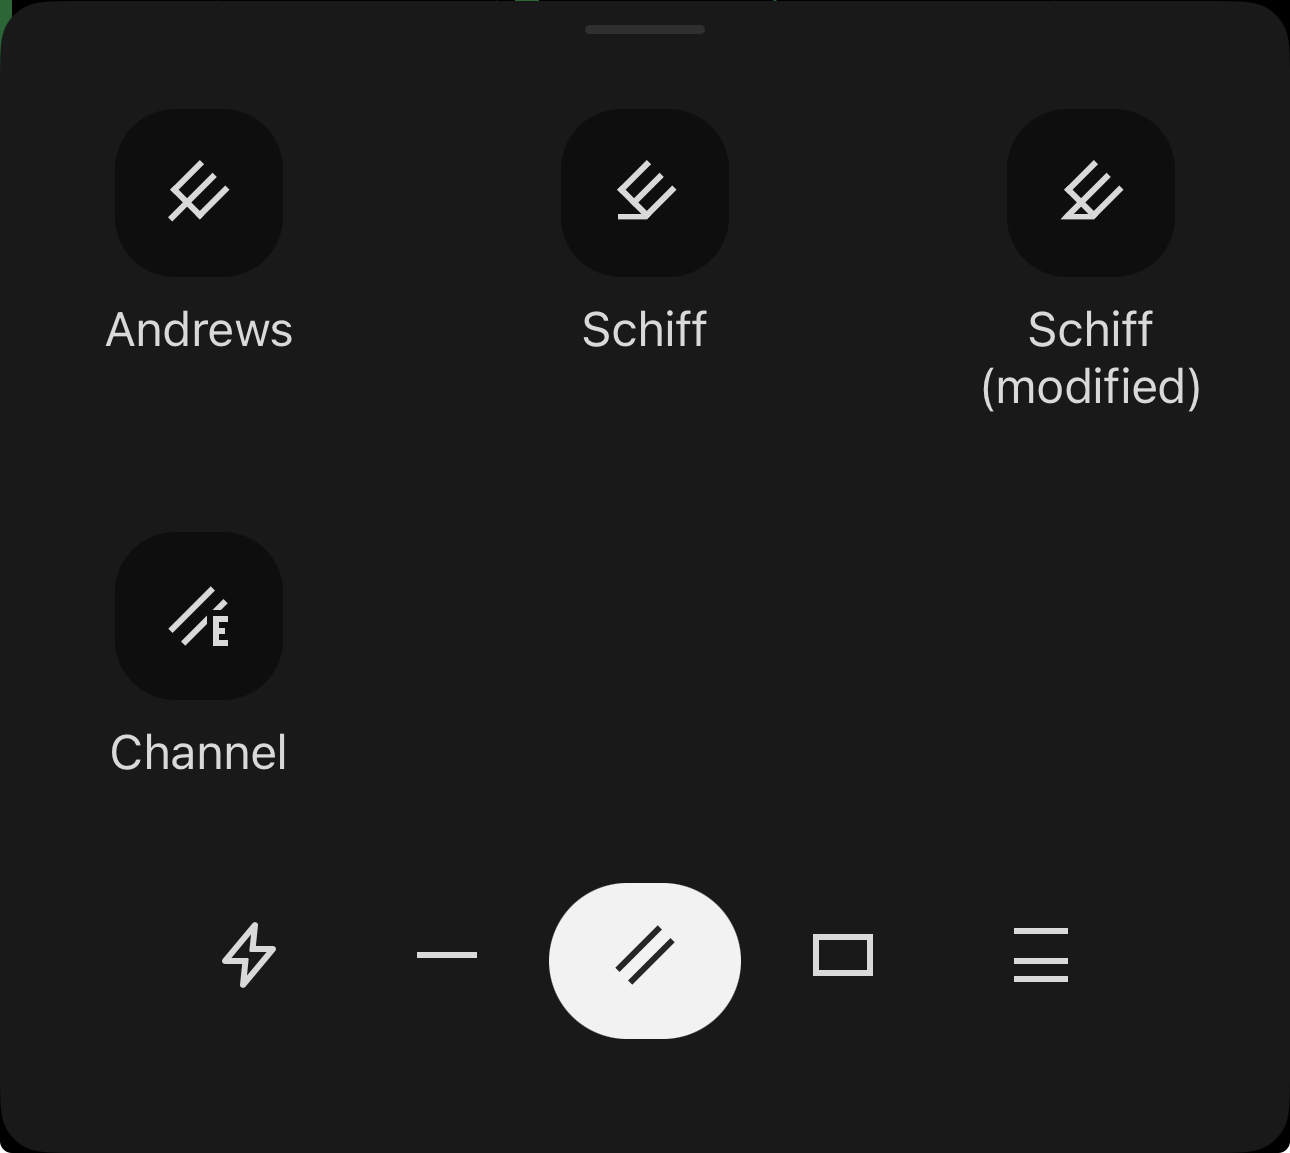
Parallel lines that frame where a trend has been holding.
- Andrews – three parallel lines framing where the price is likely to travel.
- Schiff and Schiff (modified) – the same three lines drawn from a shifted origin, which tilts them to sit better on a trend that has changed angle.
- Channel – two parallel lines framing a trend between its support and resistance.
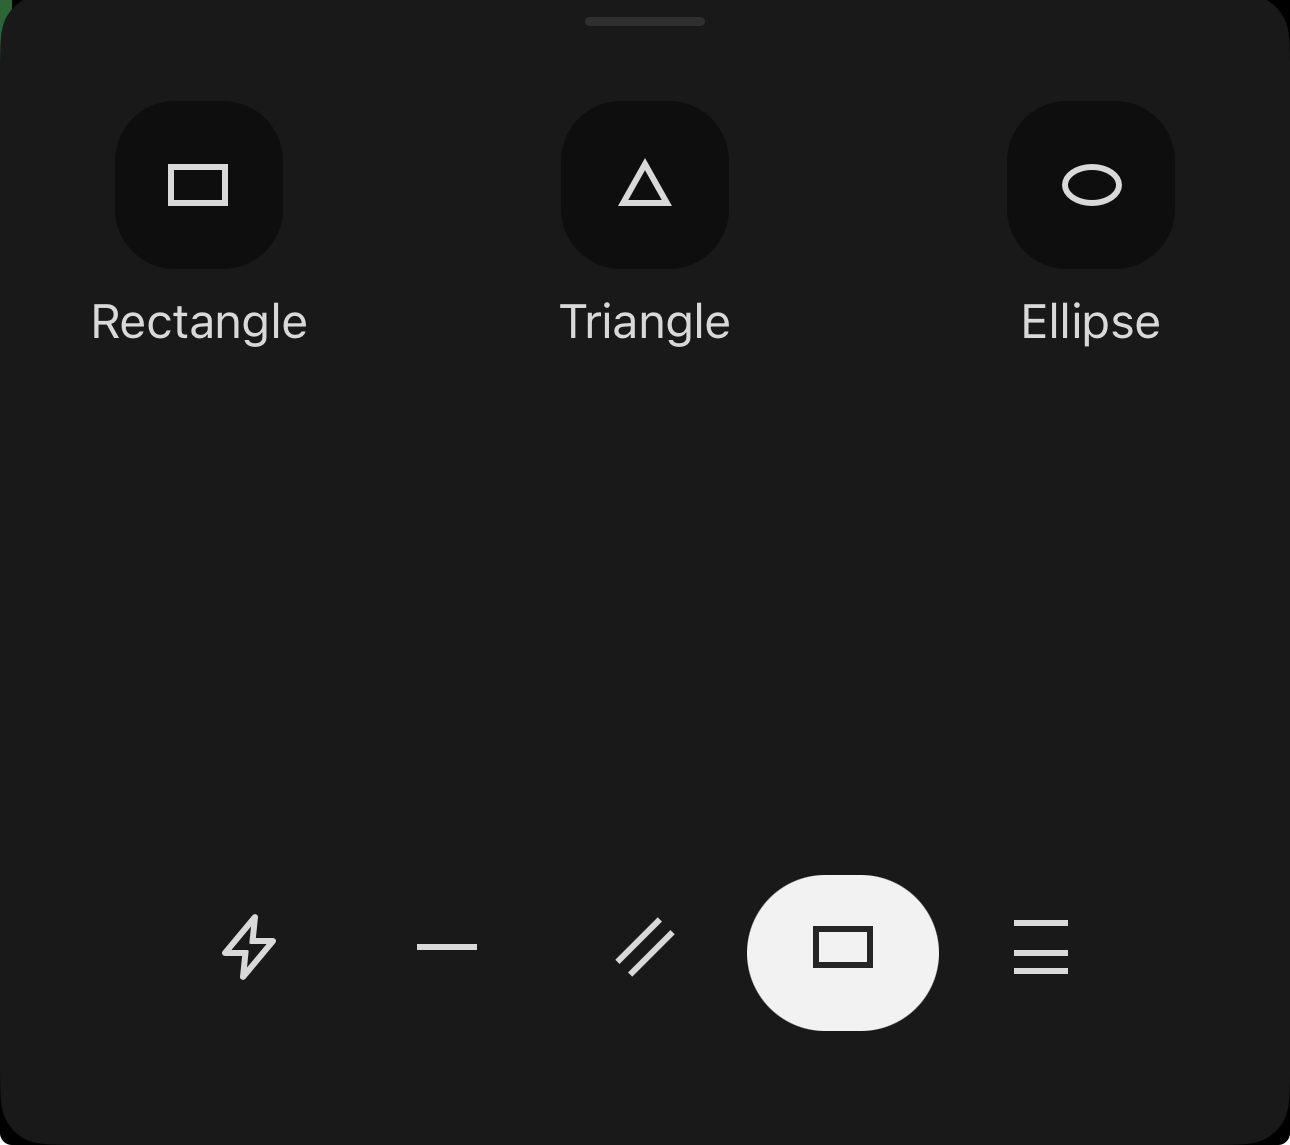
Outlines for marking off an area of the chart.
- Rectangle – box off a range or a consolidation.
- Triangle – mark a pattern that is converging to a point.
- Ellipse – ring an area you want to find again.
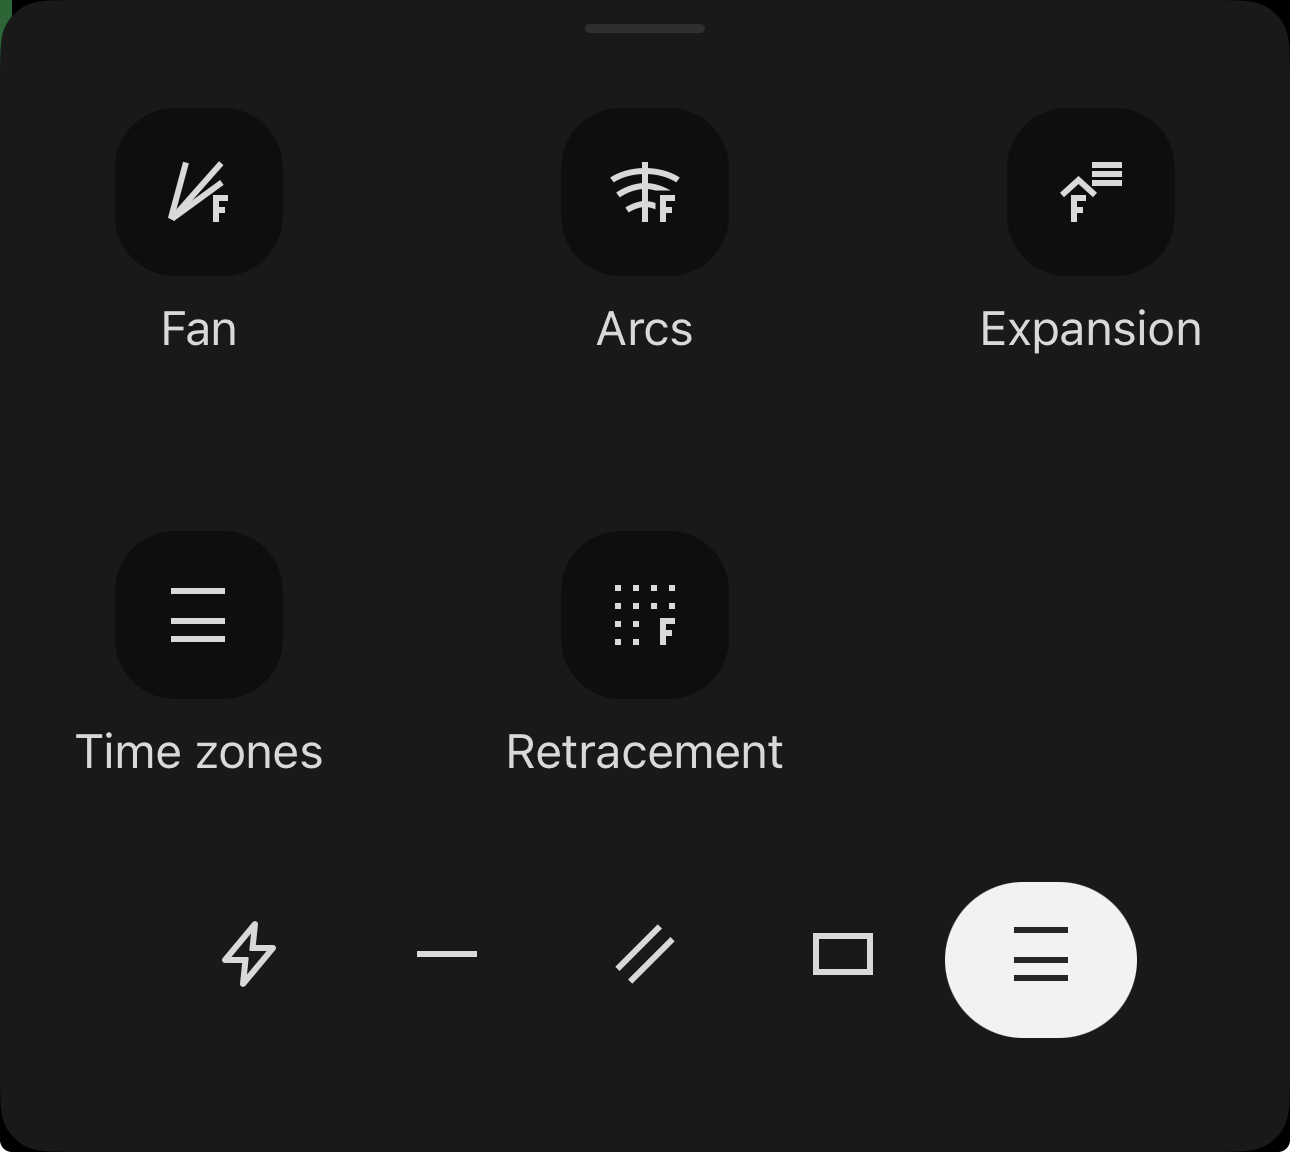
Levels projected from a move you mark out, at the Fibonacci ratios.
- Fan – diagonal lines for support and resistance that move with time.
- Arcs – curves struck at Fibonacci distances from the end of a move, combining price and time in one shape.
- Expansion – levels for how far a continuation might run.
- Time zones – vertical lines at Fibonacci intervals, marking when a turn might come rather than where.
- Retracement – horizontal levels for how deep a pullback might go.
Drag the selected tool on the chart to position it, then adjust it.
Adjust a drawing
Tap a drawing to select it. A control appears at each of its points. Drag any control to reshape the drawing, or drag the drawing itself to move it as a whole.
A drawing toolbar also appears, which you can drag anywhere on the chart.
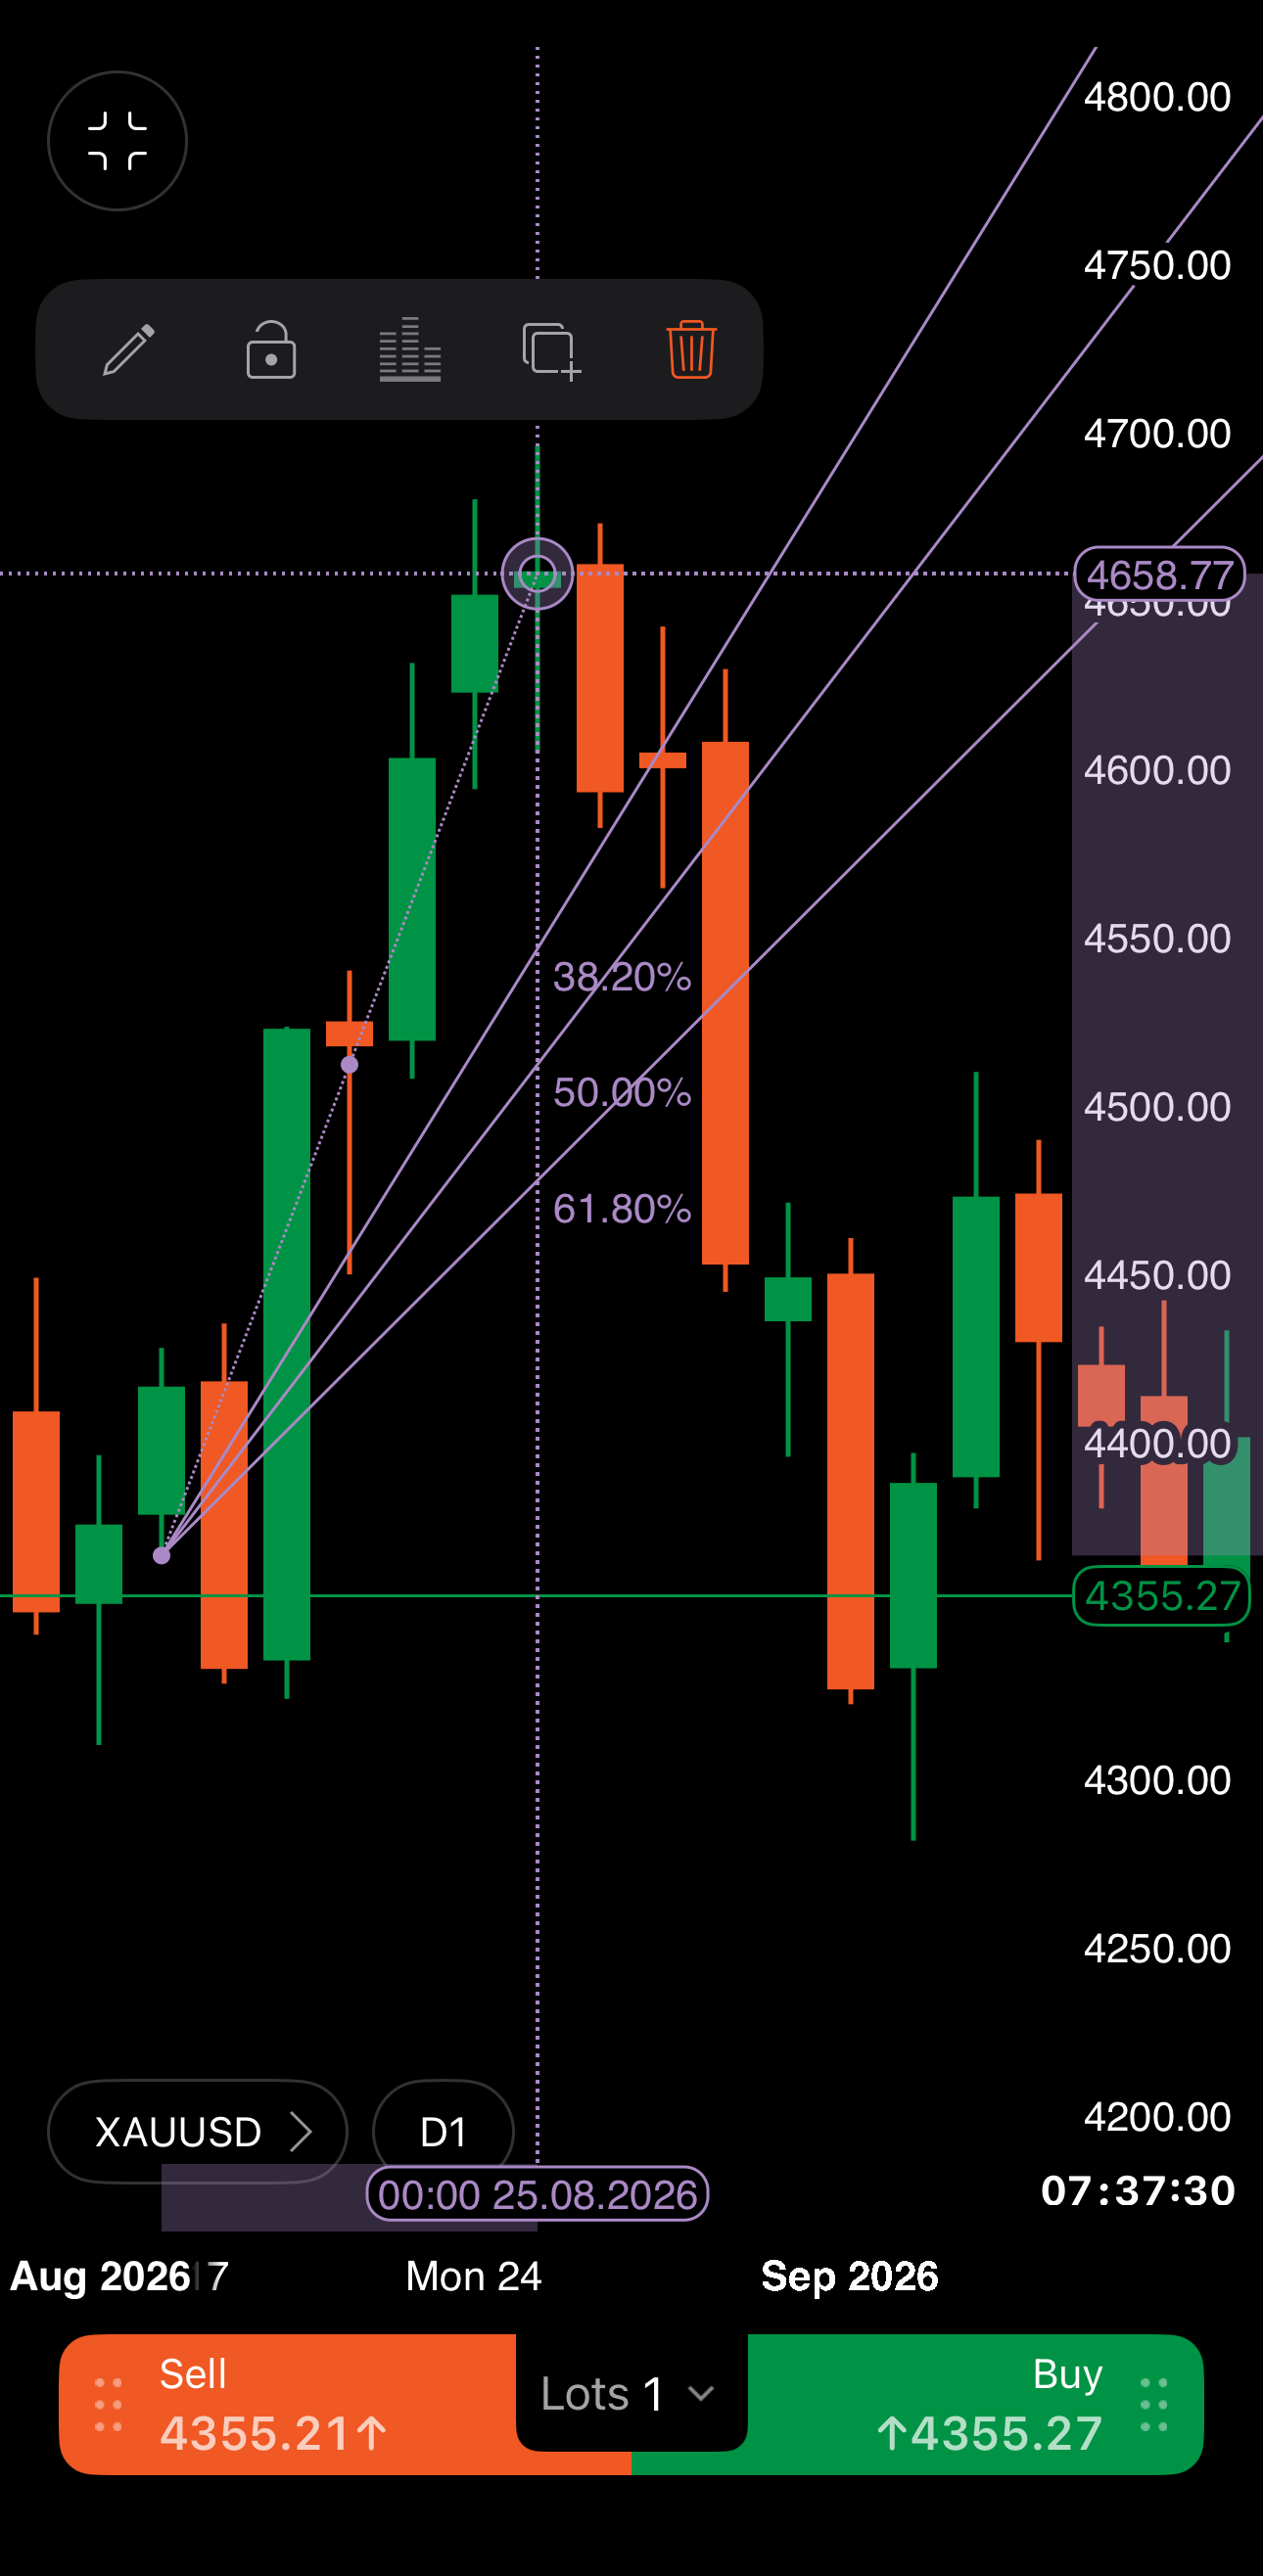
The chart object toolbar holds:
- – restyle the chart object: its colour, line thickness and line style.
- – lock the chart object in place so you cannot move or reshape it by accident. Tap again to unlock.
- – edit the object's parameters.
- – duplicate the chart object.
- – delete the chart object.
Indicators
An indicator is a calculation drawn from the price to make it easier to read.
Add indicators
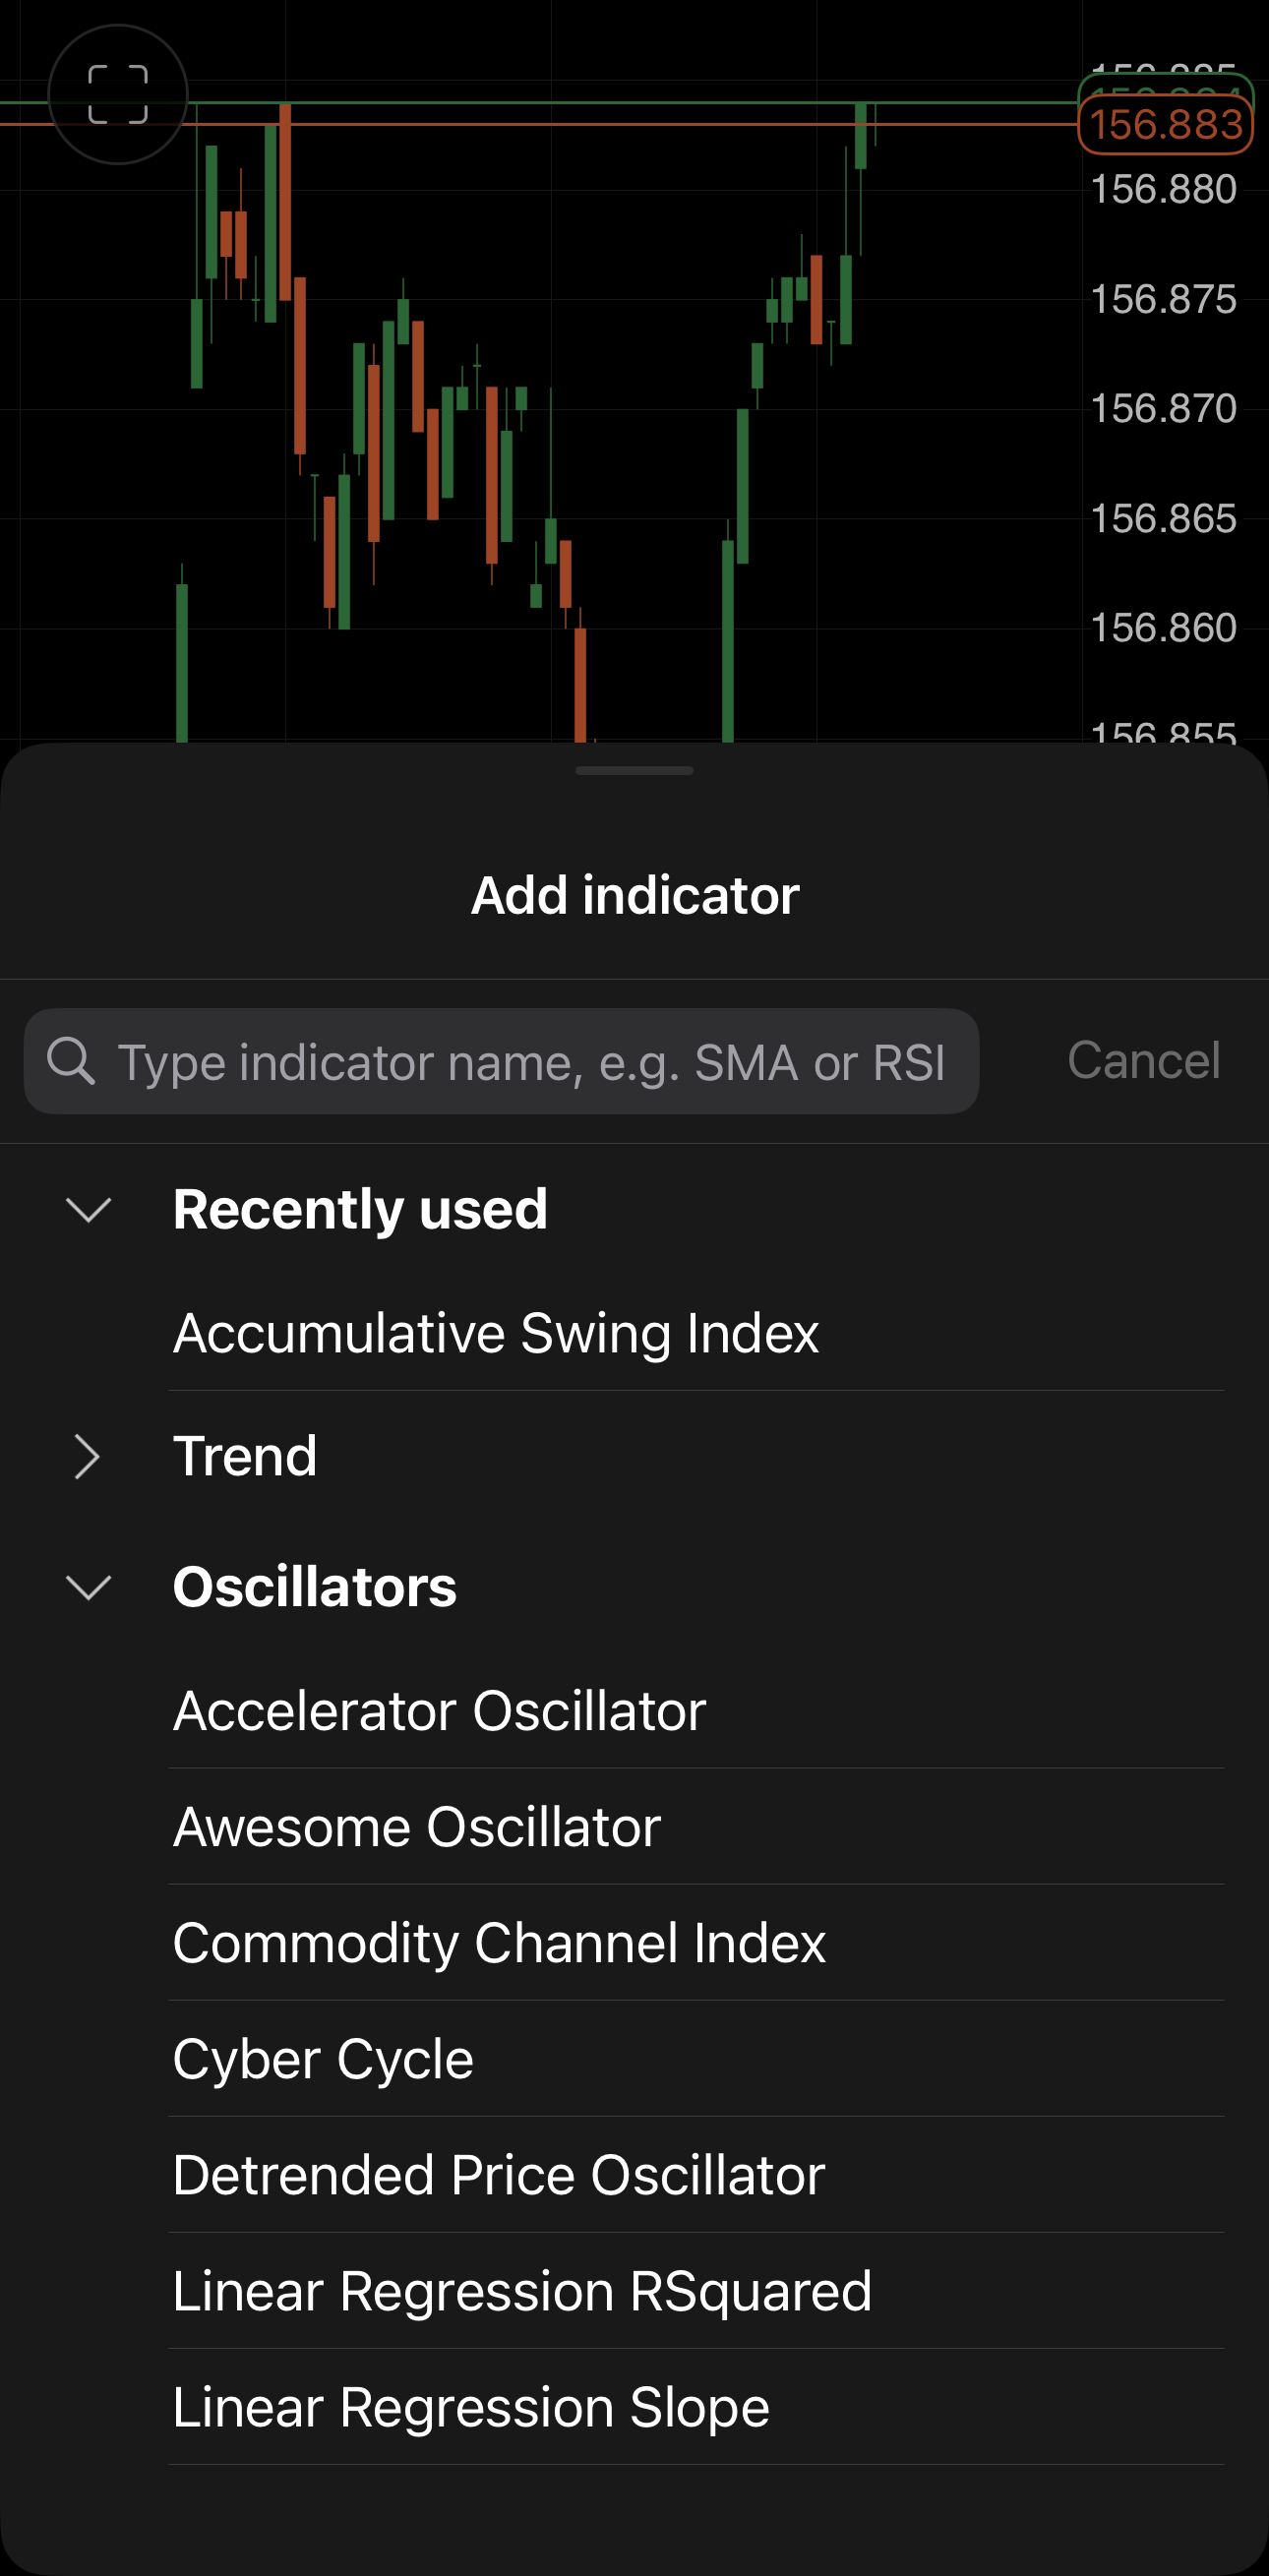
To add indicator, tap in the chart toolbar. With no indicators on the chart, this opens the Add indicator bottom sheet. Search by name, or scroll the list: Recently used first, then the indicators grouped by kind, such as Trend and Oscillators. Tap a group to expand it, then an indicator to add it.
Manage indicators
Once you've selected indicators you need, opens Indicators instead, which lists them. Each entry names the indicator with its current parameters in brackets, such as Chaikin Volatility (14, 10, Simple).
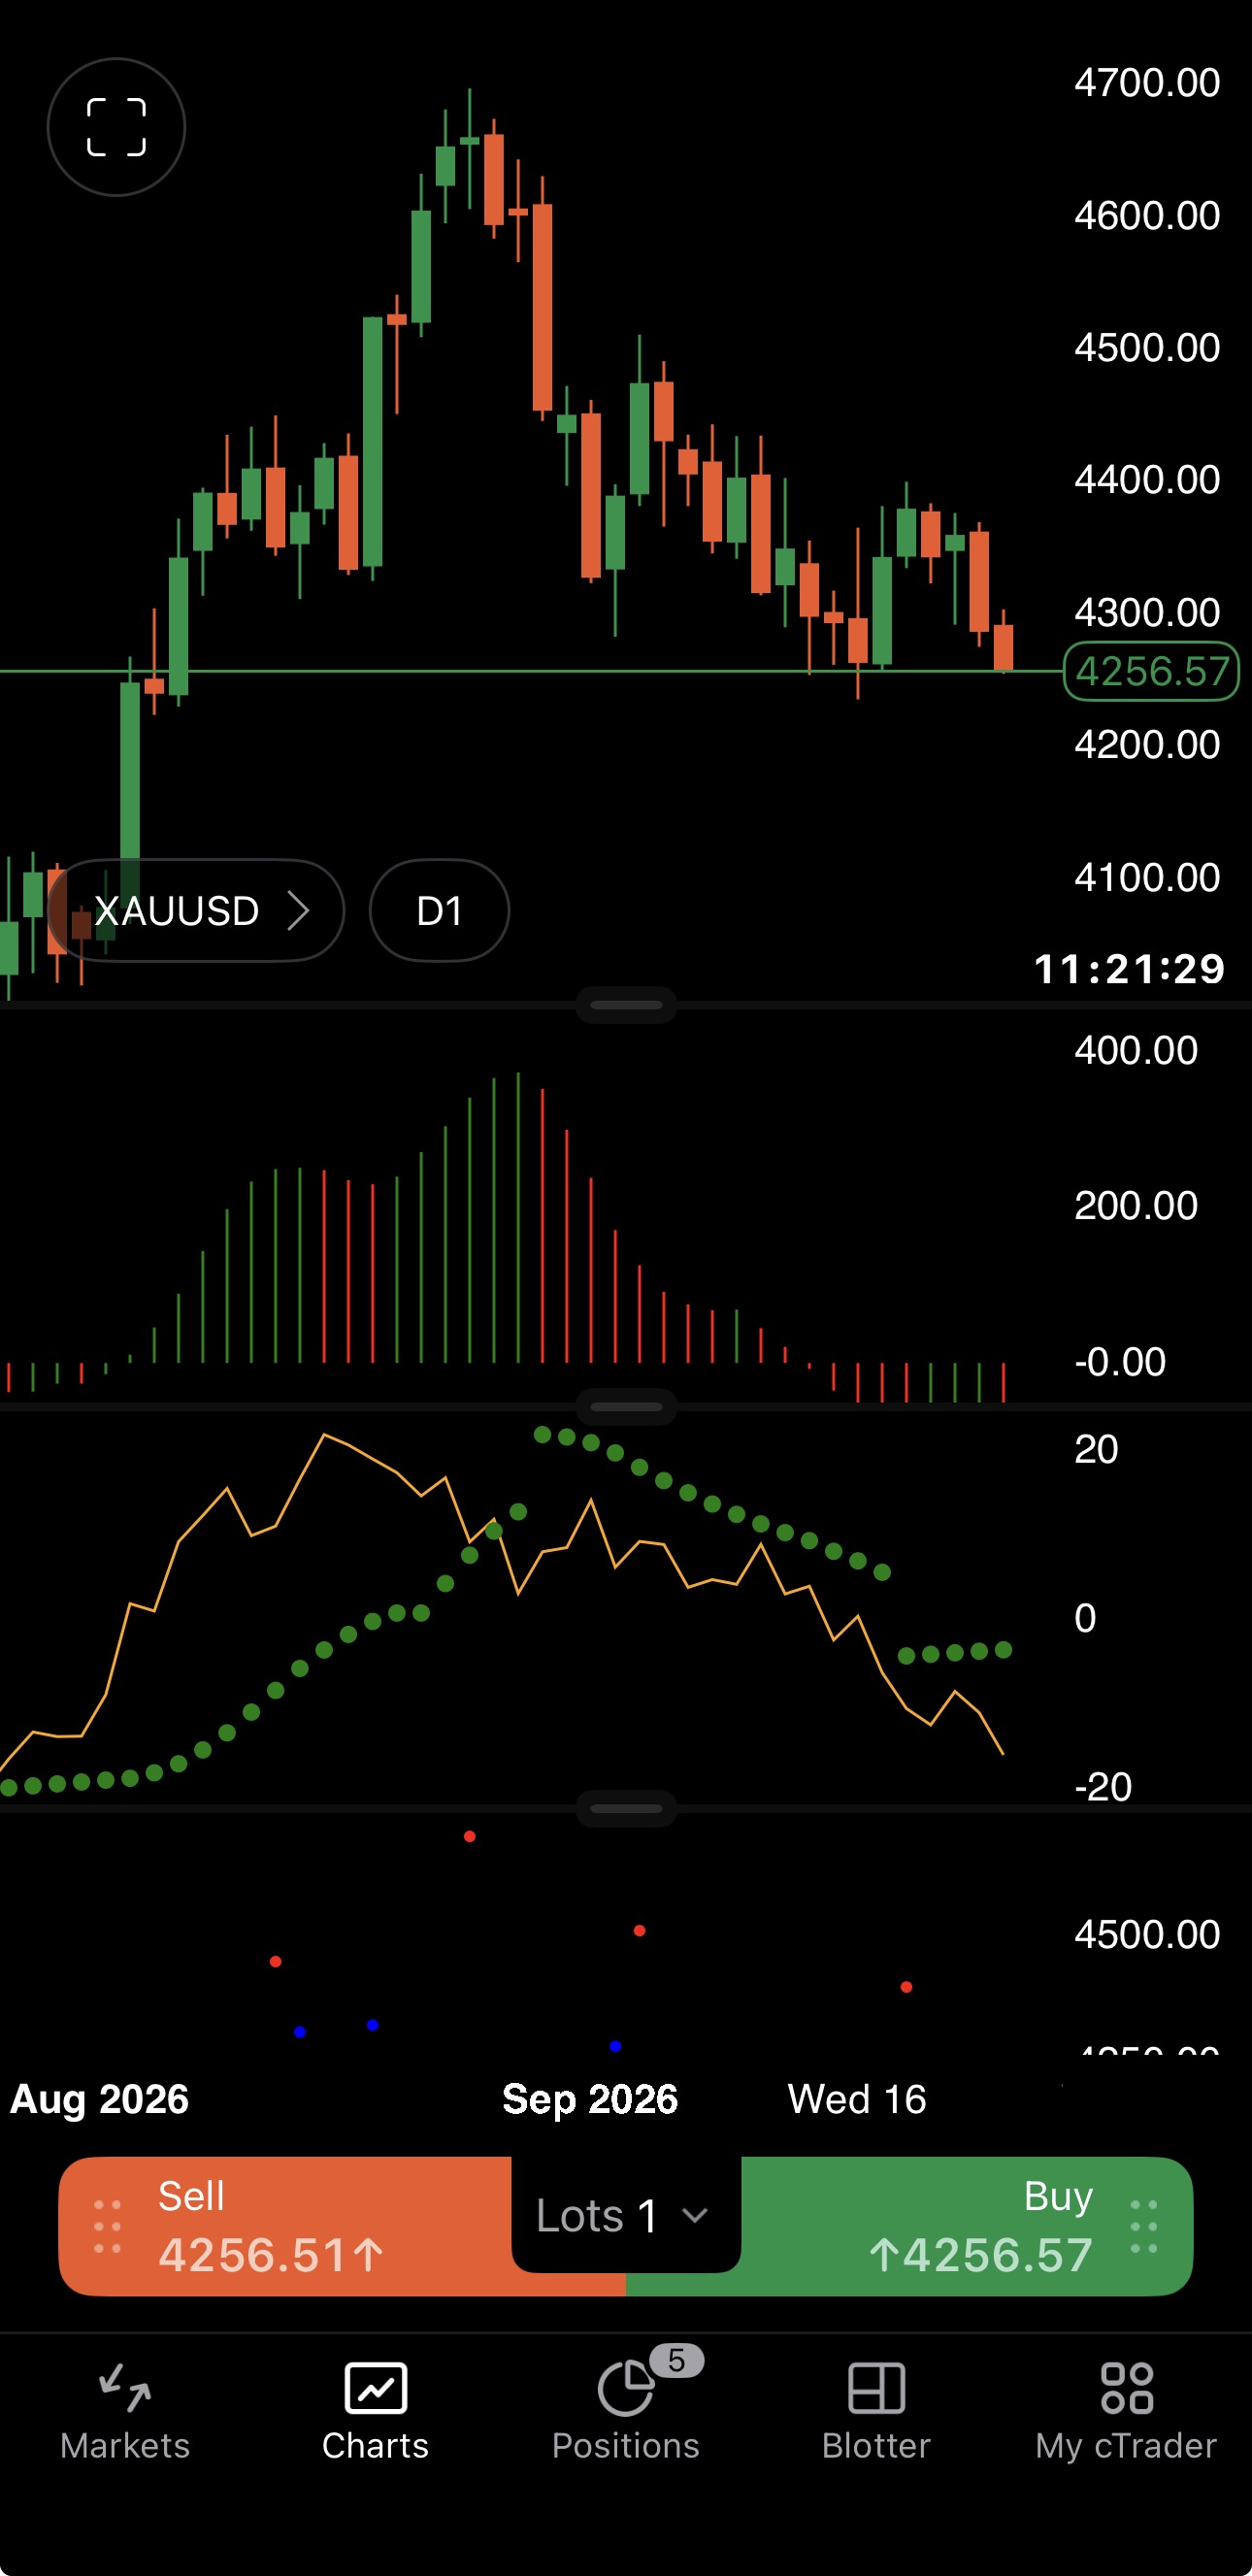
Entries are grouped by where the indicator is drawn:
- On chart – indicators on the price's own scale, such as moving averages.
- Panel 1, Panel 2 and so on – indicators on their own scale, such as oscillators, each with a panel of its own.
Tap an entry to expand it. Each parameter gets its own row, set with and or through a picker, and Main sets the colour the indicator is drawn in. Tap beside an entry to take that indicator off the chart.
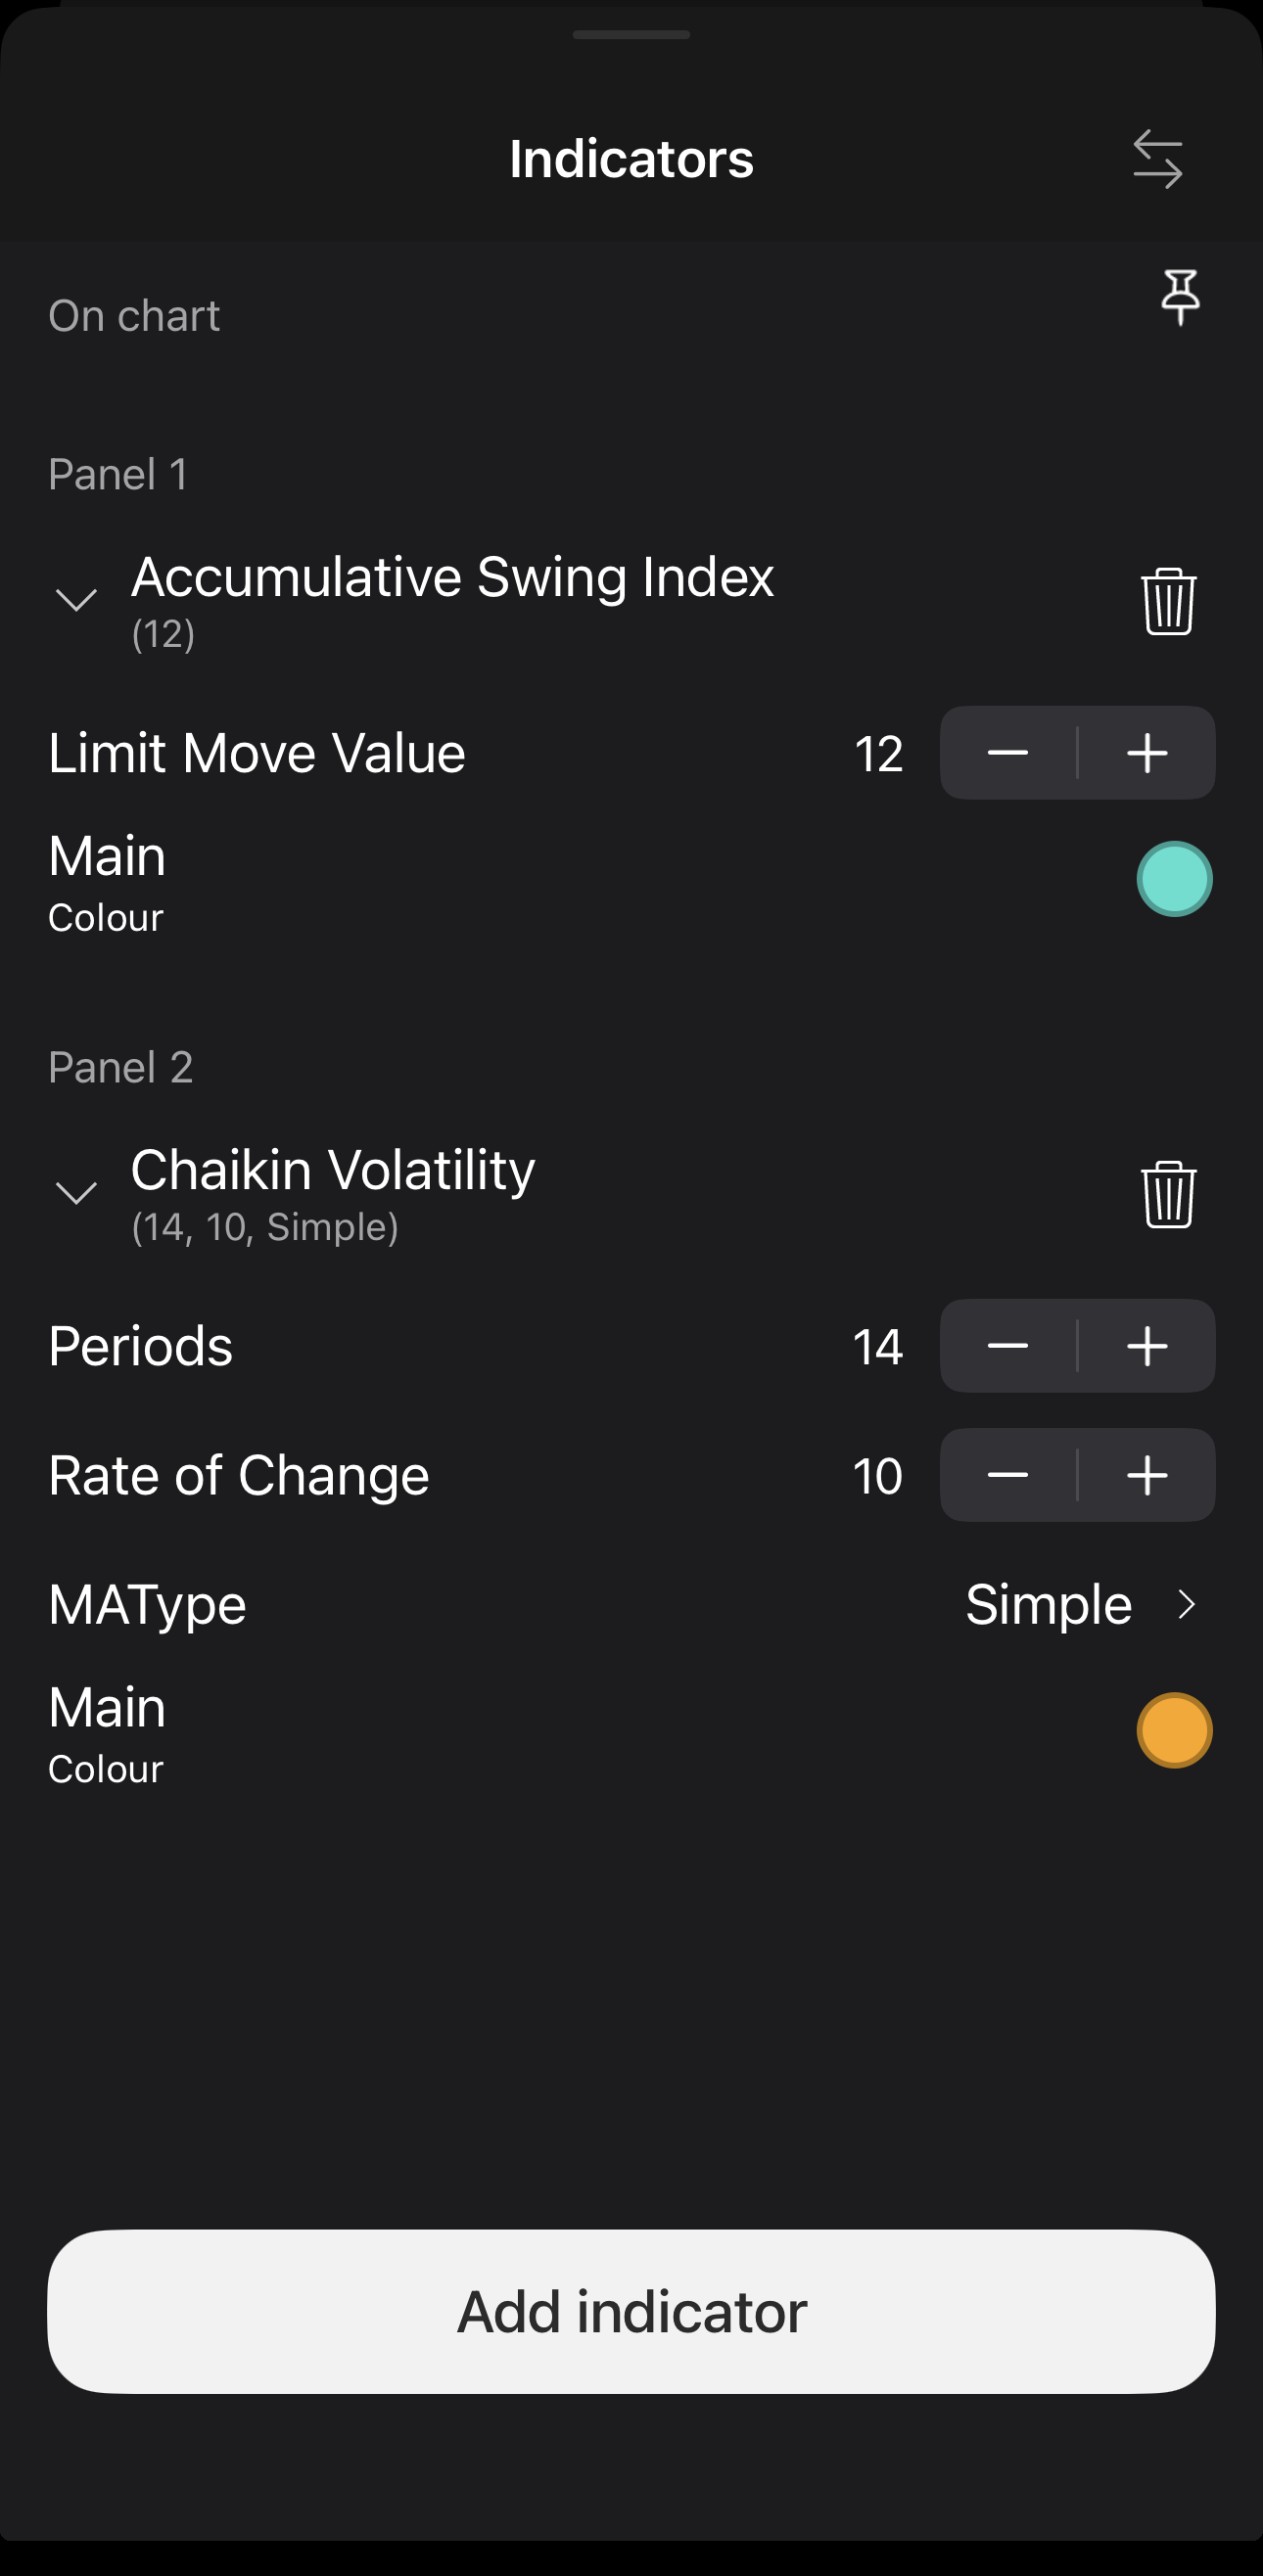
Two controls sit above the list:
- – open Reorder indicators, covered below.
- – pin the chart so it stays at full height. Unpinned, it can be collapsed.
Add indicator at the foot opens the same search sheet described above.
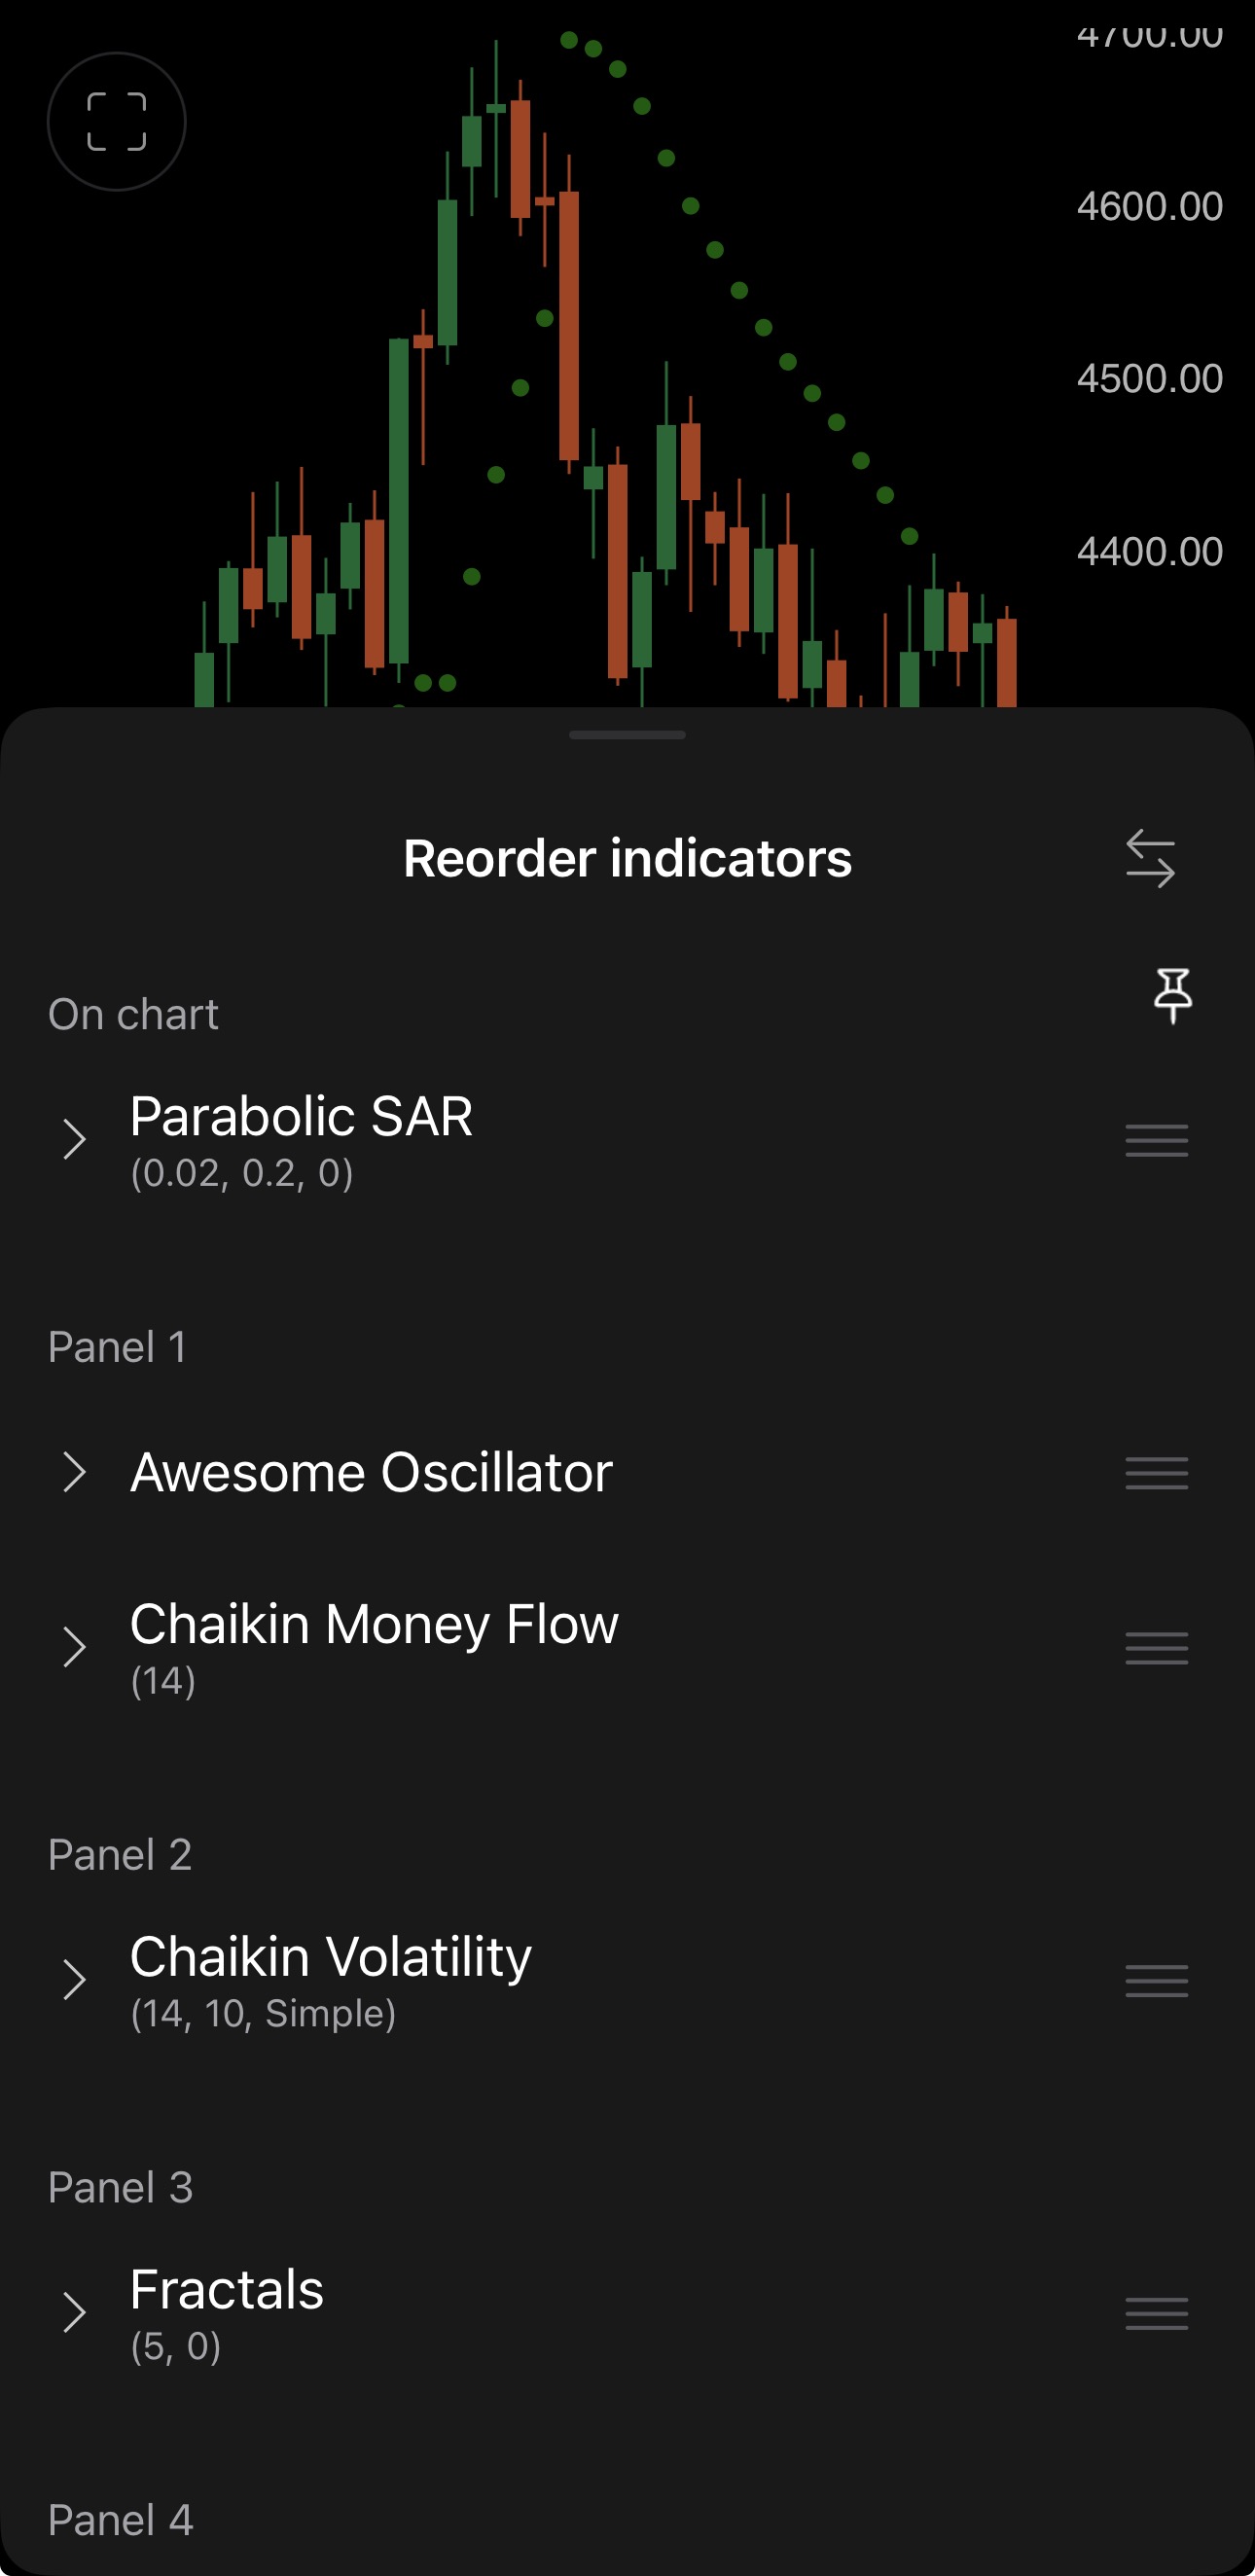
Reorder indicators repeats the On chart and Panel groups, with a grip beside every entry. Tap in its corner to return to Indicators.
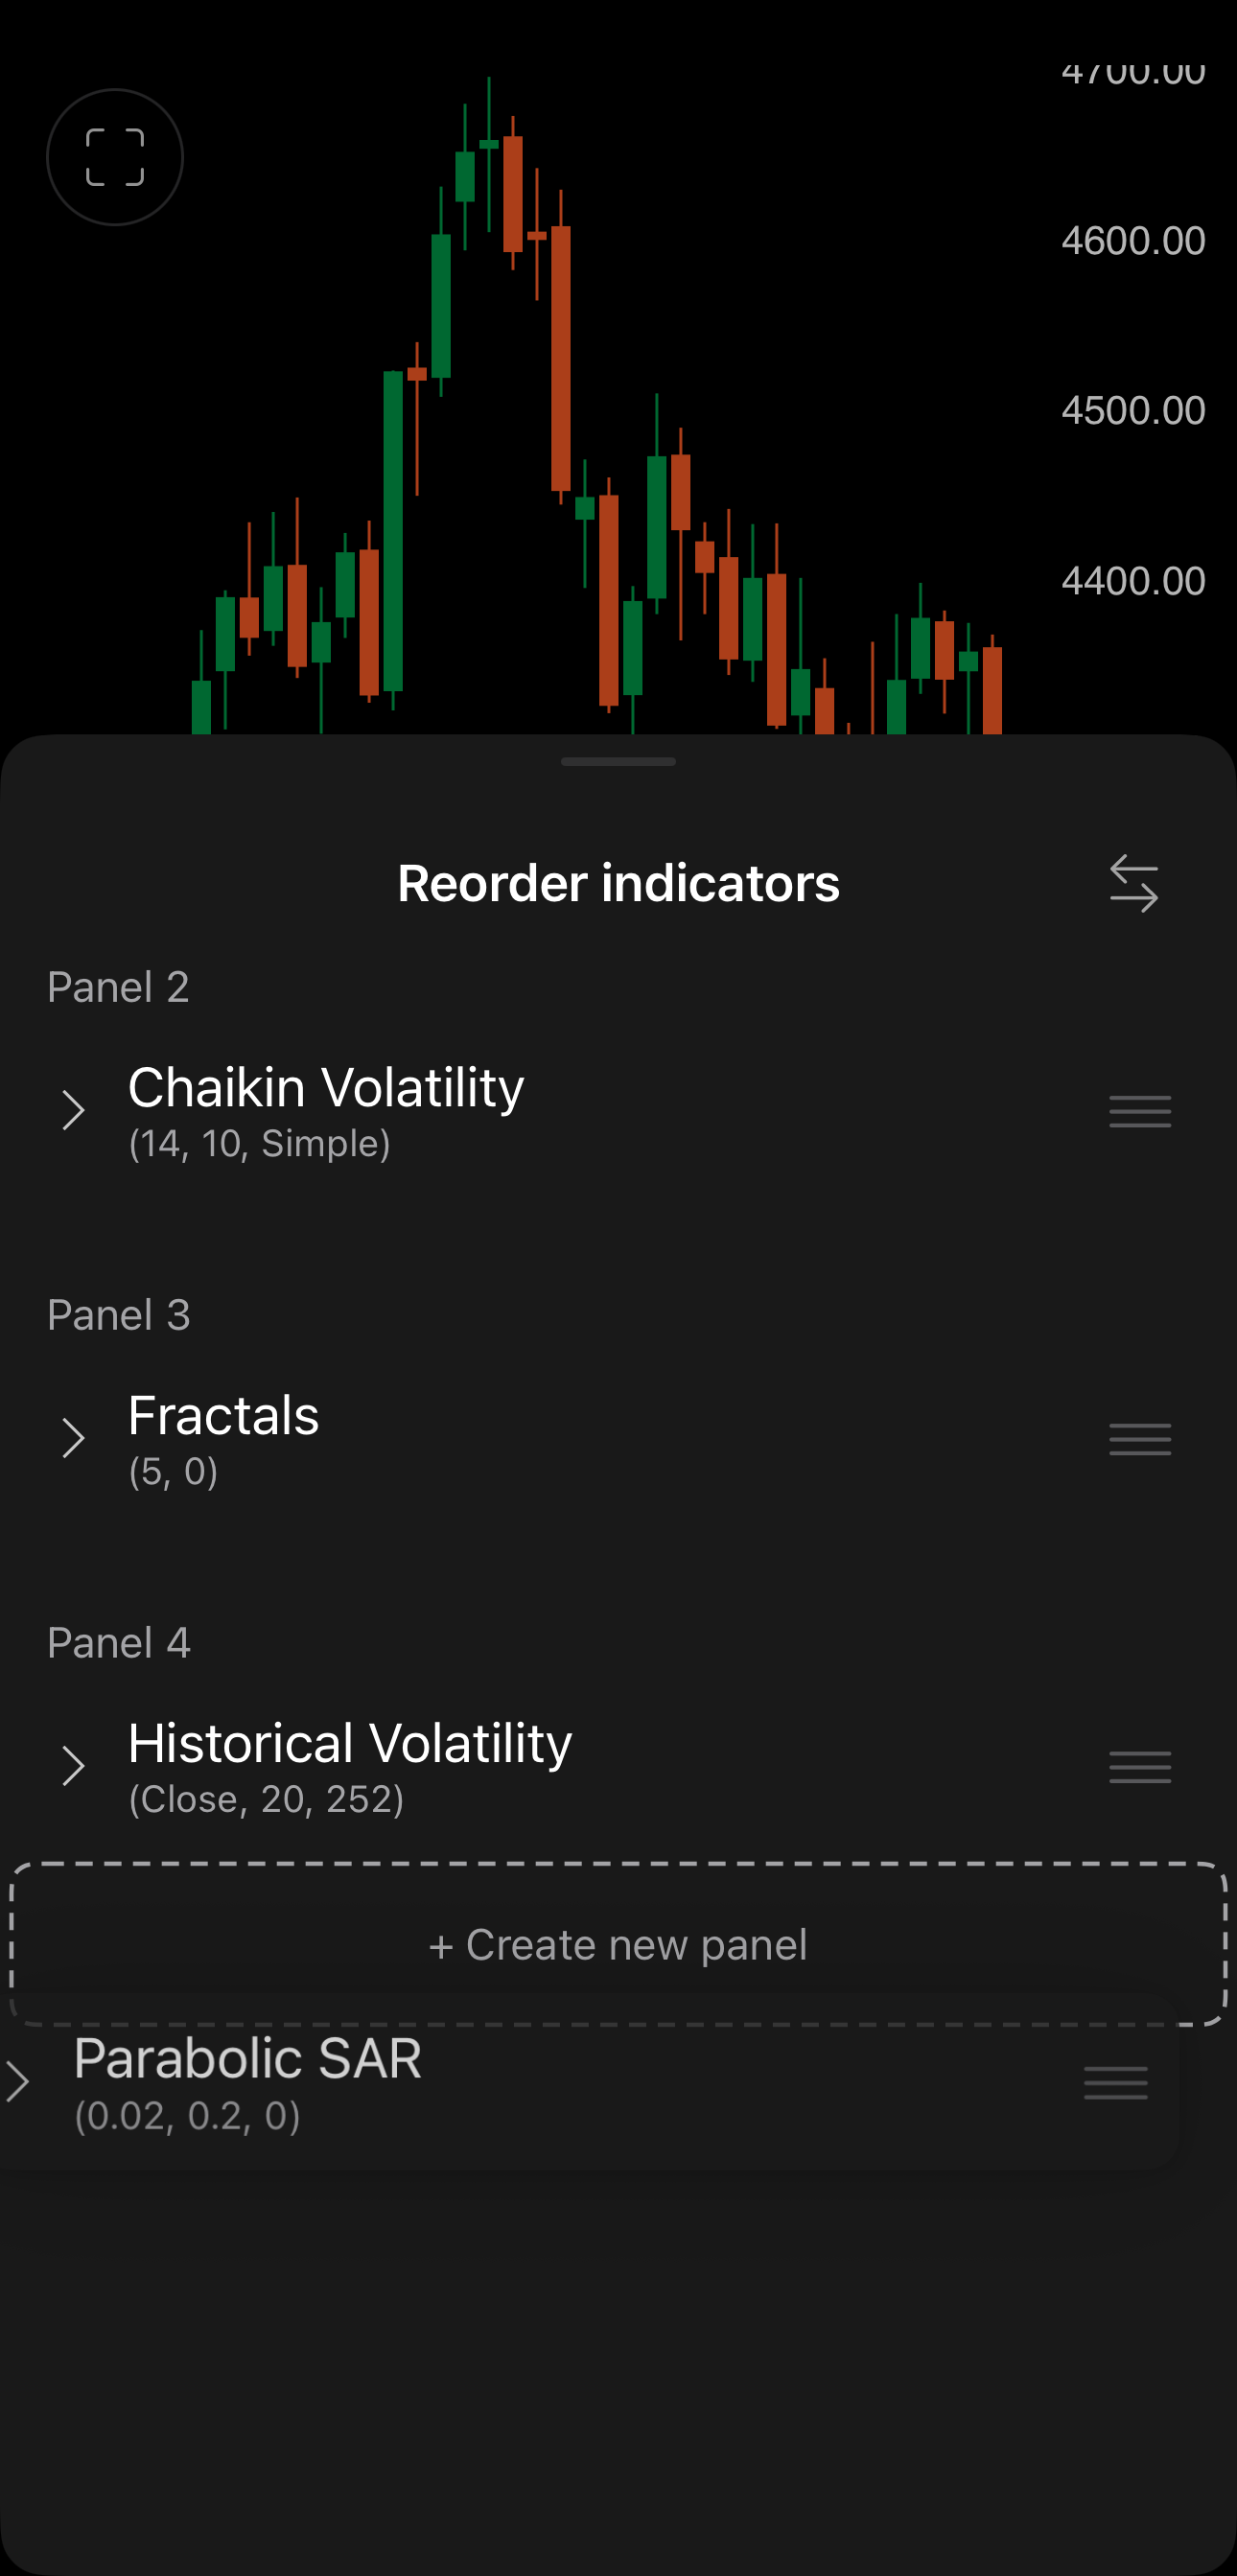
Drag an entry by its grip into another group to move the indicator there, onto + Create new panel at the foot to give it a panel of its own, or back to On chart to draw it over the candles. Emptying a panel removes it, and the panels below renumber.
Crosshair
The crosshair marks a point on the chart and reports its price and time. Long-tap the chart to raise it, or tap in the chart toolbar.
Drag to move the crosshair. Its price and time are labelled on the axes in its own colour, and the open, high, low and close of the bar beneath it appear in the upper-left corner.
Tap Measure at the foot of the chart to compare two points. A second crosshair appears, each keeping its own colour on the axes, and a label between them reports the distance in pips and periods. The label updates as you drag.
Tap in the upper-left corner to leave the crosshair.