Chart settings
Chart settings control how the chart is coloured, how drawings behave and what is shown on the chart. Tap in the chart toolbar to open them. They apply to every chart, including the chart preview in the symbol overview.
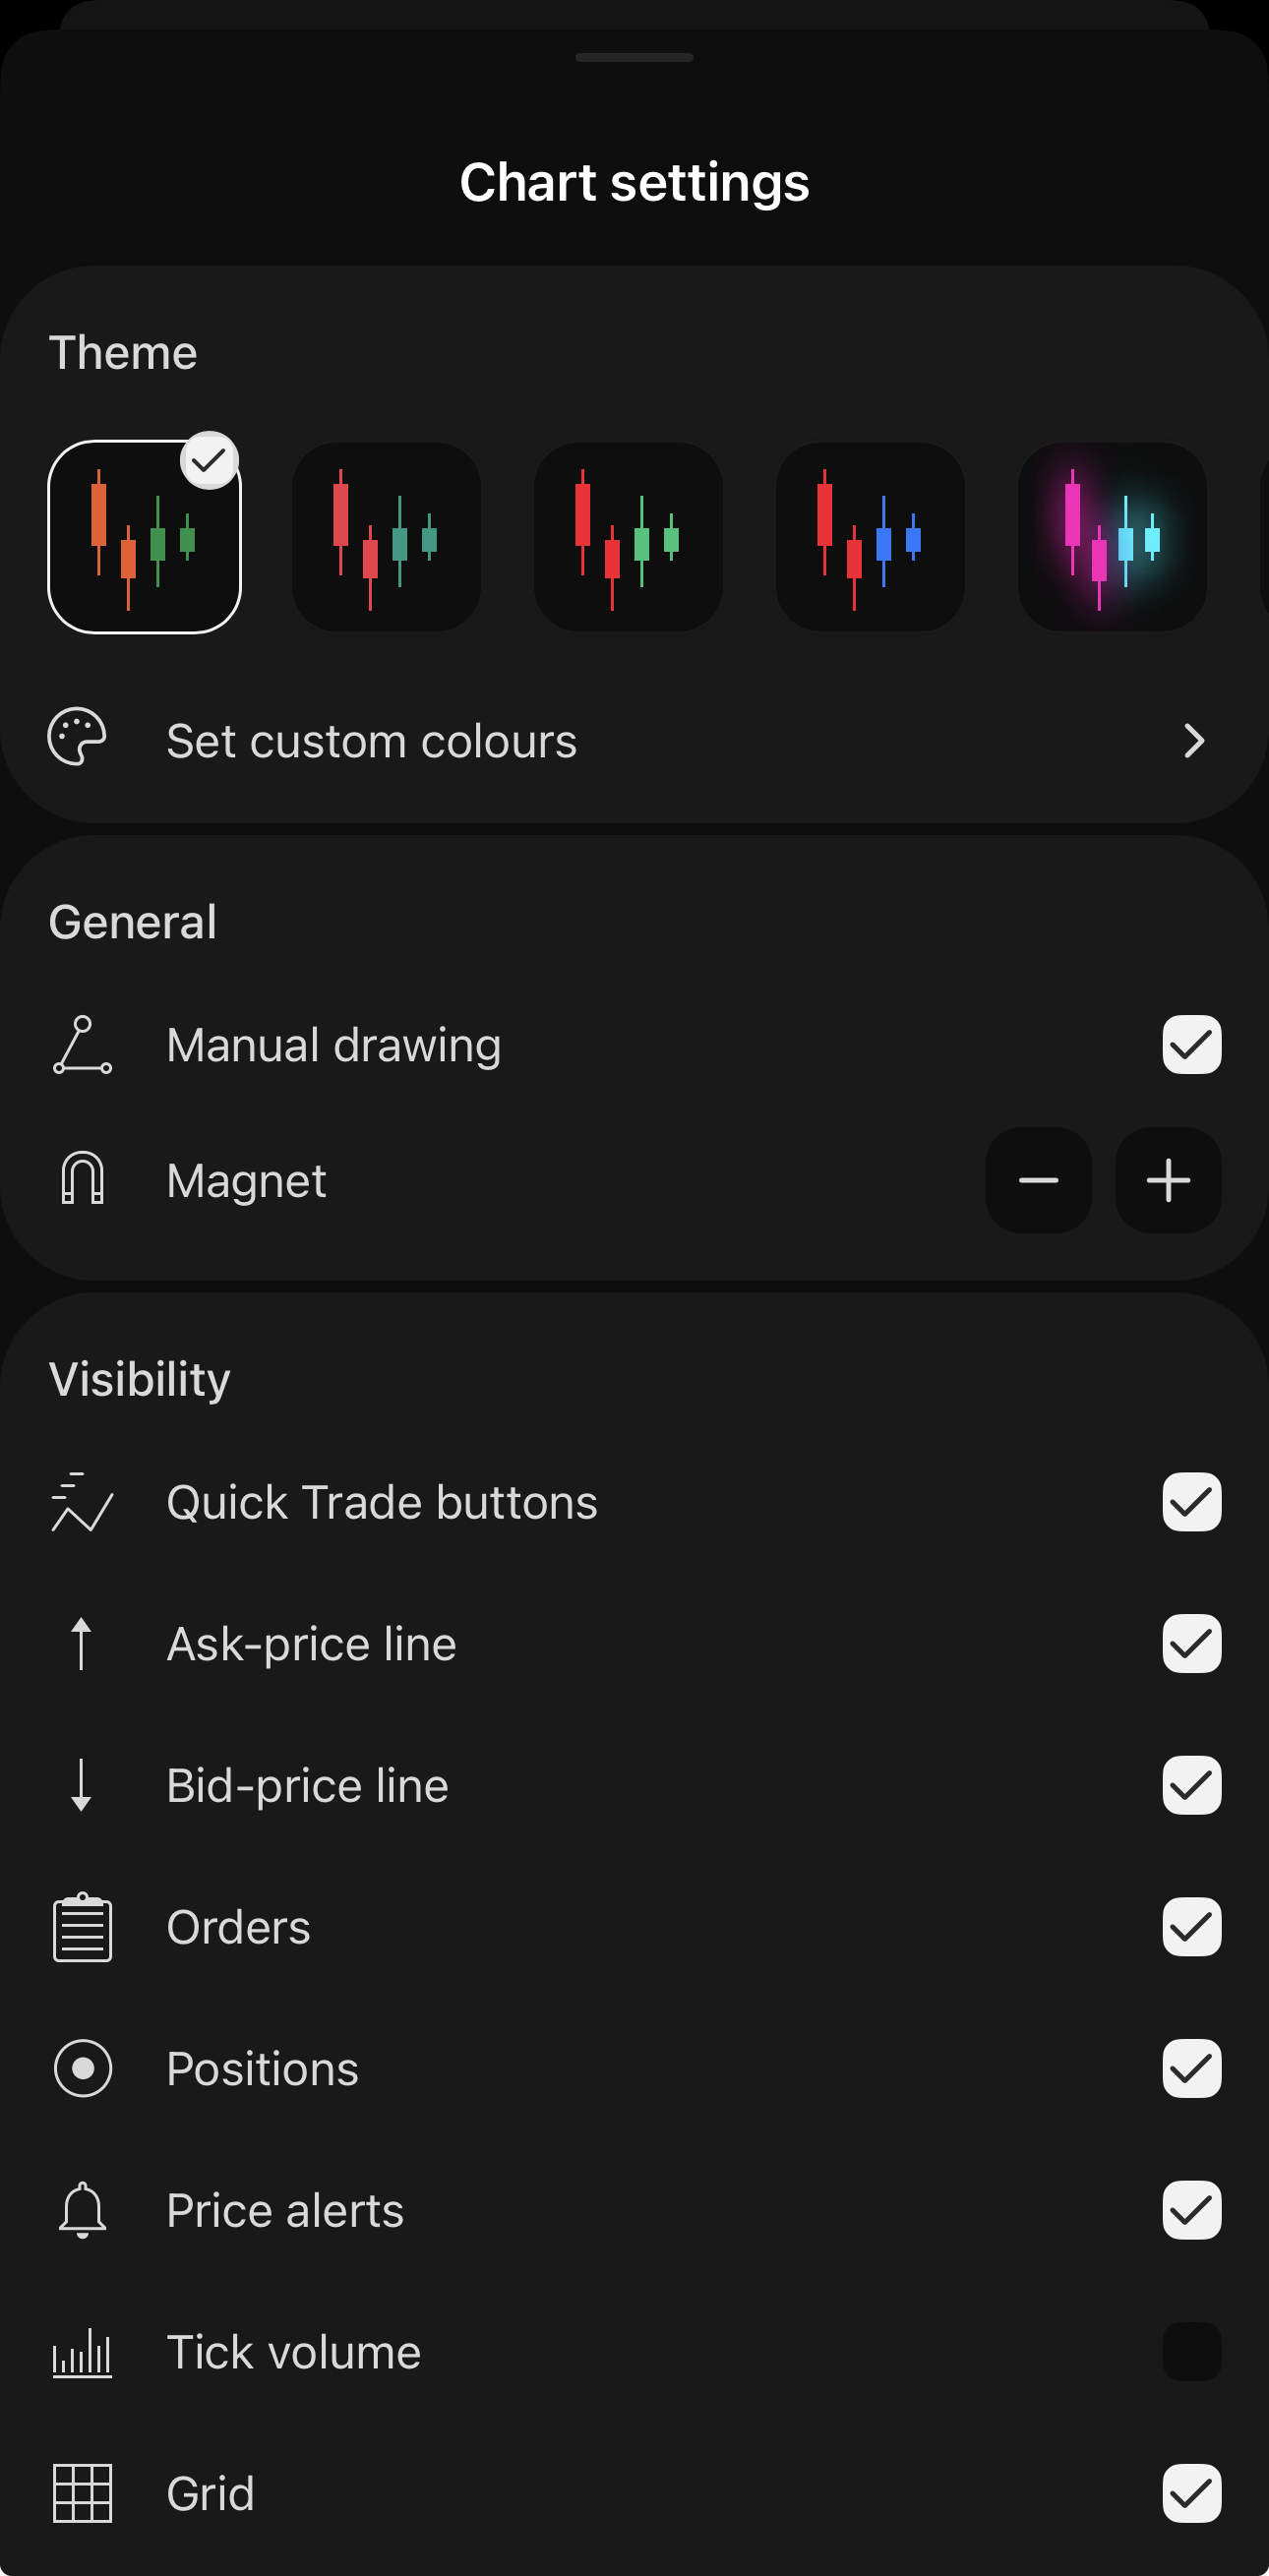
Theme
Eight colour schemes set how the candles and the background are drawn. Tap one to apply it, or tap Set custom colours to build your own.
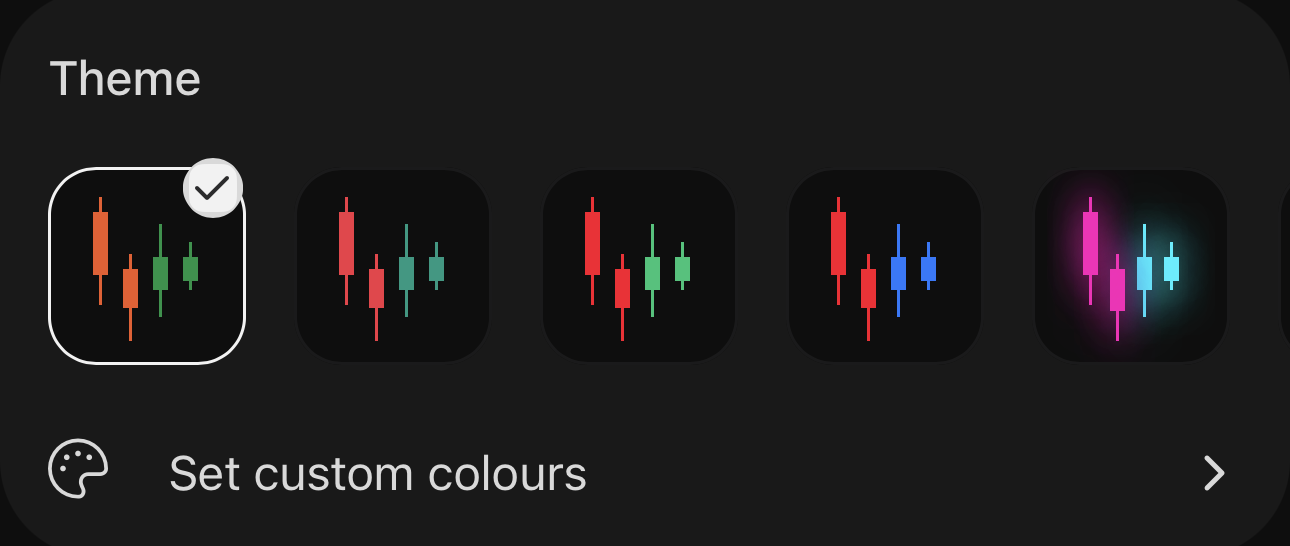
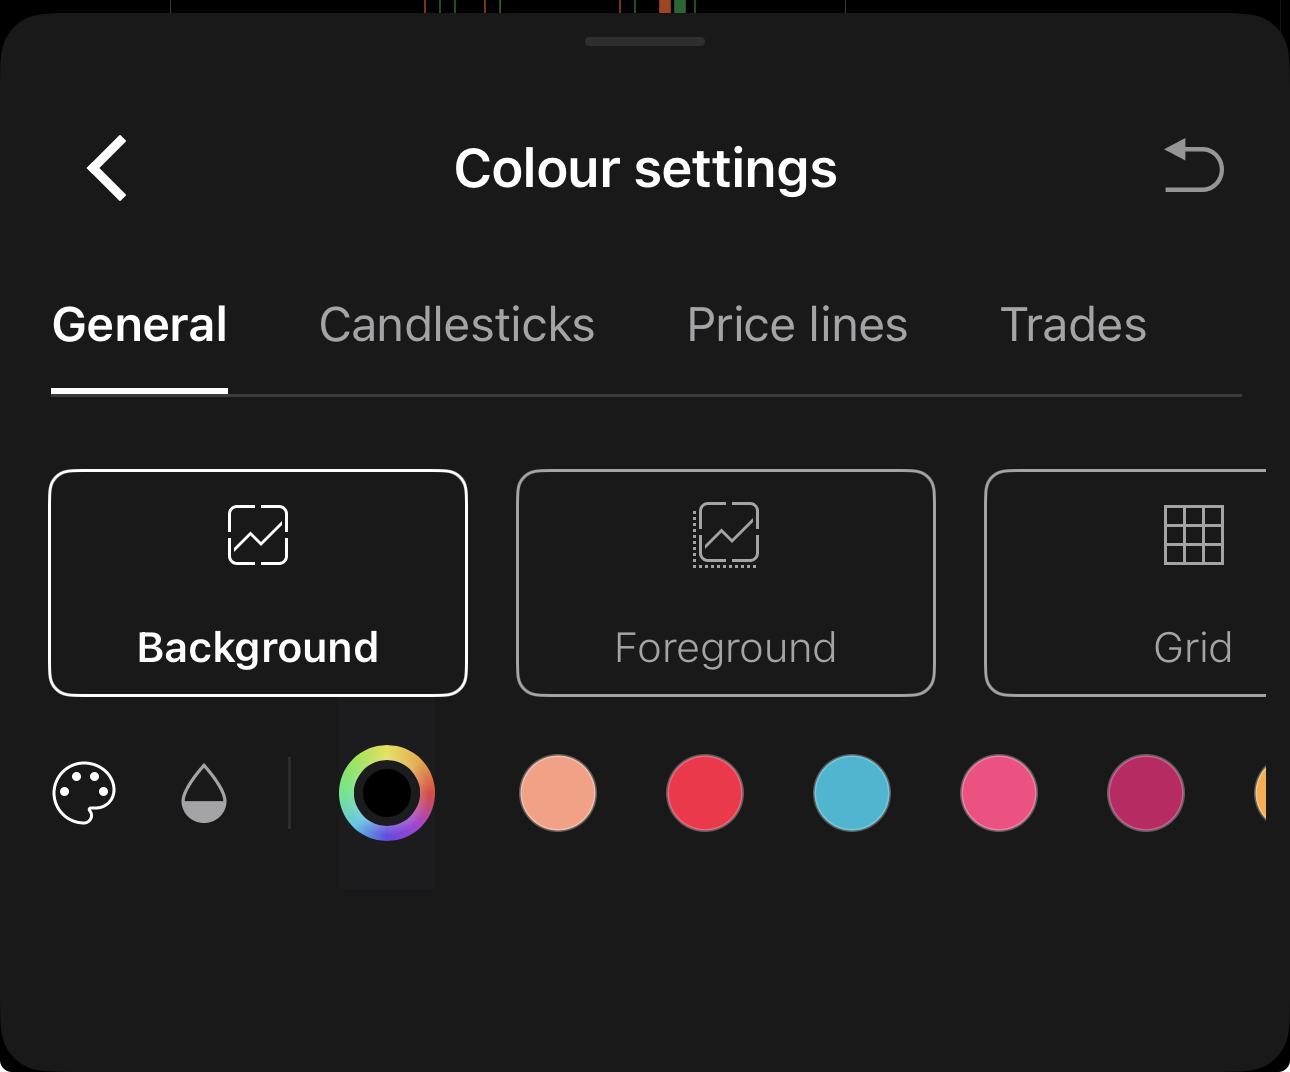
Colour settings recolours the chart one element at a time. The elements sit under tabs:
- Background – the colour behind the chart.
- Foreground – the axis labels and readouts drawn over it.
- Grid – the horizontal and vertical gridlines.
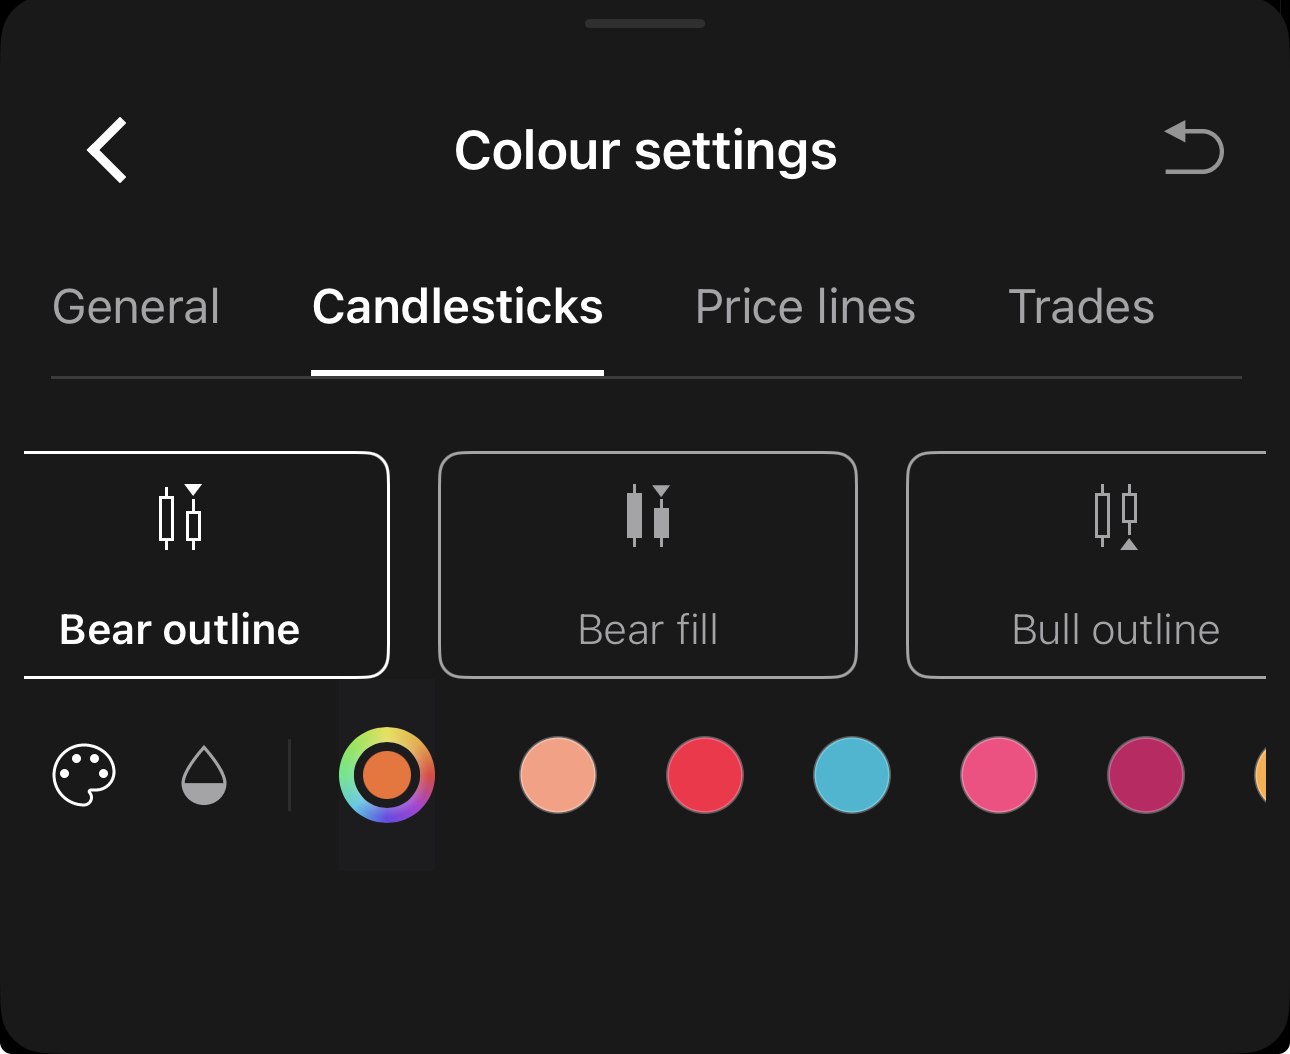
- Bear outline and Bear fill – the edge and the body of a falling candle.
- Bull outline and Bull fill – the edge and the body of a rising candle.
Setting outline and fill separately lets a falling candle be hollow and a rising one solid.
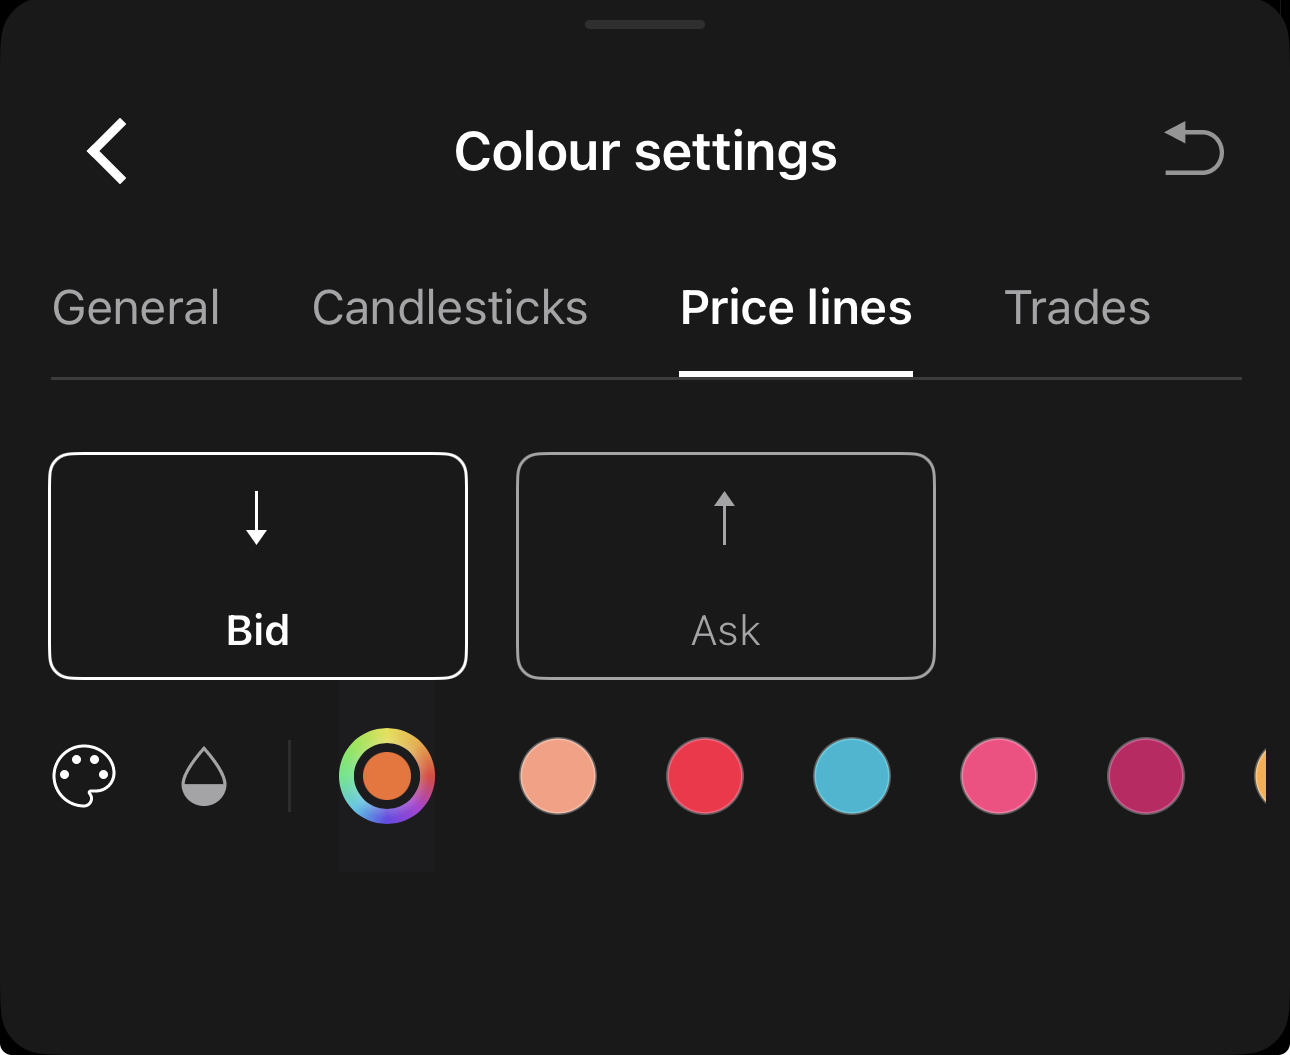
- Bid – the live bid price line.
- Ask – the live ask price line.
Switch either line on and off under Visibility.
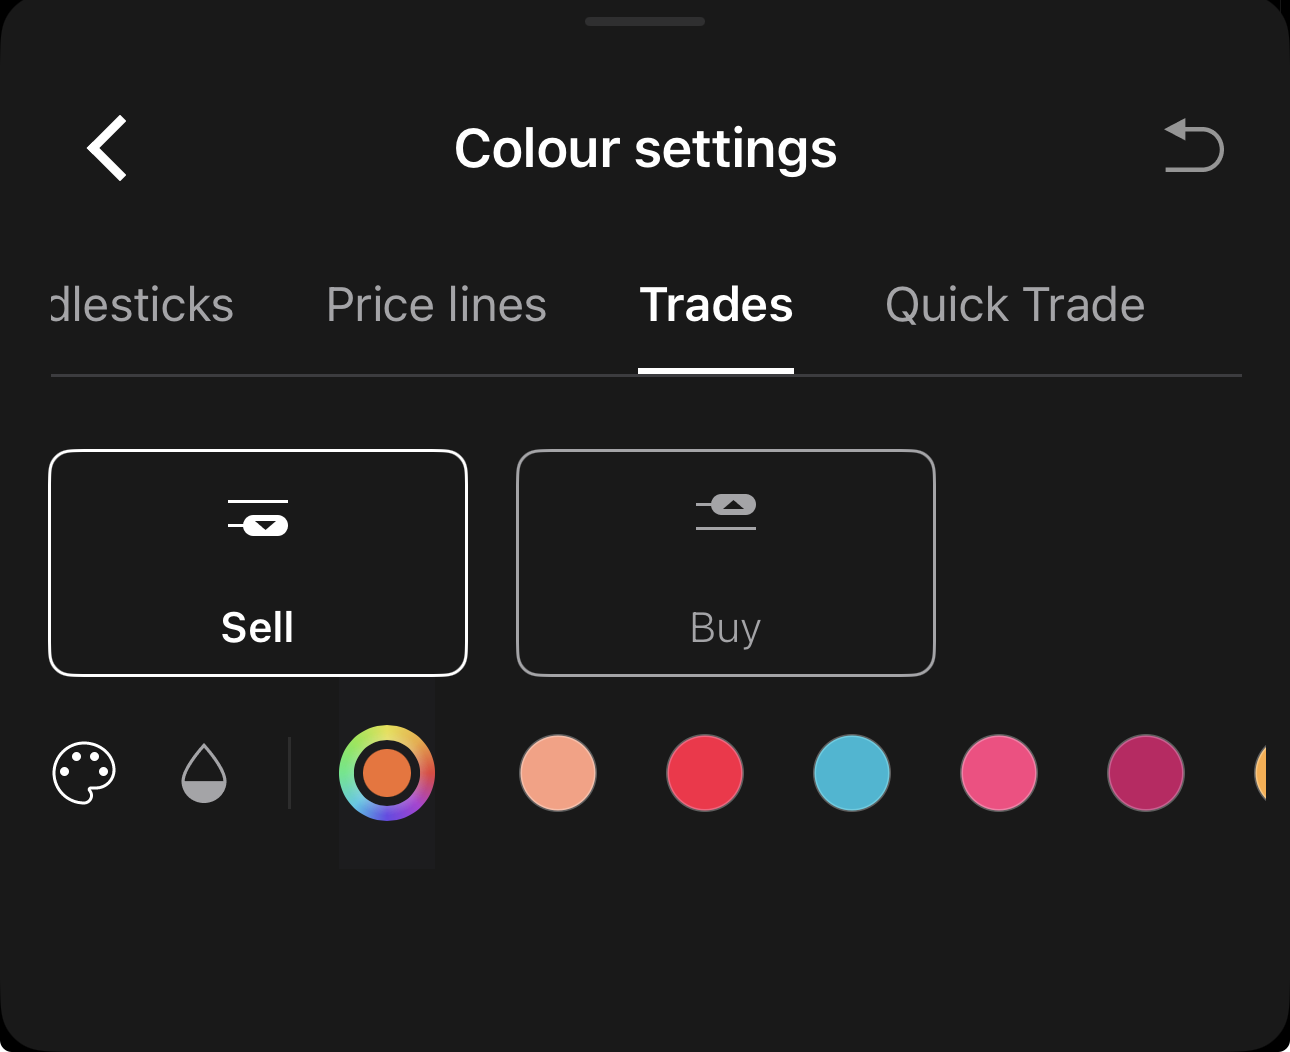
- Sell – the colour of your sell positions and orders.
- Buy – the colour of your buy positions and orders.
Sell and Buy for Quick Trade.
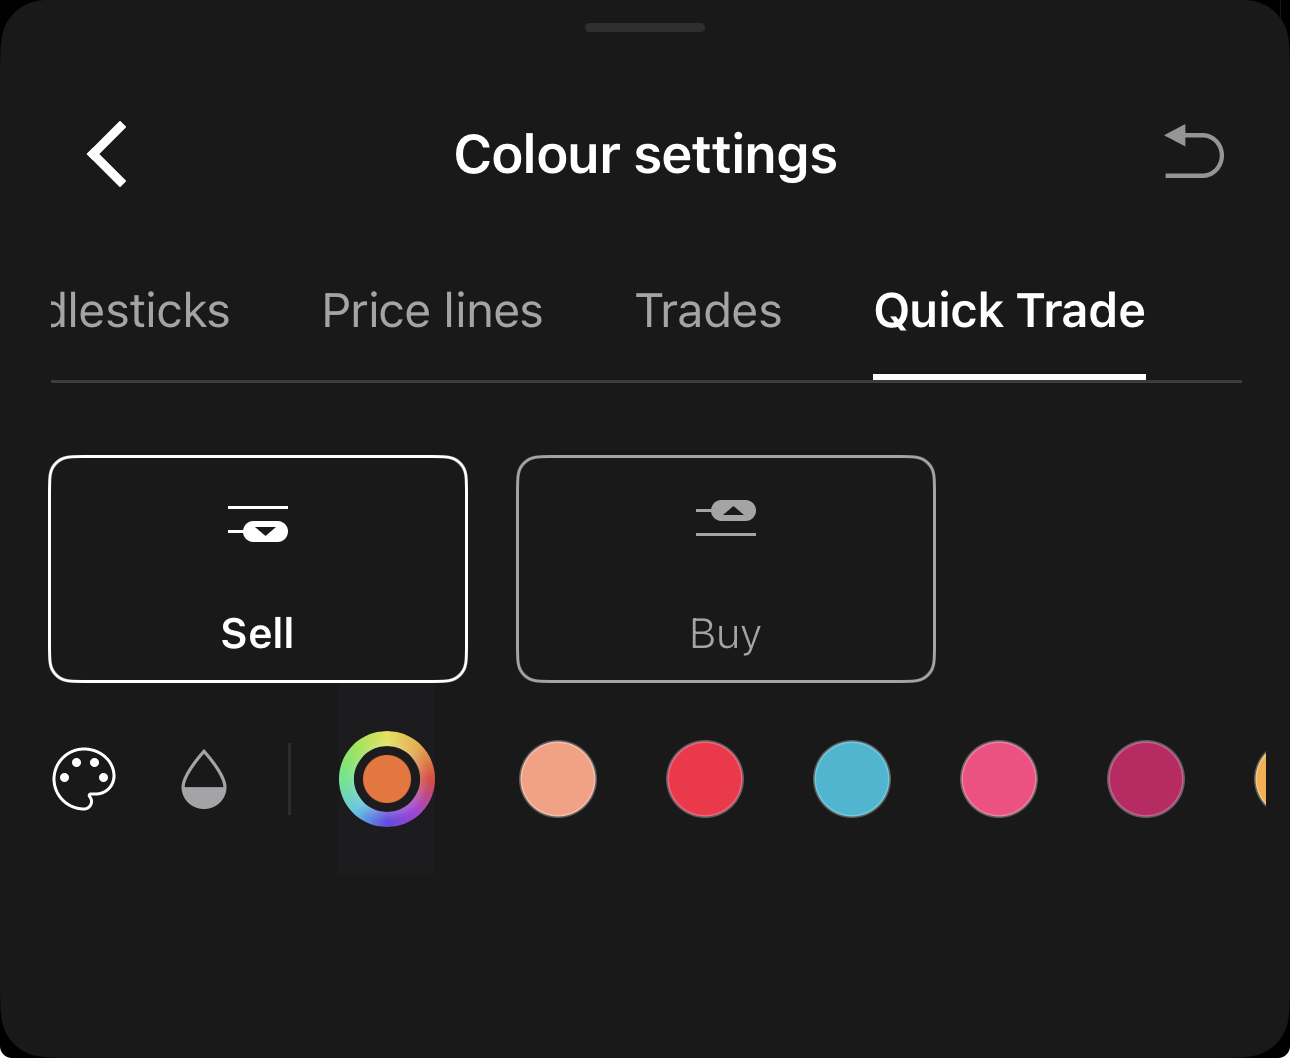
Tap the element you want to change, then set it with the two controls beneath:
- – the colour itself. Use the wheel to pick any colour, or take one of the preset swatches beside it.
- – the opacity, as a percentage. A low opacity makes a candle body hollow, or lets a marker sit over the price without hiding it.
in the upper-right corner puts the settings back to default.
General
Two settings that change how drawings behave.
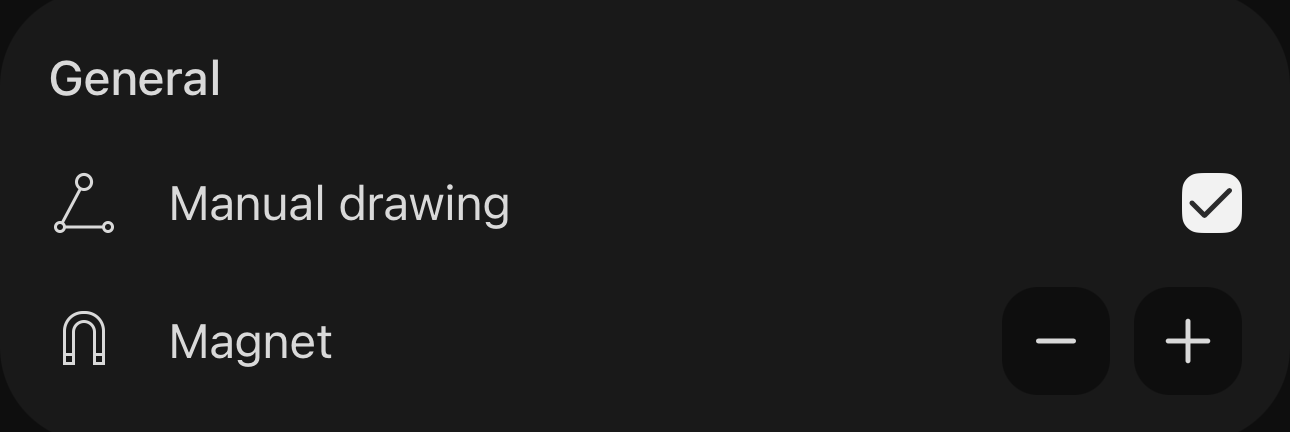
Manual drawing
When on, you tap out the drawing point by point: a trend line takes two taps, a pitchfork three. When off, one tap drops the whole drawing at a default size, ready to drag into place, which is quicker on a small screen.
Note
Vertical and Horizontal lines ignore the setting, having only one point to place.
Magnet
Snaps a drawing to nearby price points, so a line lands on the high instead of just above it. Turn it off to place drawings freely.
Set the strength with and , from no magnet ( ) to a strong one ( ). The icon shows the current setting.
Visibility
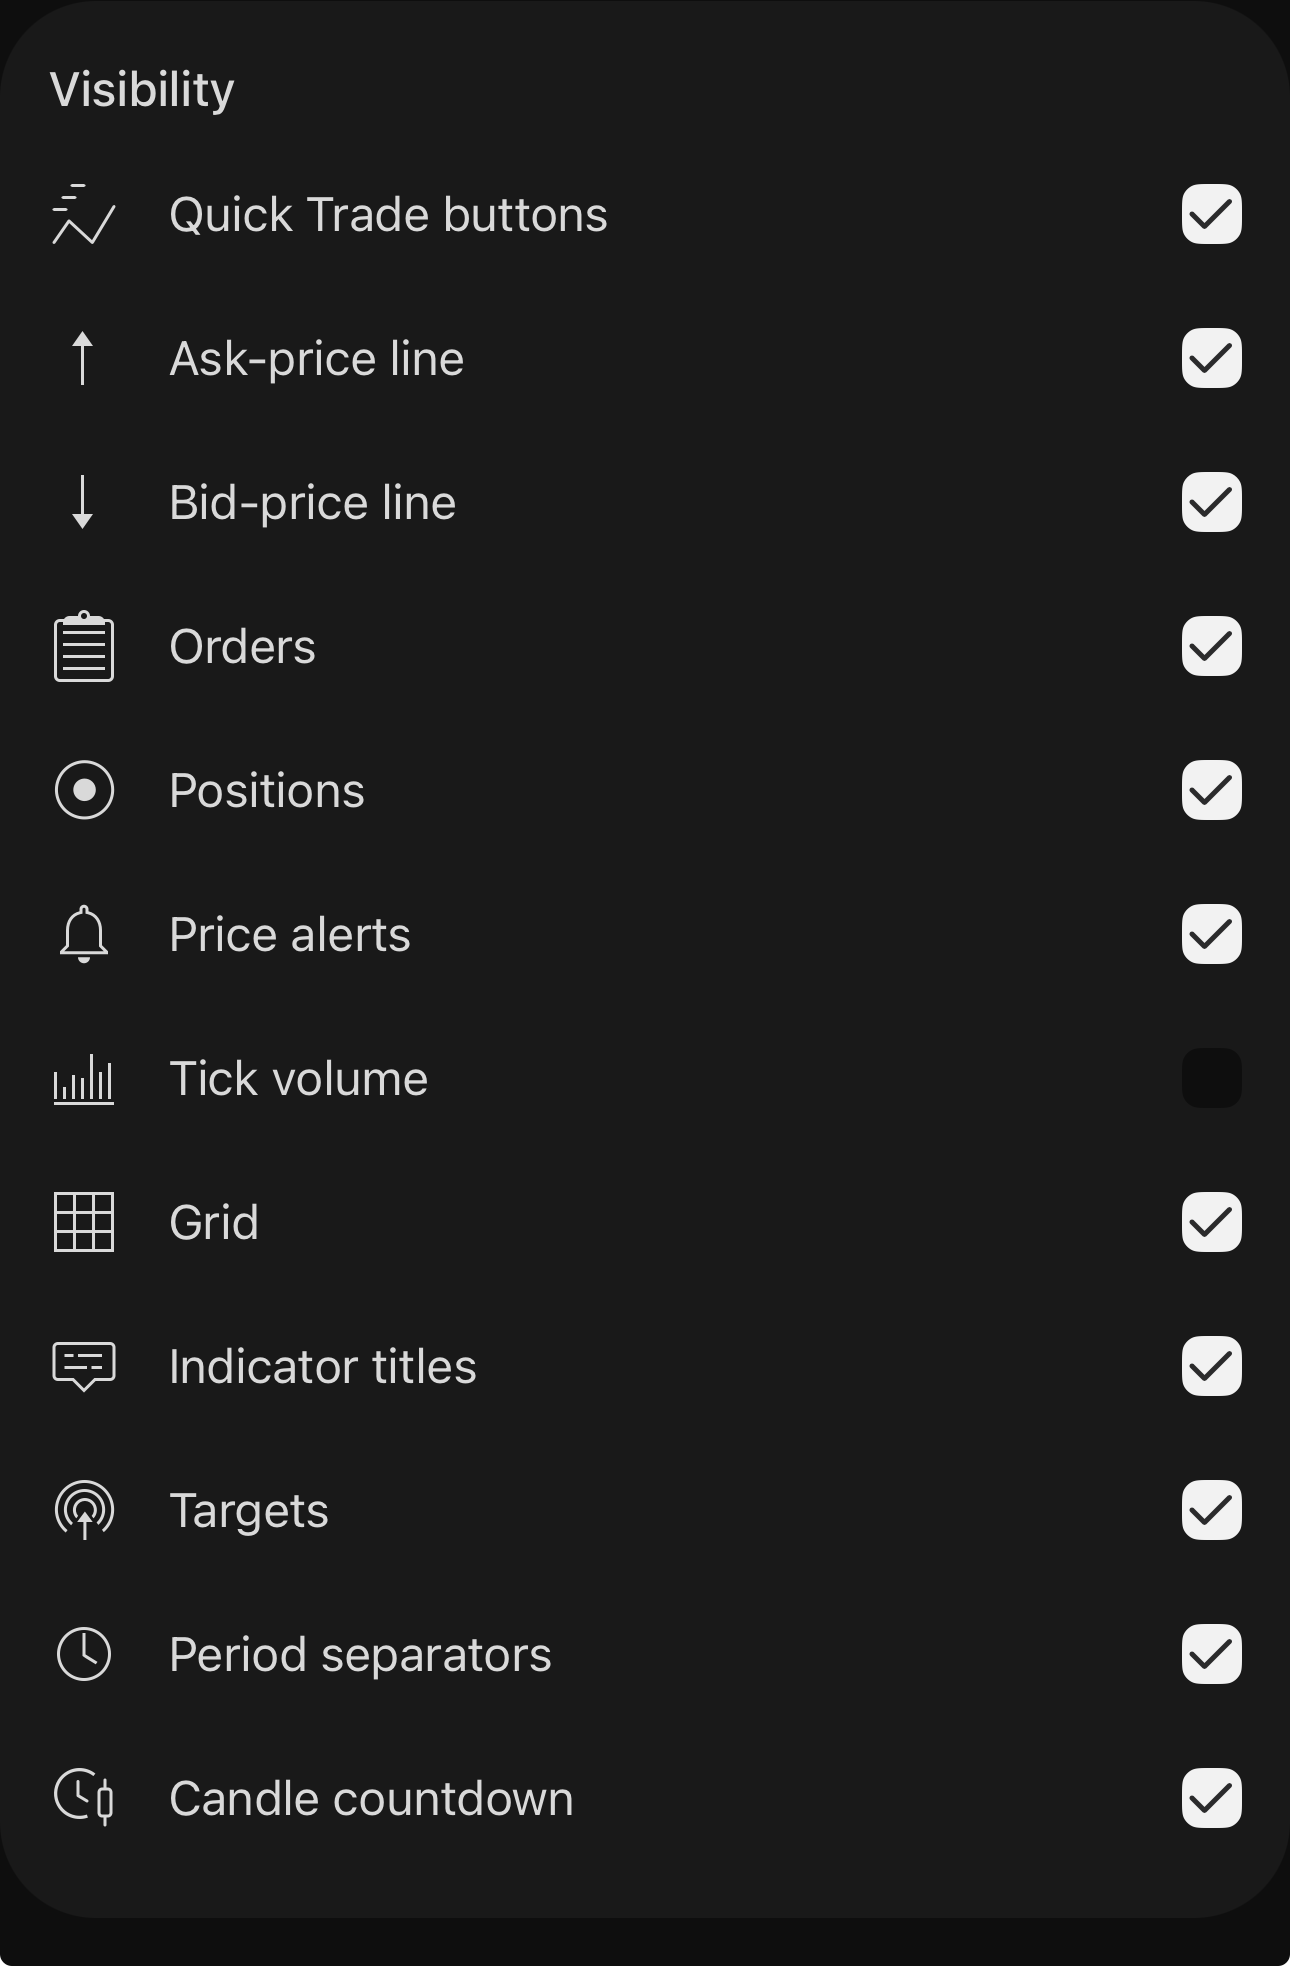
Clear a checkbox to hide an element without removing it. The chart draws each of these besides the price itself:
- Quick Trade buttons – the Sell and Buy buttons across the foot of the chart. See Quick Trade.
- Ask-price line – a line at the live ask price.
- Bid-price line – a line at the live bid price.
- Orders – your pending orders for the symbol, as order controls.
- Positions – your open positions for the symbol, as position controls.
- Price alerts – your price alerts for the symbol, as alert controls.
- Tick volume – volume bars along the bottom of the chart. Off by default.
- Grid – the gridlines behind the price.
- Indicator titles – the name and parameters of each indicator, such as ASI (12), above its plot.
- Targets – the price targets from Trading Central analysis.
- Period separators – vertical lines marking where one period ends and the next begins.
- Candle countdown – the time left before the current bar closes, at the foot of the price axis.