Blotter
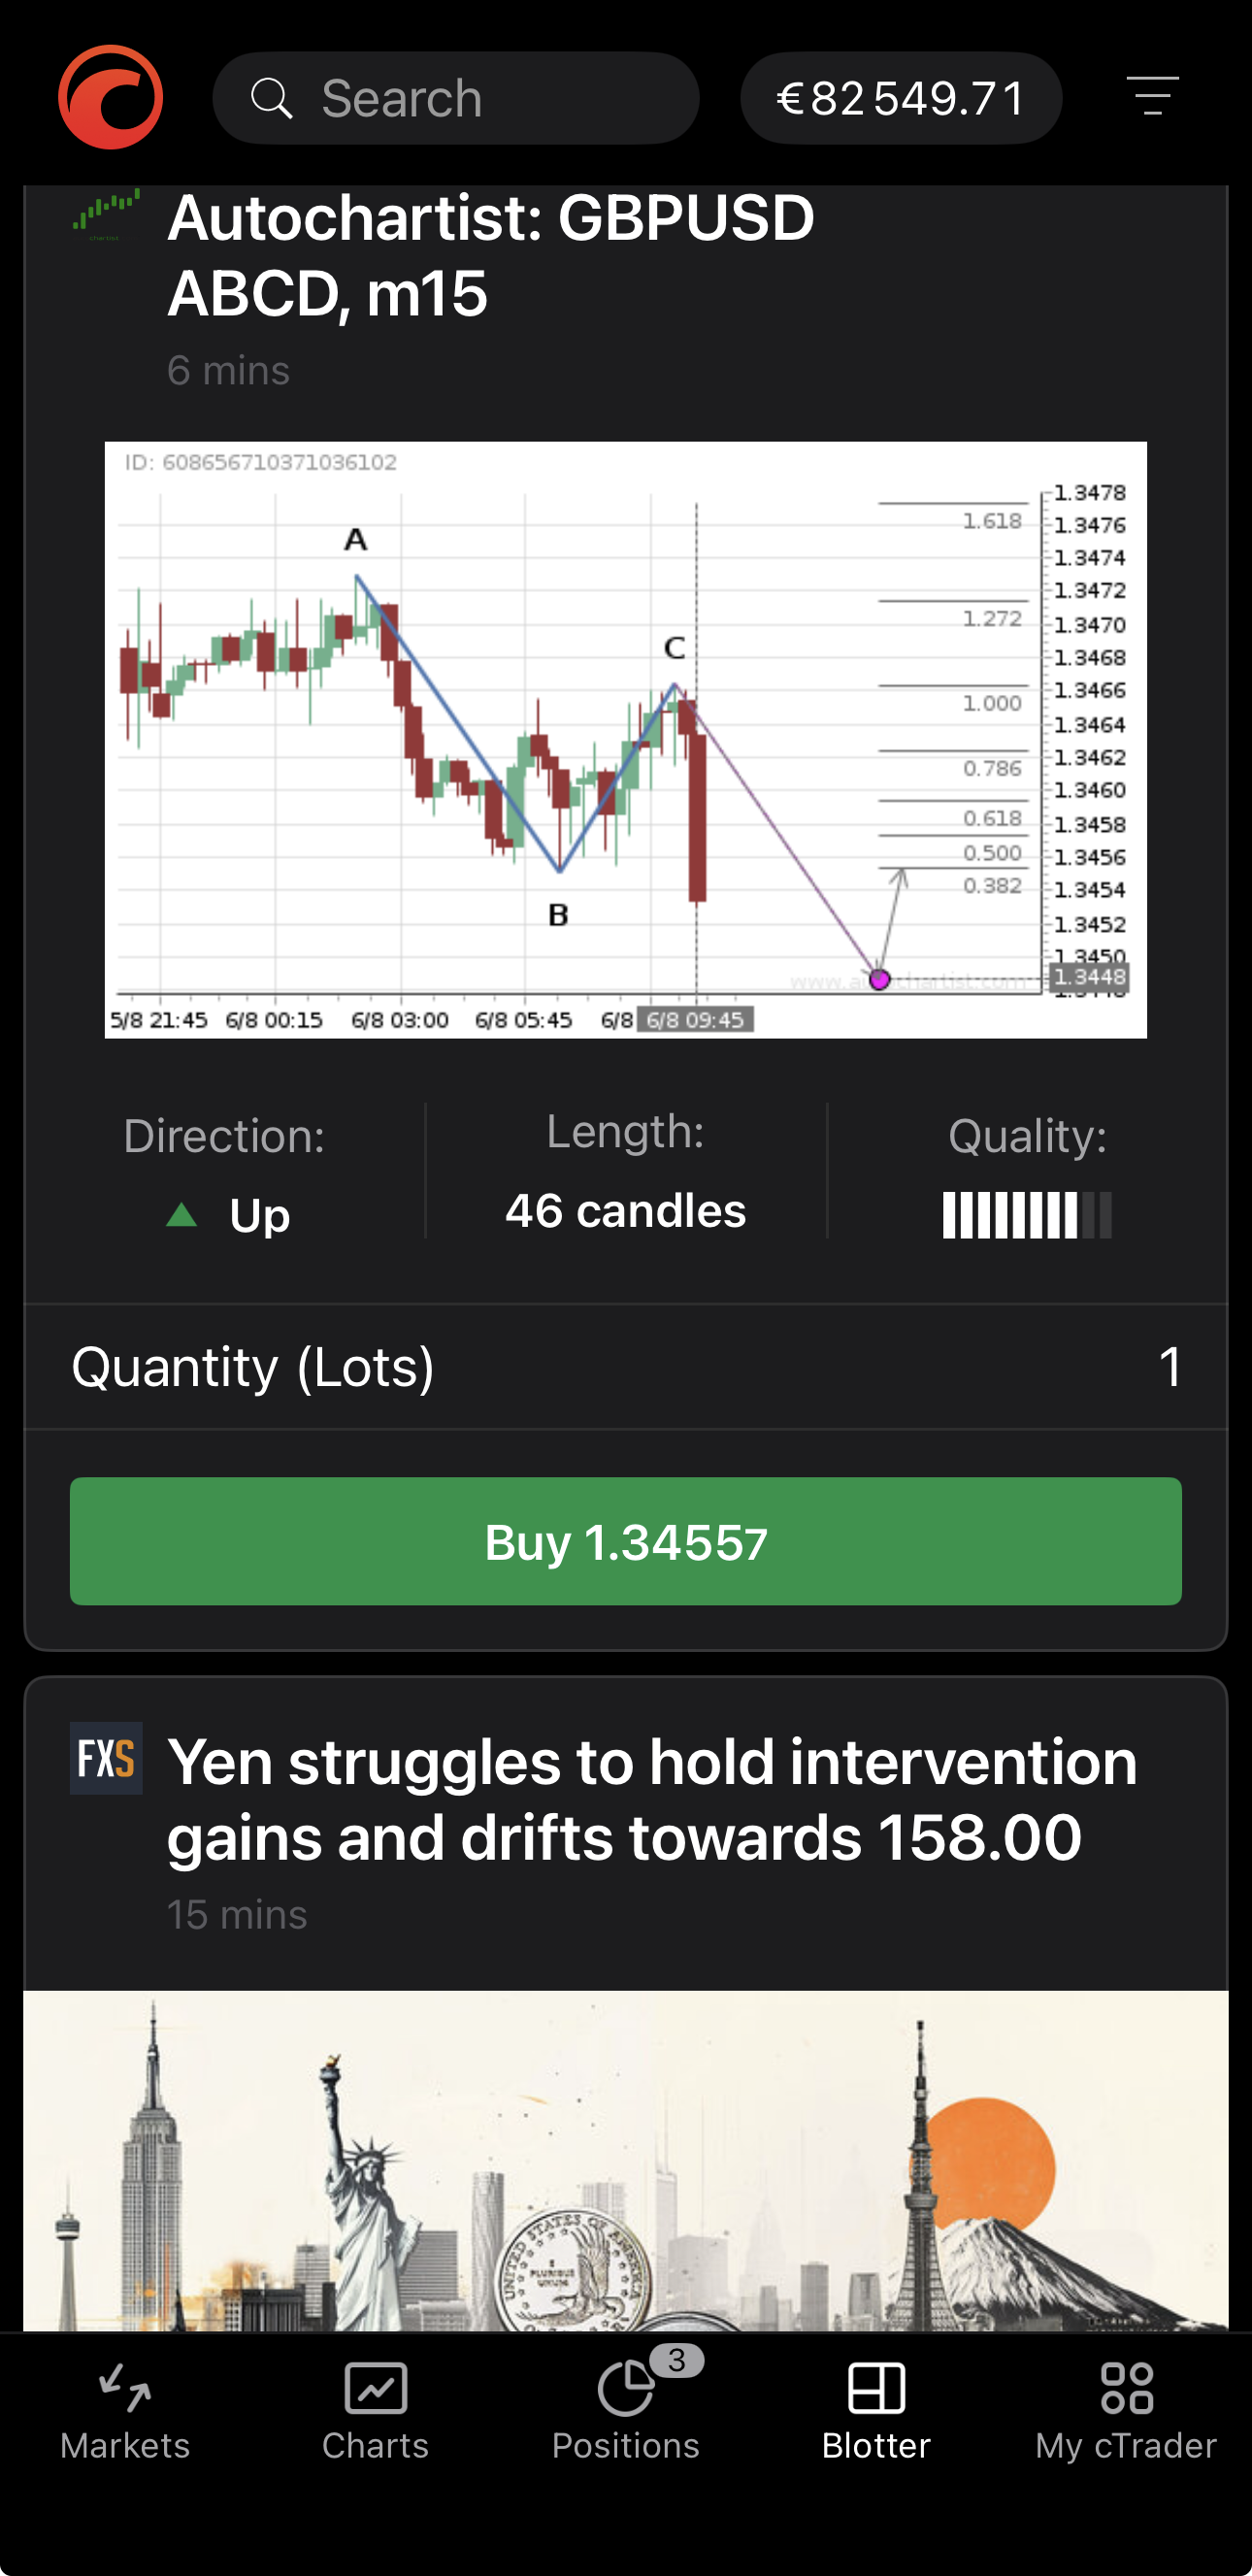
Blotter is a customisable app that gathers your account events and market analysis into one feed. Cards are listed newest first, each stamped with how long ago the event arrived.
Event types
The feed carries four groups of events.
- Calendar events – scheduled economic releases and their figures.
- Autochartist – chart patterns Autochartist has recognised, with a trade button.
- Trading Central – Trading Central's price targets, with a trade button.
- Financial news – FXStreet articles on the markets.
- Crypto news – articles on cryptocurrencies.
- Broker messages – announcements from the brokers you hold accounts with.
- Login – a sign-in with your cTrader ID.
- Account opened – a new trading account on your cTrader ID.
Warning
Autochartist and Trading Central are third-party research providers, not cTrader or your broker. Their signals should not be taken as investment advice, and trading one from its card places a real market order on your active account.
Filter the feed
Tap in the top bar for Event filter. It covers the four groups in Event types.
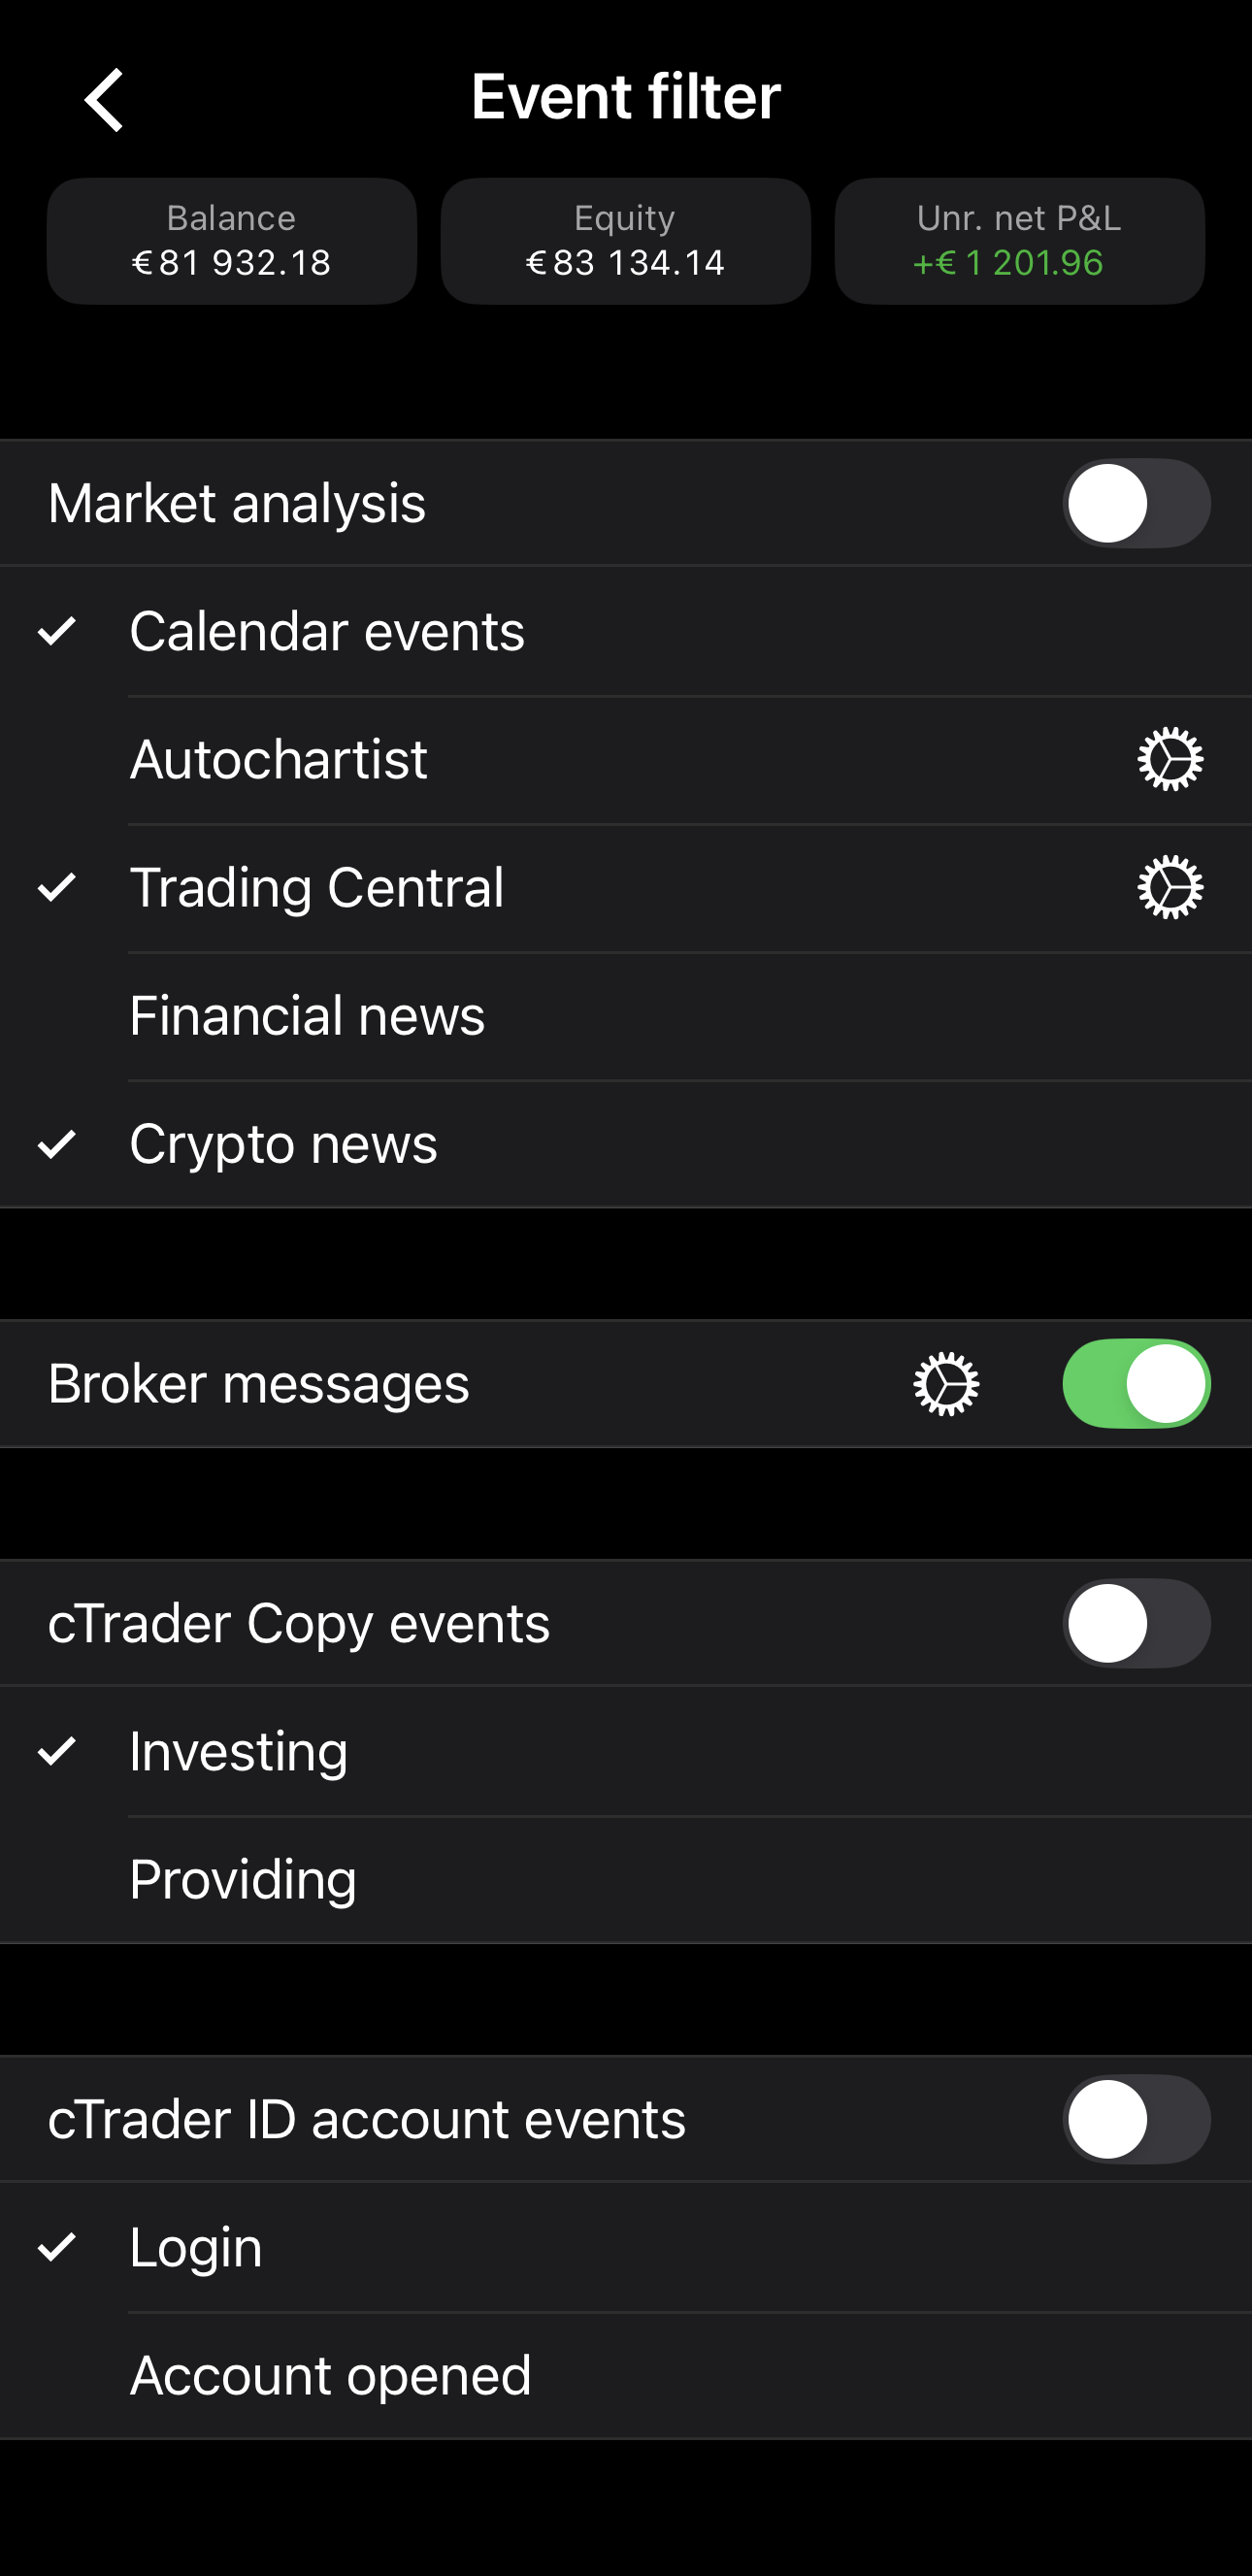
Each group has a master switch turning the whole group off, and the event types inside it have ticks of their own. A group's ticks survive the switch, so turning the group back on restores the selection you had.
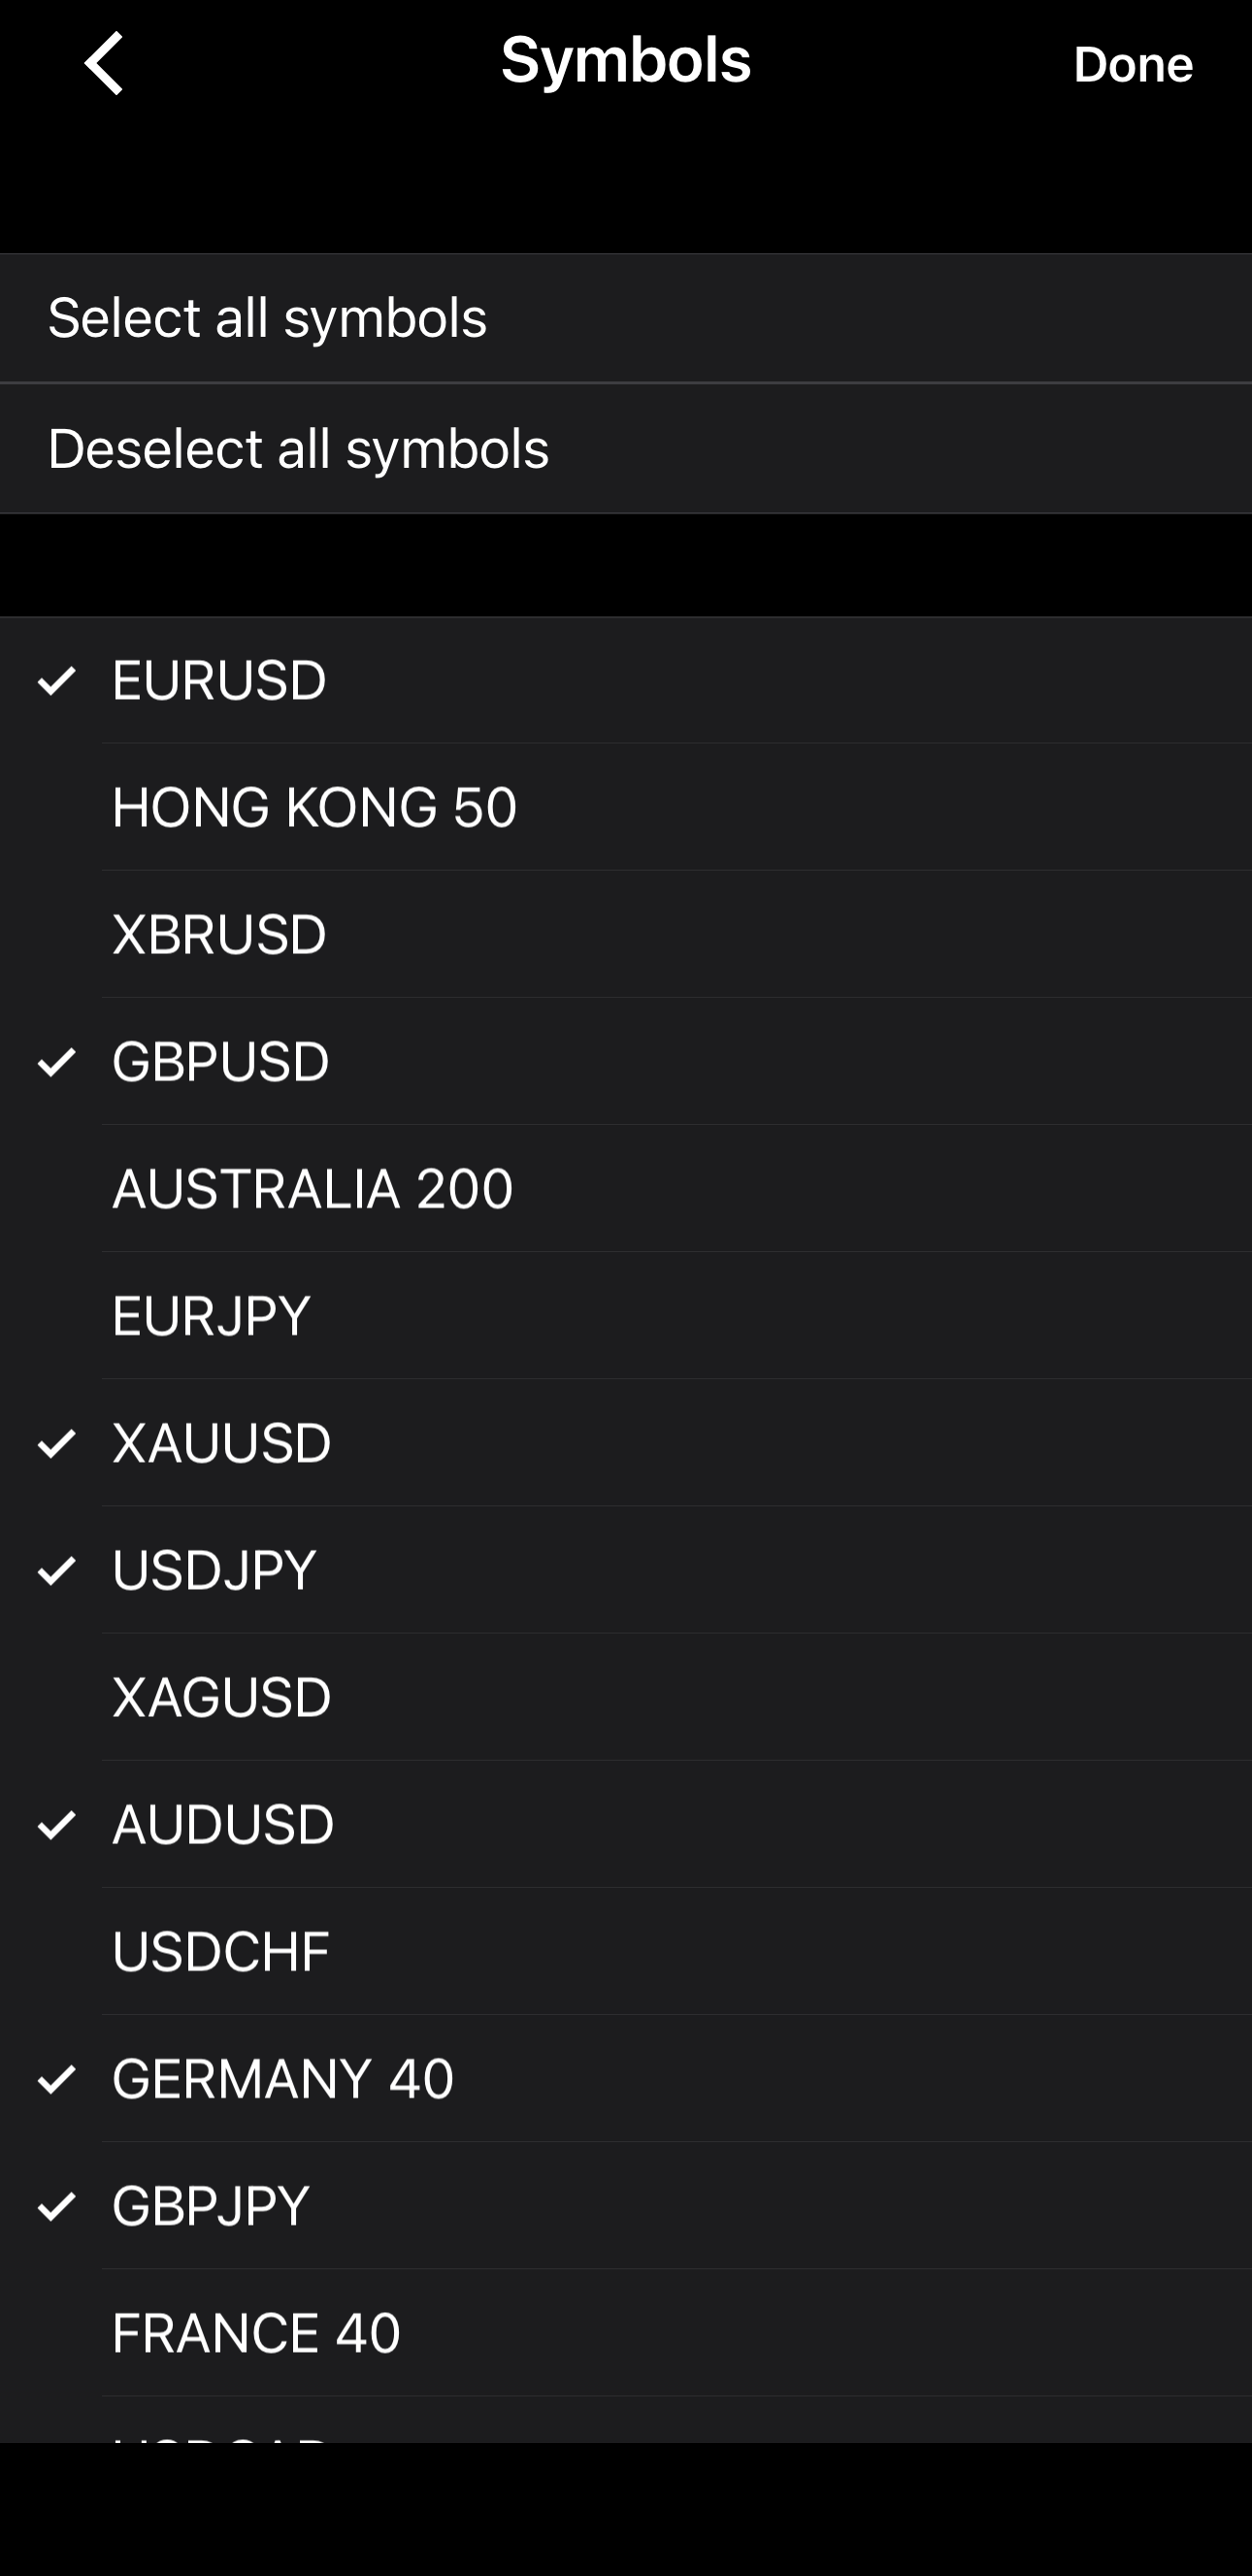
Autochartist, Trading Central and Broker messages carry their own for narrowing the source. A tick marks each entry the feed reports. Tap Done to keep your selection.
Each keeps a Symbols screen of its own. Select all symbols and Deselect all symbols at the top switch the whole list at once.
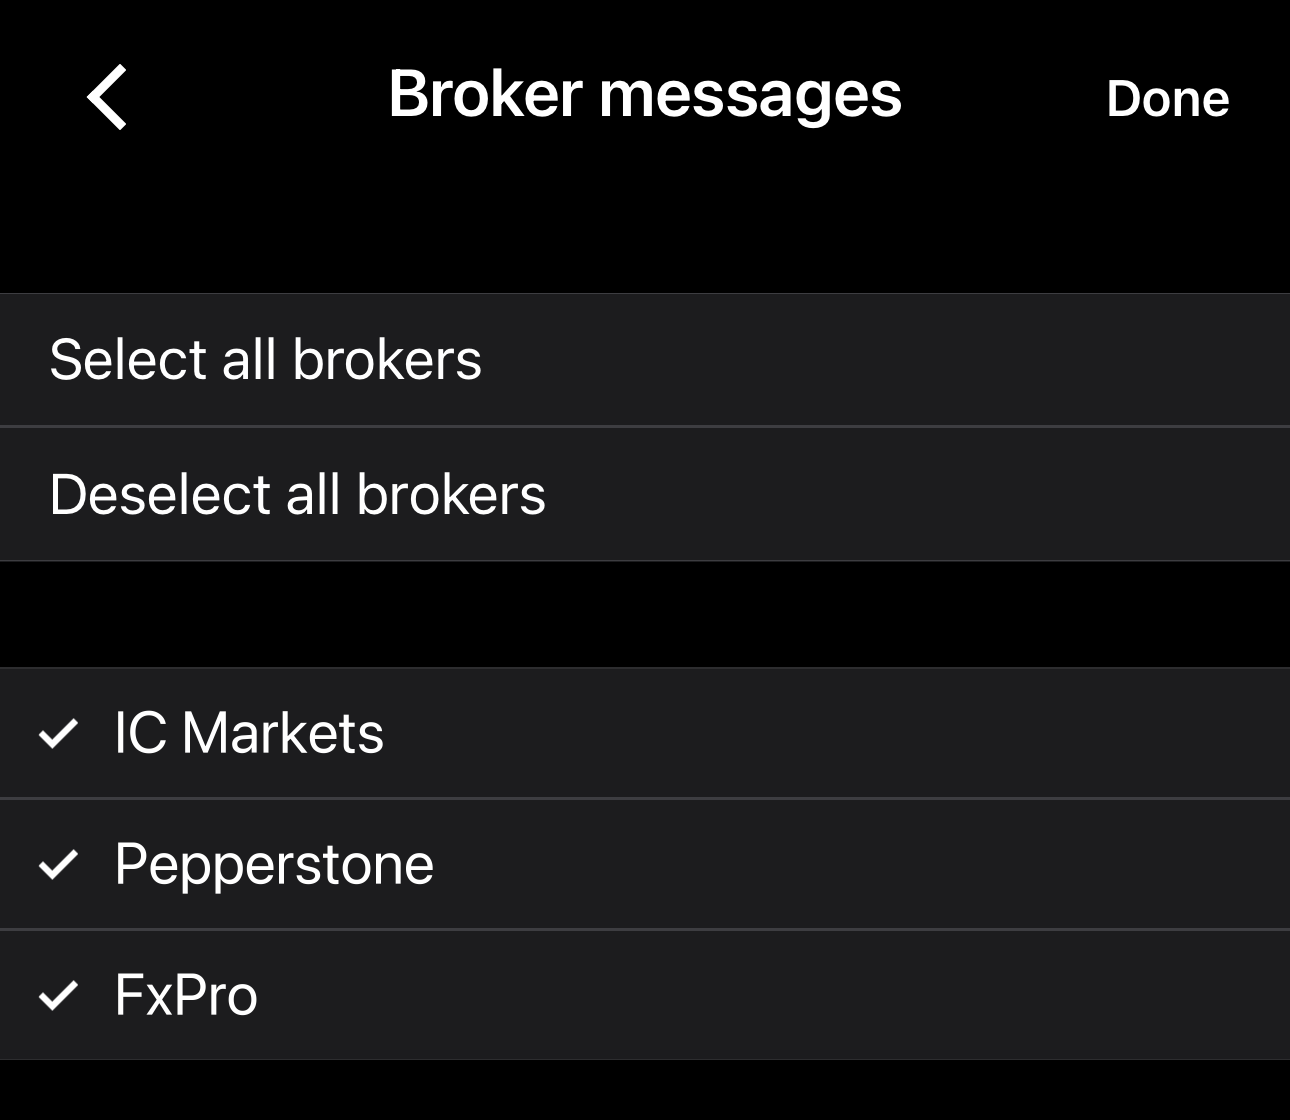
The Broker messages screen lists every broker you hold an account with, so you can choose whose announcements you want. Select all brokers and Deselect all brokers switch the whole list at once.
Note
The sources available depend on your broker. Your filter may hold fewer entries than the list above.
Autochartist signals
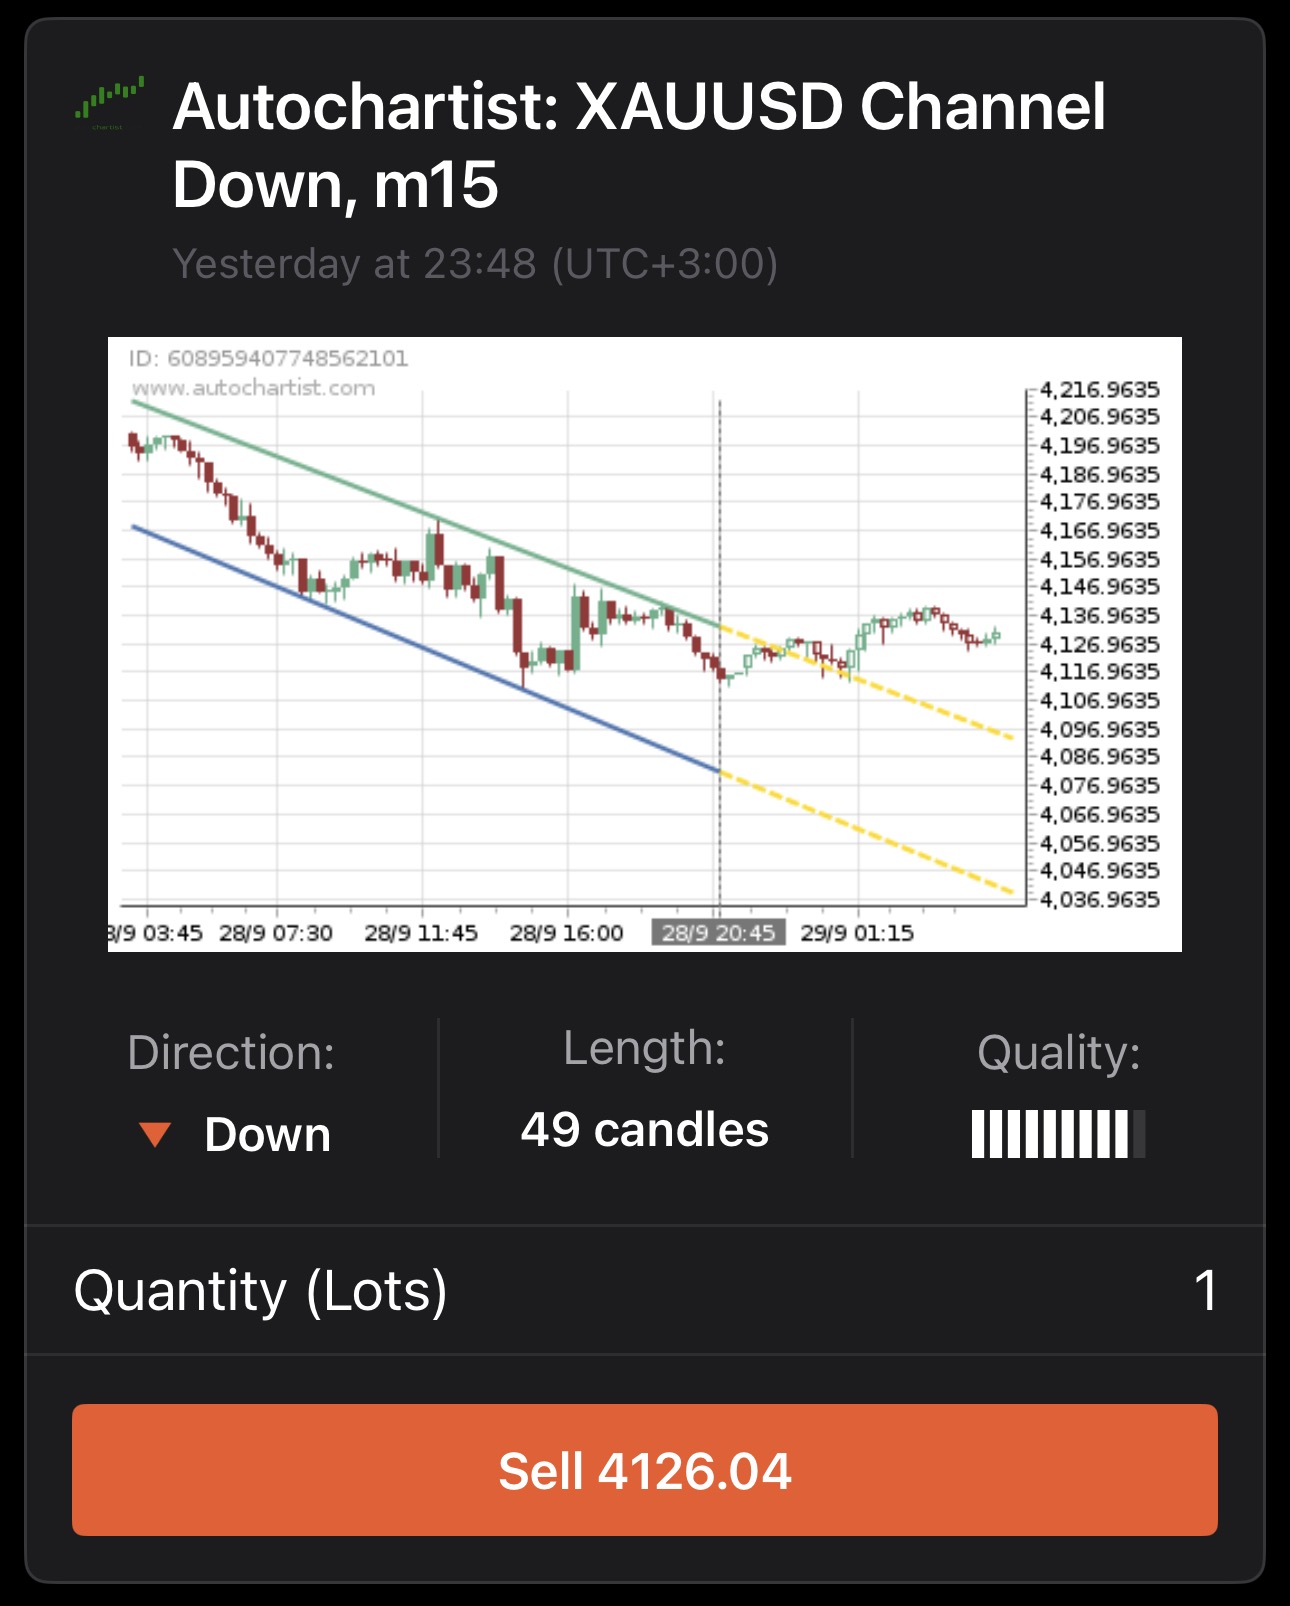
An Autochartist card is headed with the symbol, the pattern name and the interval the pattern was found on. Under the pattern chart it gives:
- Direction – the direction the pattern points, up or down.
- Length – the number of candles the pattern spans.
- Quality – Autochartist's rating of the pattern, drawn as a bar.
Set the trade size in Quantity/Volume and tap the trade button to act on the signal. The button follows the direction of the pattern and carries the current price, so an upward pattern offers Buy and a downward one Sell.
You can also act on a signal from the Pattern details screen.
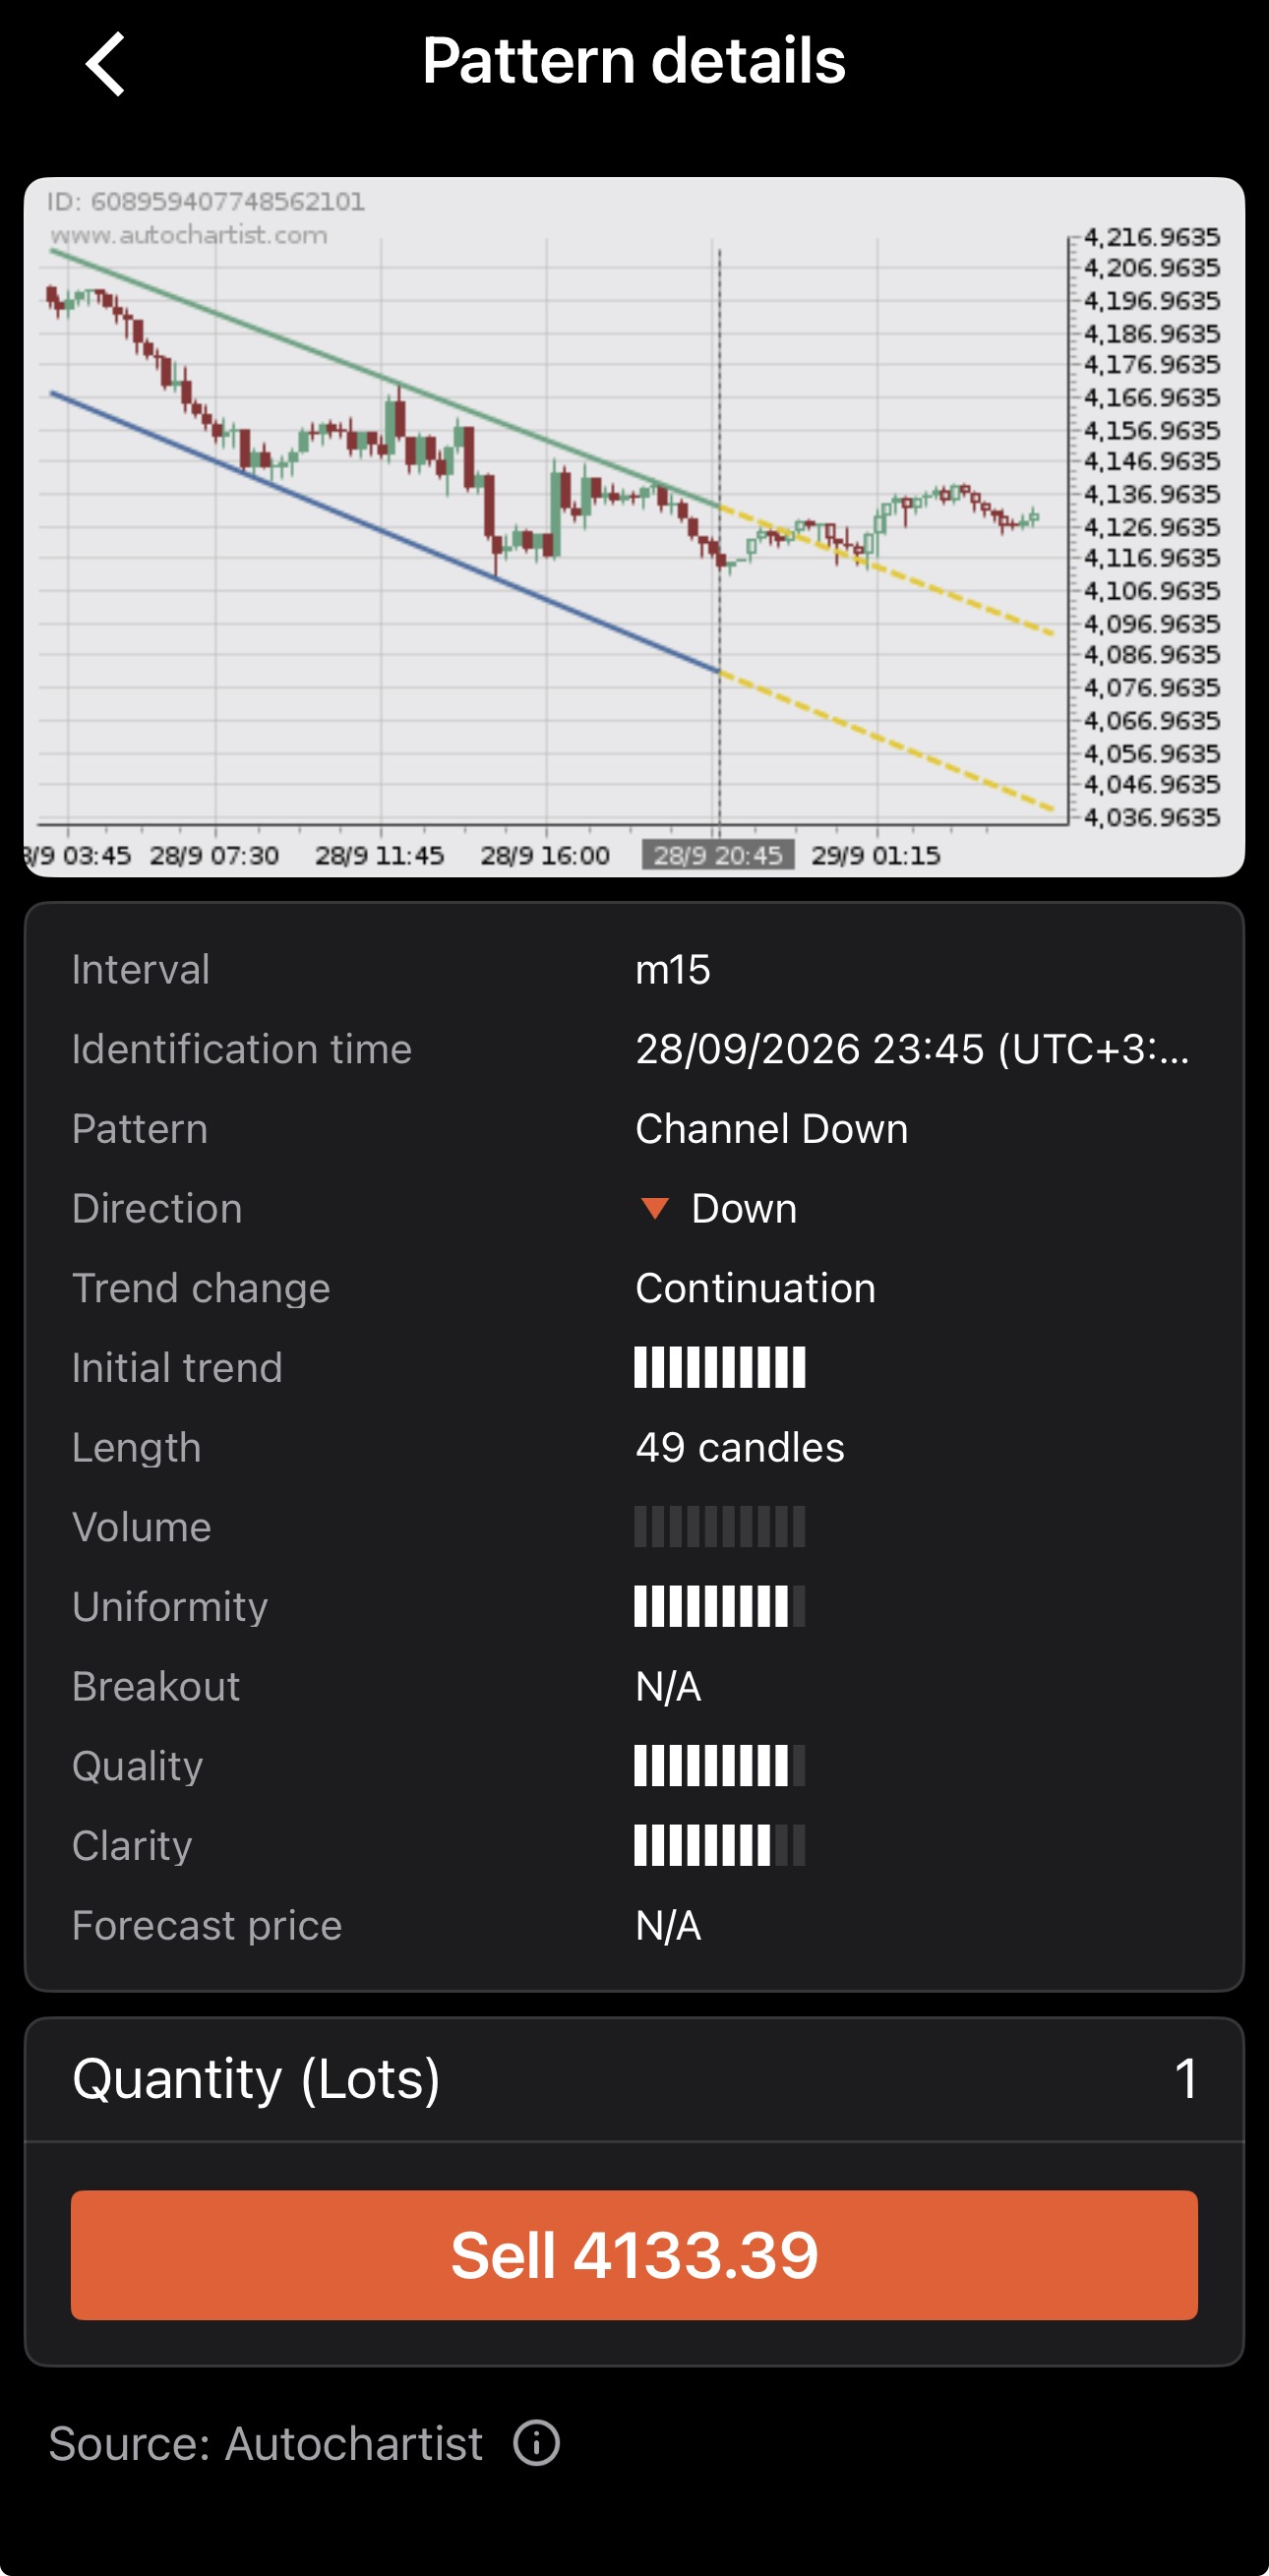
Tap the card for Pattern details, which lists the full analysis above the same trading controls:
- Interval – the chart period Autochartist scanned.
- Identification time – the moment Autochartist recognised the pattern, with the time zone.
- Pattern – the pattern type.
- Direction – the direction the pattern points, up or down.
- Trend change – the pattern's effect on the trend, continuation or reversal.
- Initial trend – the length of the trend running into the pattern, against the pattern's first leg.
- Length – the number of candles the pattern spans.
- Volume – Autochartist's rating of the traded volume behind the pattern. It does not apply to over-the-counter symbols such as forex pairs, which is why it is often unrated.
- Uniformity – the evenness of the spacing between the points where price touched the pattern's support and resistance lines.
- Breakout – the size of the breakout candle against the average candle in the pattern. Rated only once the pattern completes.
- Quality – the average of the other ratings.
- Clarity – the degree to which price tracked the pattern's lines rather than moving randomly.
- Forecast price – the price Autochartist projects.
The ratings run from 1 to 10 and are drawn as bars, and Autochartist defines each one in Chart pattern quality indicators. A field shows N/A where Autochartist has no value for it.
Patterns fall into three families, and the last fields change with the family:
- Chart patterns – no further fields.
- Key levels – Resistance level, the price the pattern is measured against.
- Fibonacci patterns – Time symmetry and Price symmetry, then a Target for each Fibonacci ratio from 0.382 to 1.000.
Autochartist explains what each pattern means in its own knowledge base.
The same patterns appear on the symbol itself, in Technical analysis by Autochartist.
Trading Central signals
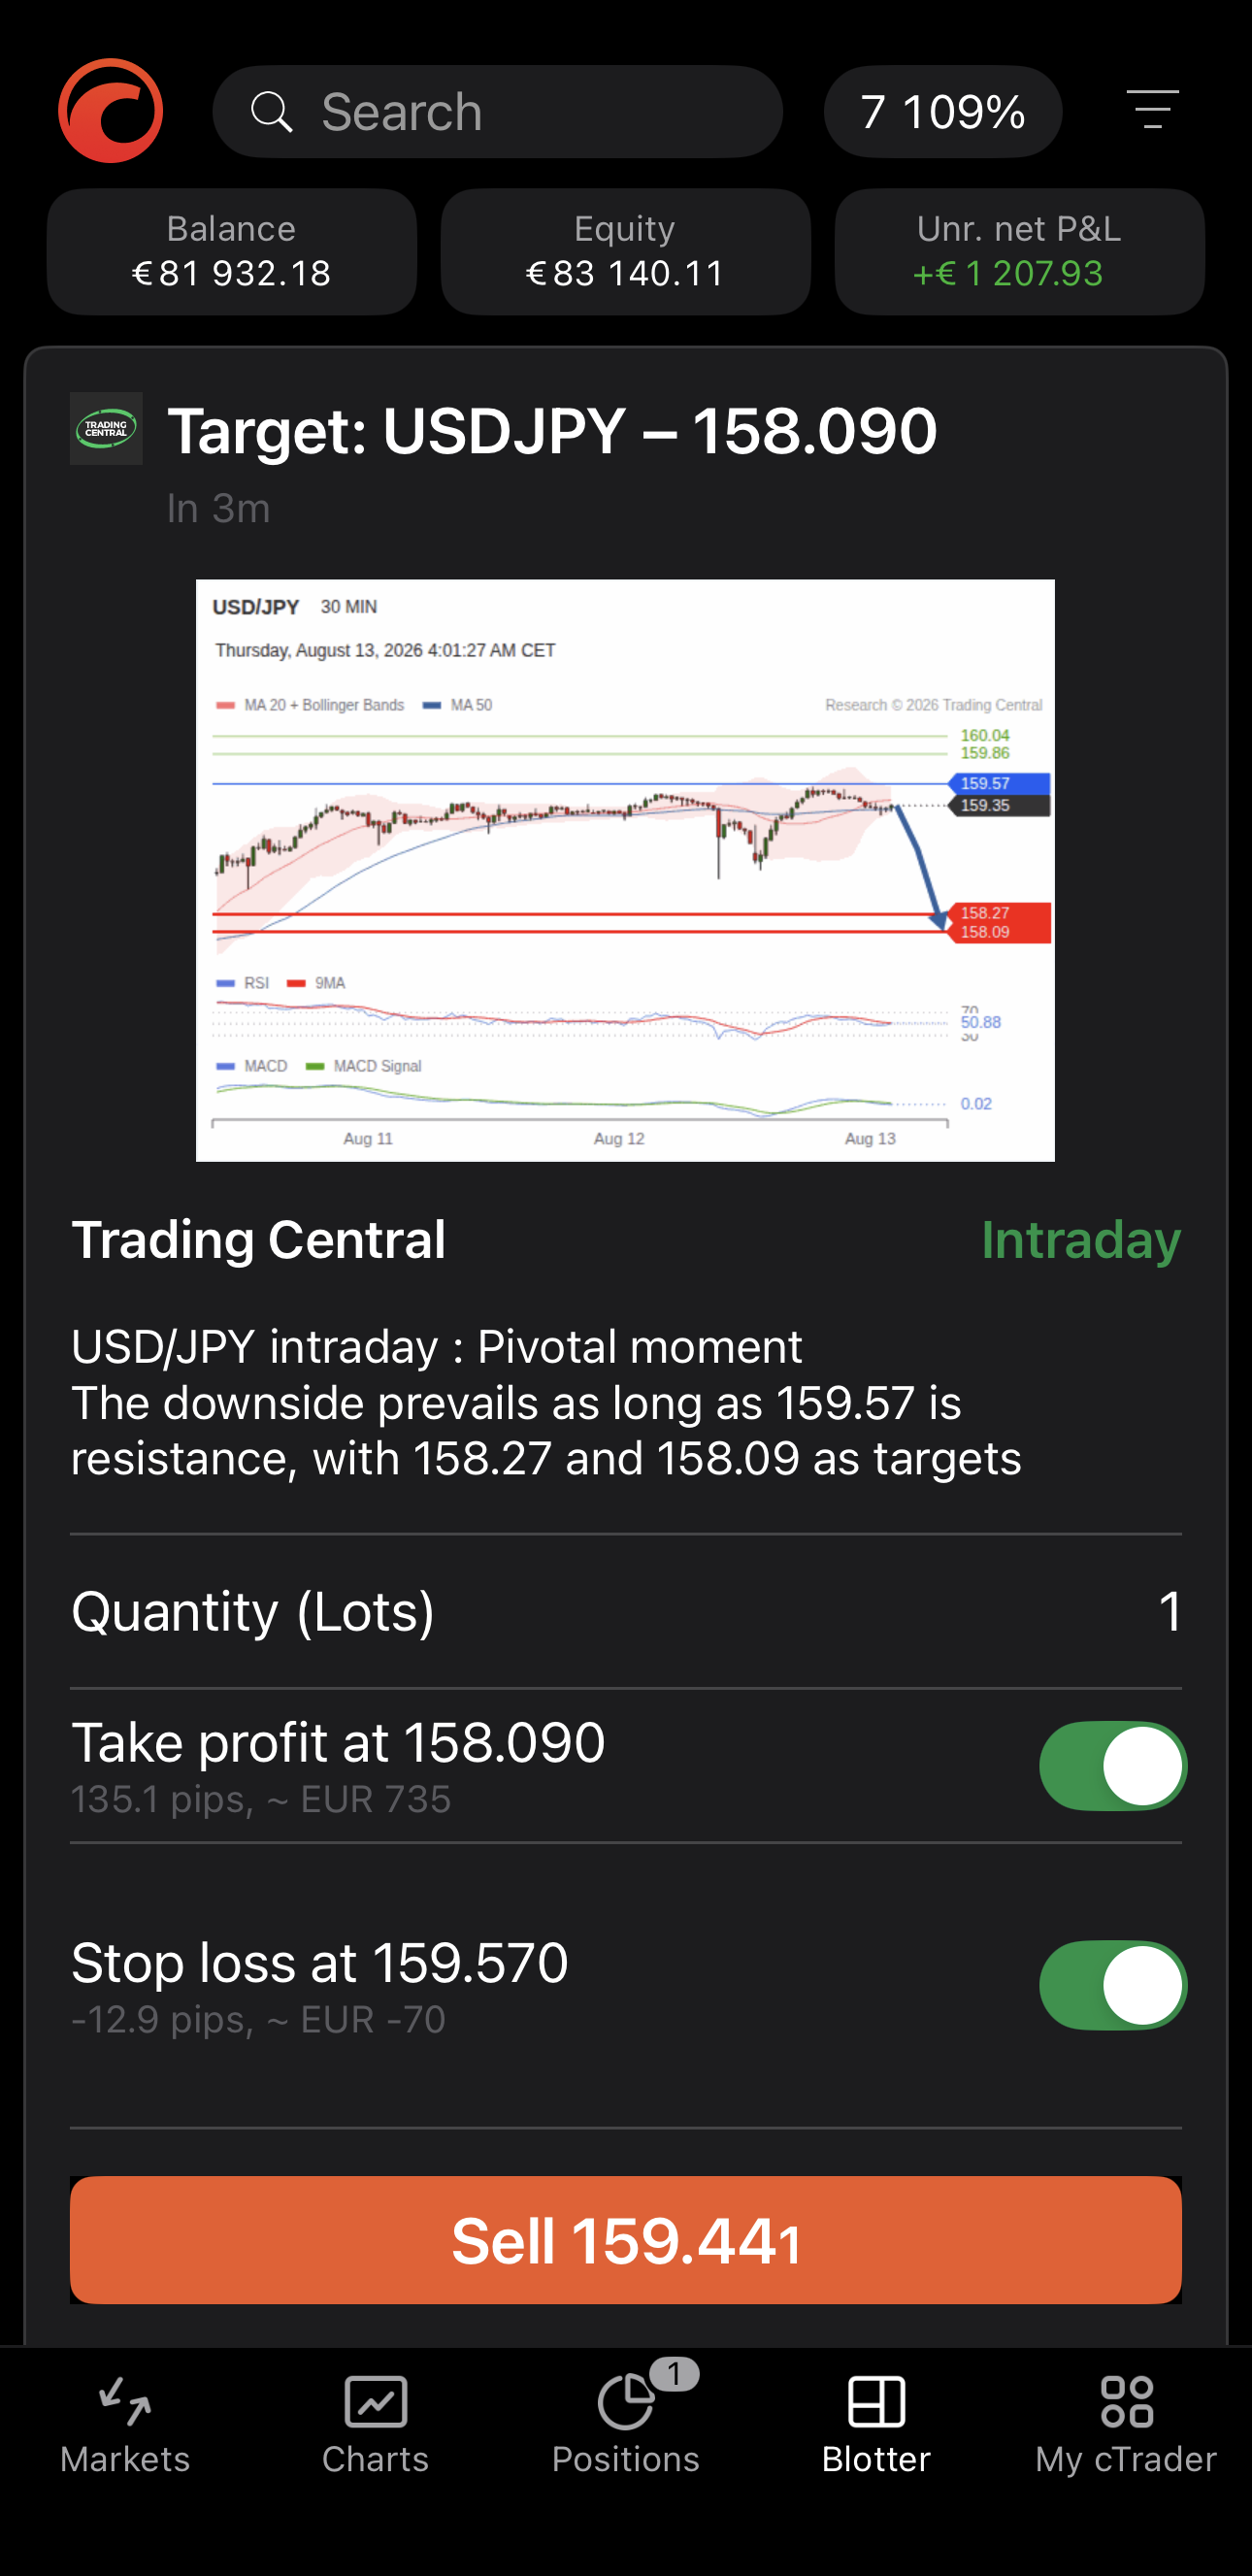
A Trading Central card is headed Target, with the symbol and the target price, and names the investment horizon beside the provider. It carries an annotated chart and a summary of the analysis, then the trading controls:
- Quantity/Volume – the trade size.
- Take profit/Stop loss – the levels Trading Central suggests, each with a switch to turn it off before you trade.
- Buy/Sell – the trade button, following the direction of the analysis and carrying the current price.
Tap the card for the full research.
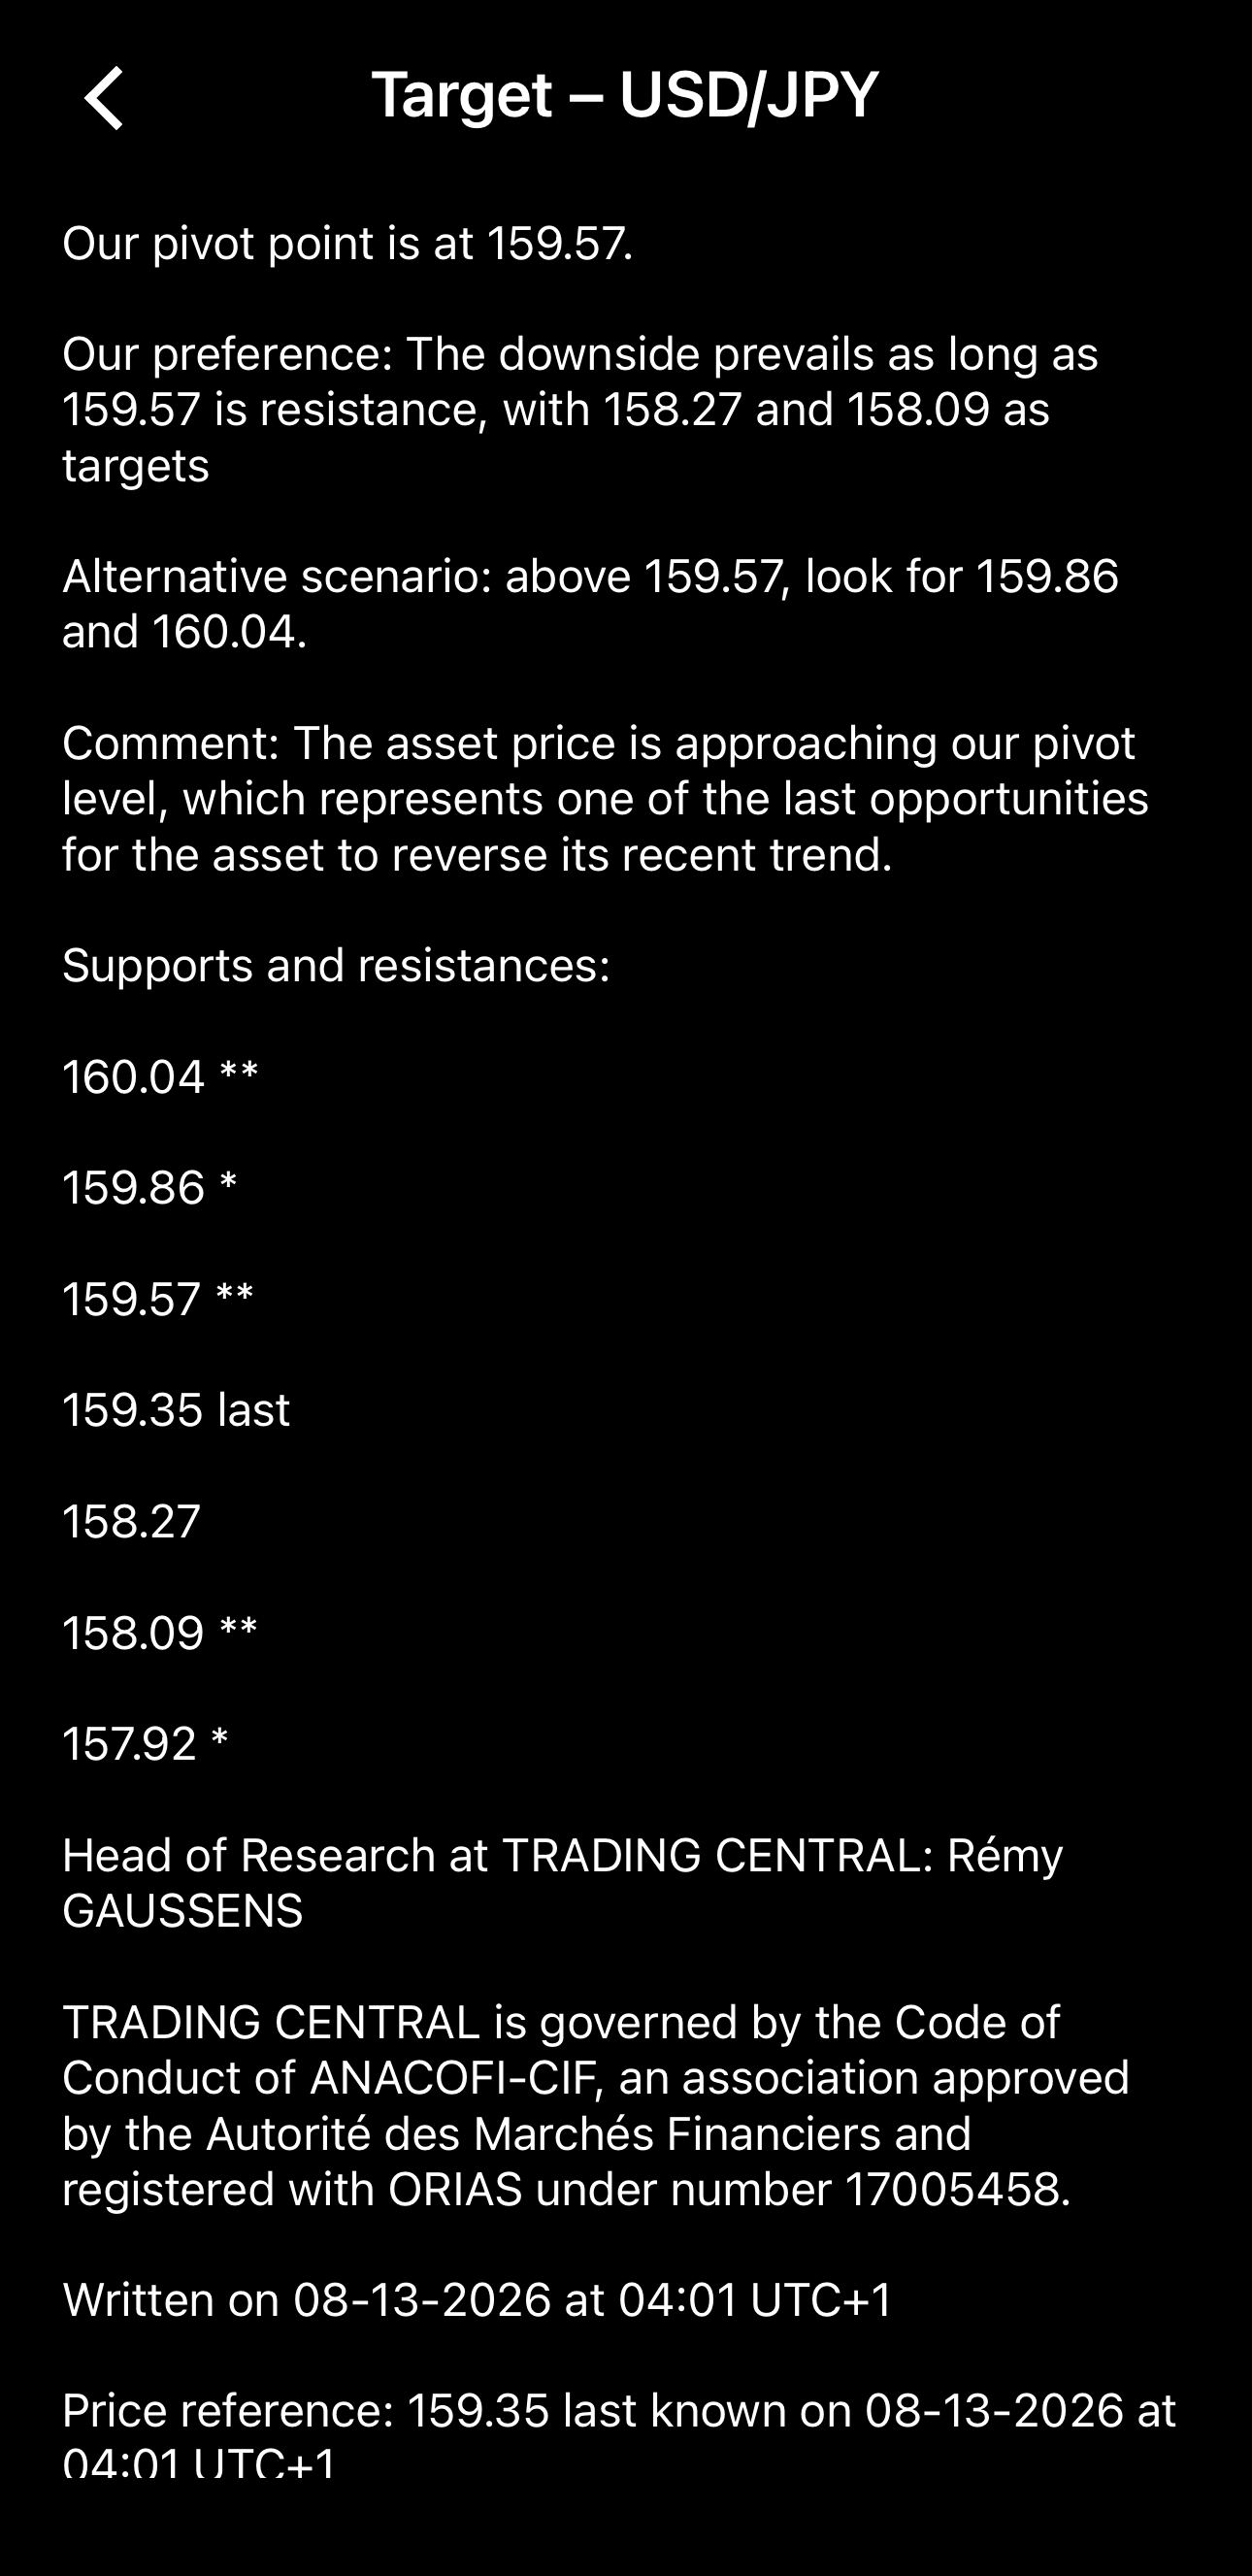
The trading controls are repeated at the top, followed by the pivot point the analysis is built around and:
- Our preference – the scenario Trading Central favours, with its targets.
- Alternative scenario – Trading Central's expectation if the pivot point gives way.
- Comment – the reasoning behind the call.
- Supports and resistances – the levels around the current price, with the last known price marked.
- Written on – the date and time the analysis was published.
- Price reference – the price and time the analysis was written against.
- Investment horizon – the period the analysis covers.
Economic calendar events
The feed carries an event for every release, whatever symbols you trade or watch. Headed Economic calendar with the release name, it gives the currency affected and its Volatility, Actual, Consensus and Previous figures, followed by a description of what the release measures.
See the economic calendar in My cTrader for the complete schedule and what each figure means.
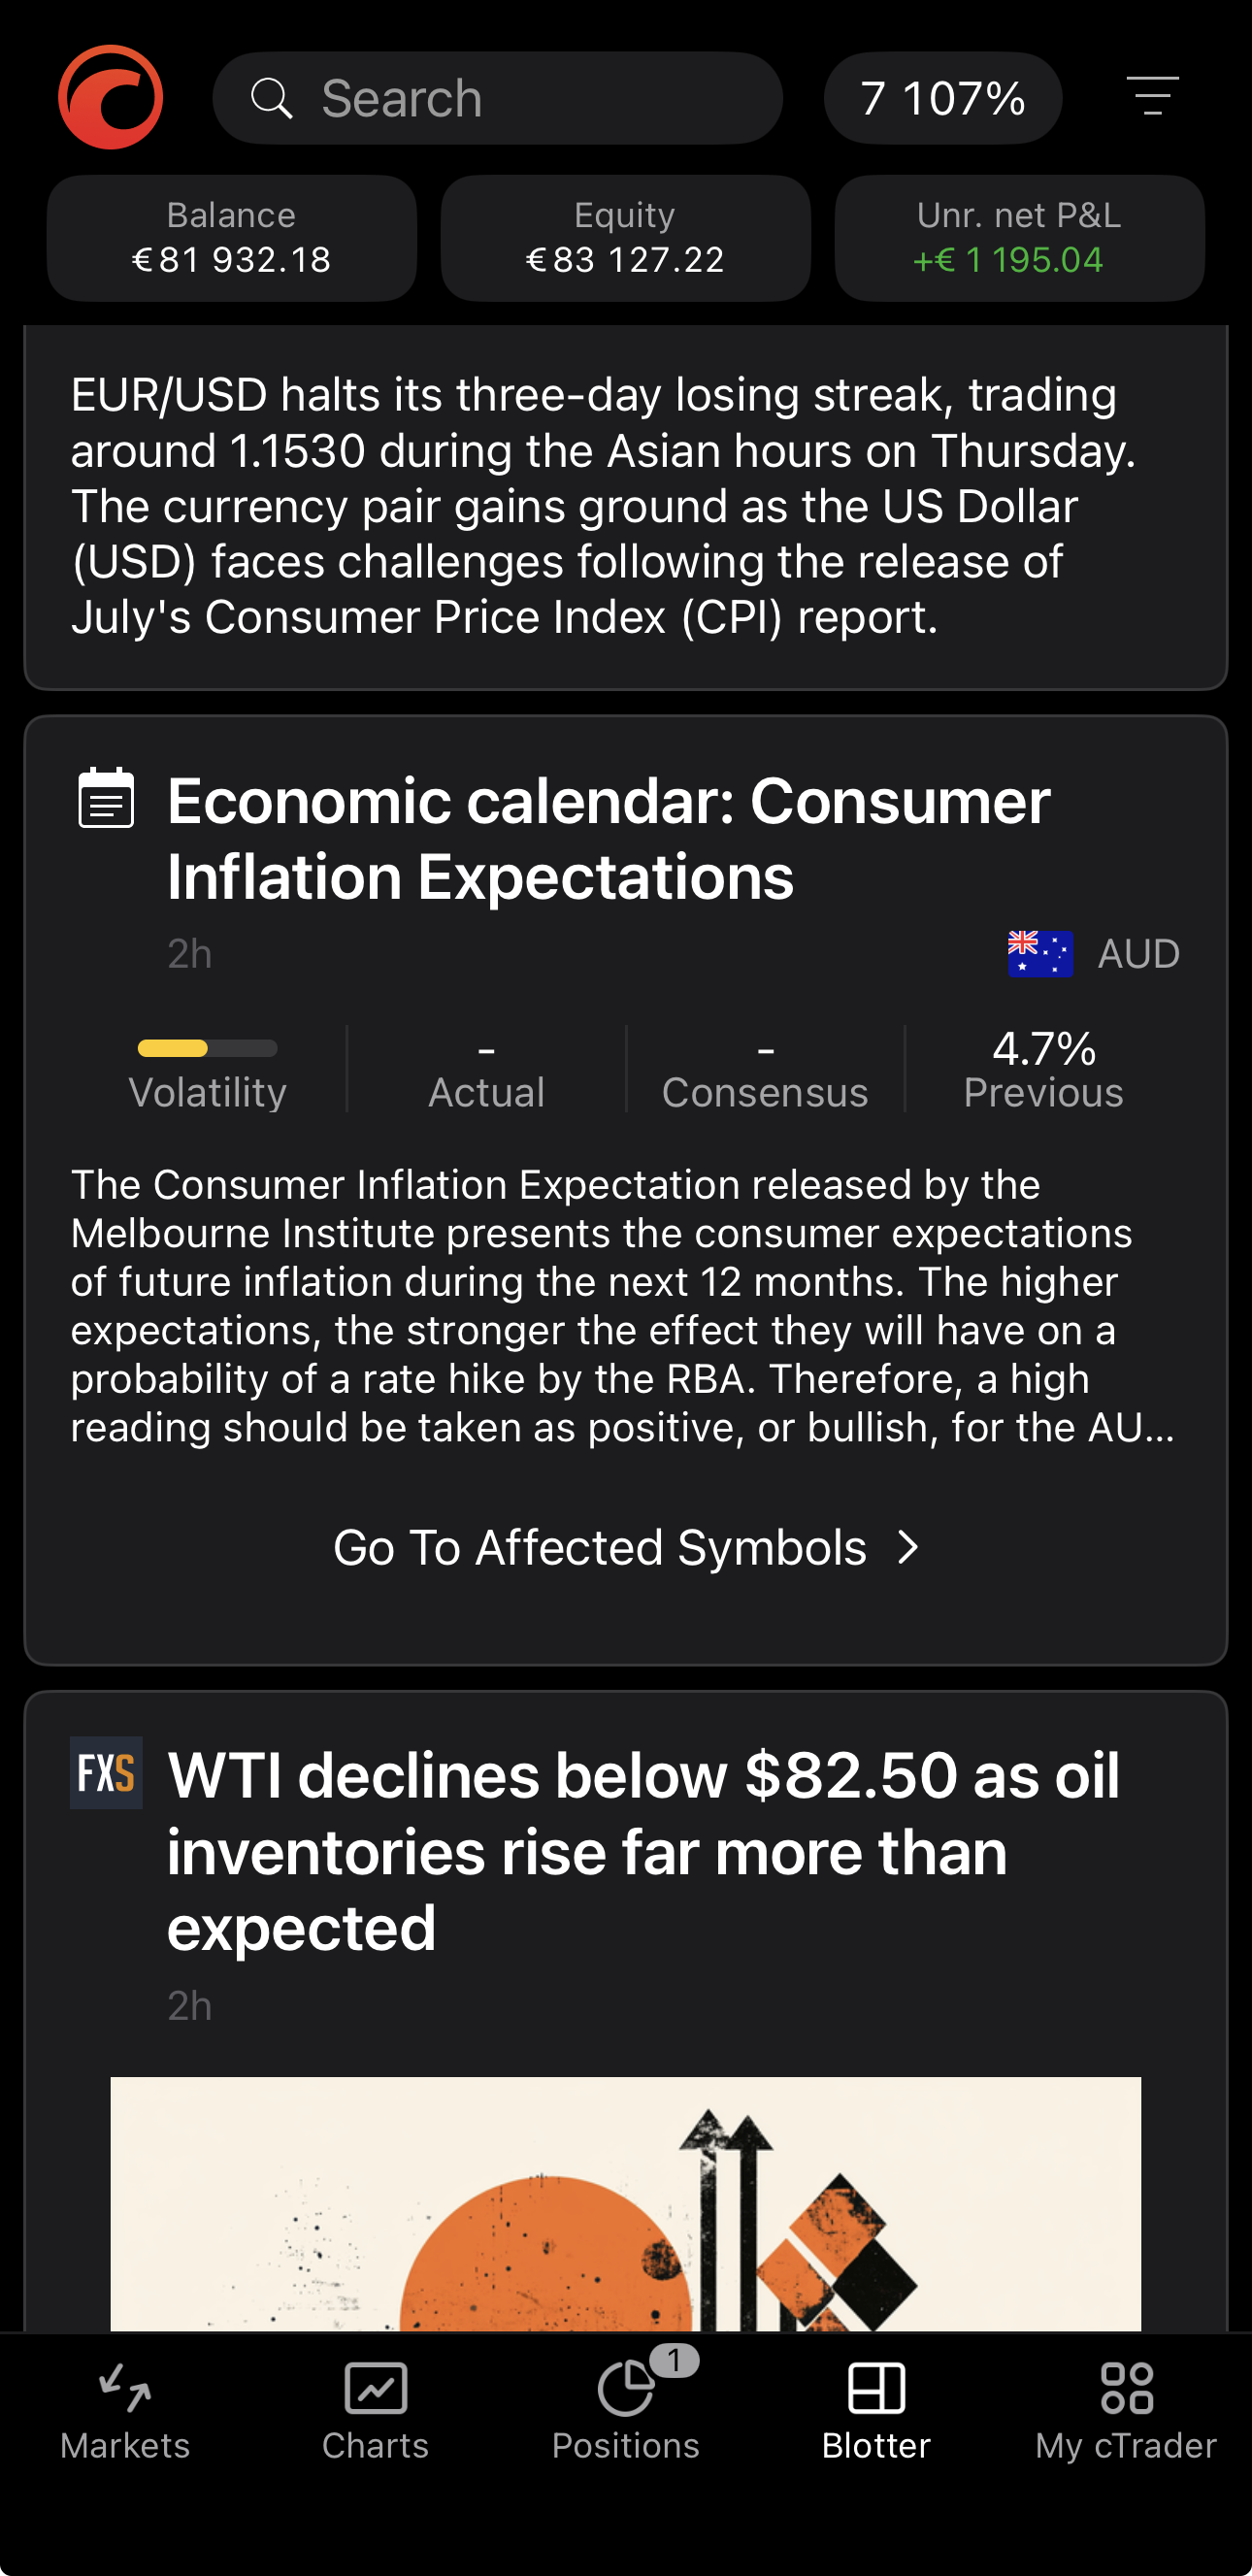
Tap Go To Affected Symbols to view the symbols quoted against the event currency, then tap one to open its symbol overview.
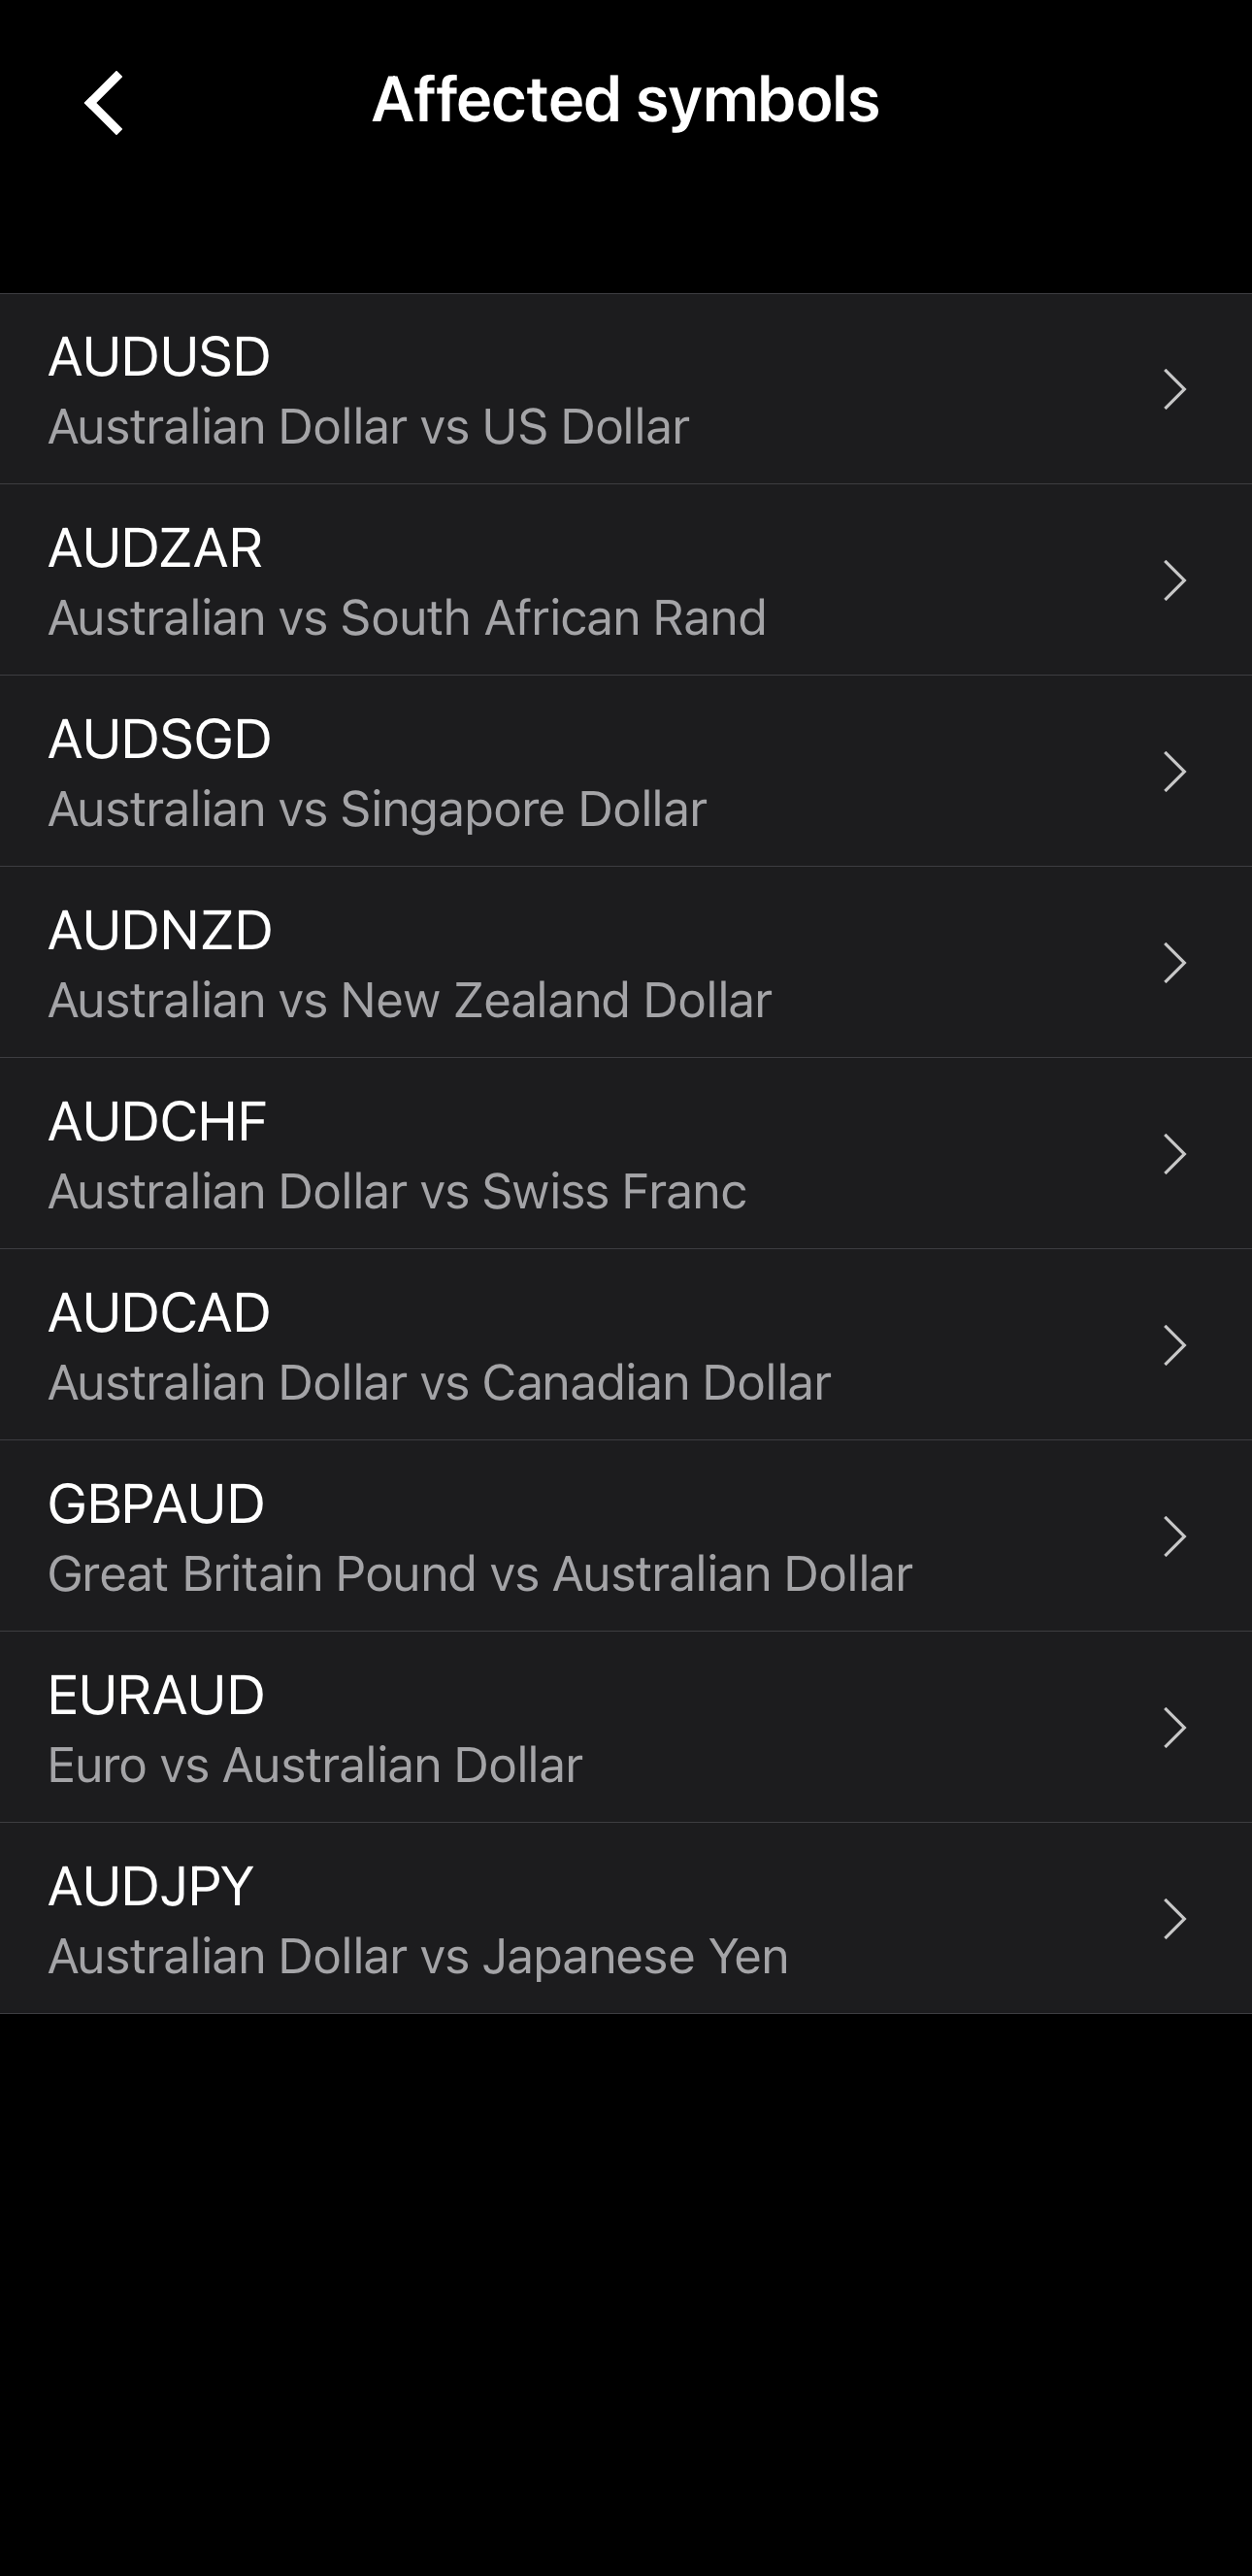
Financial and crypto news
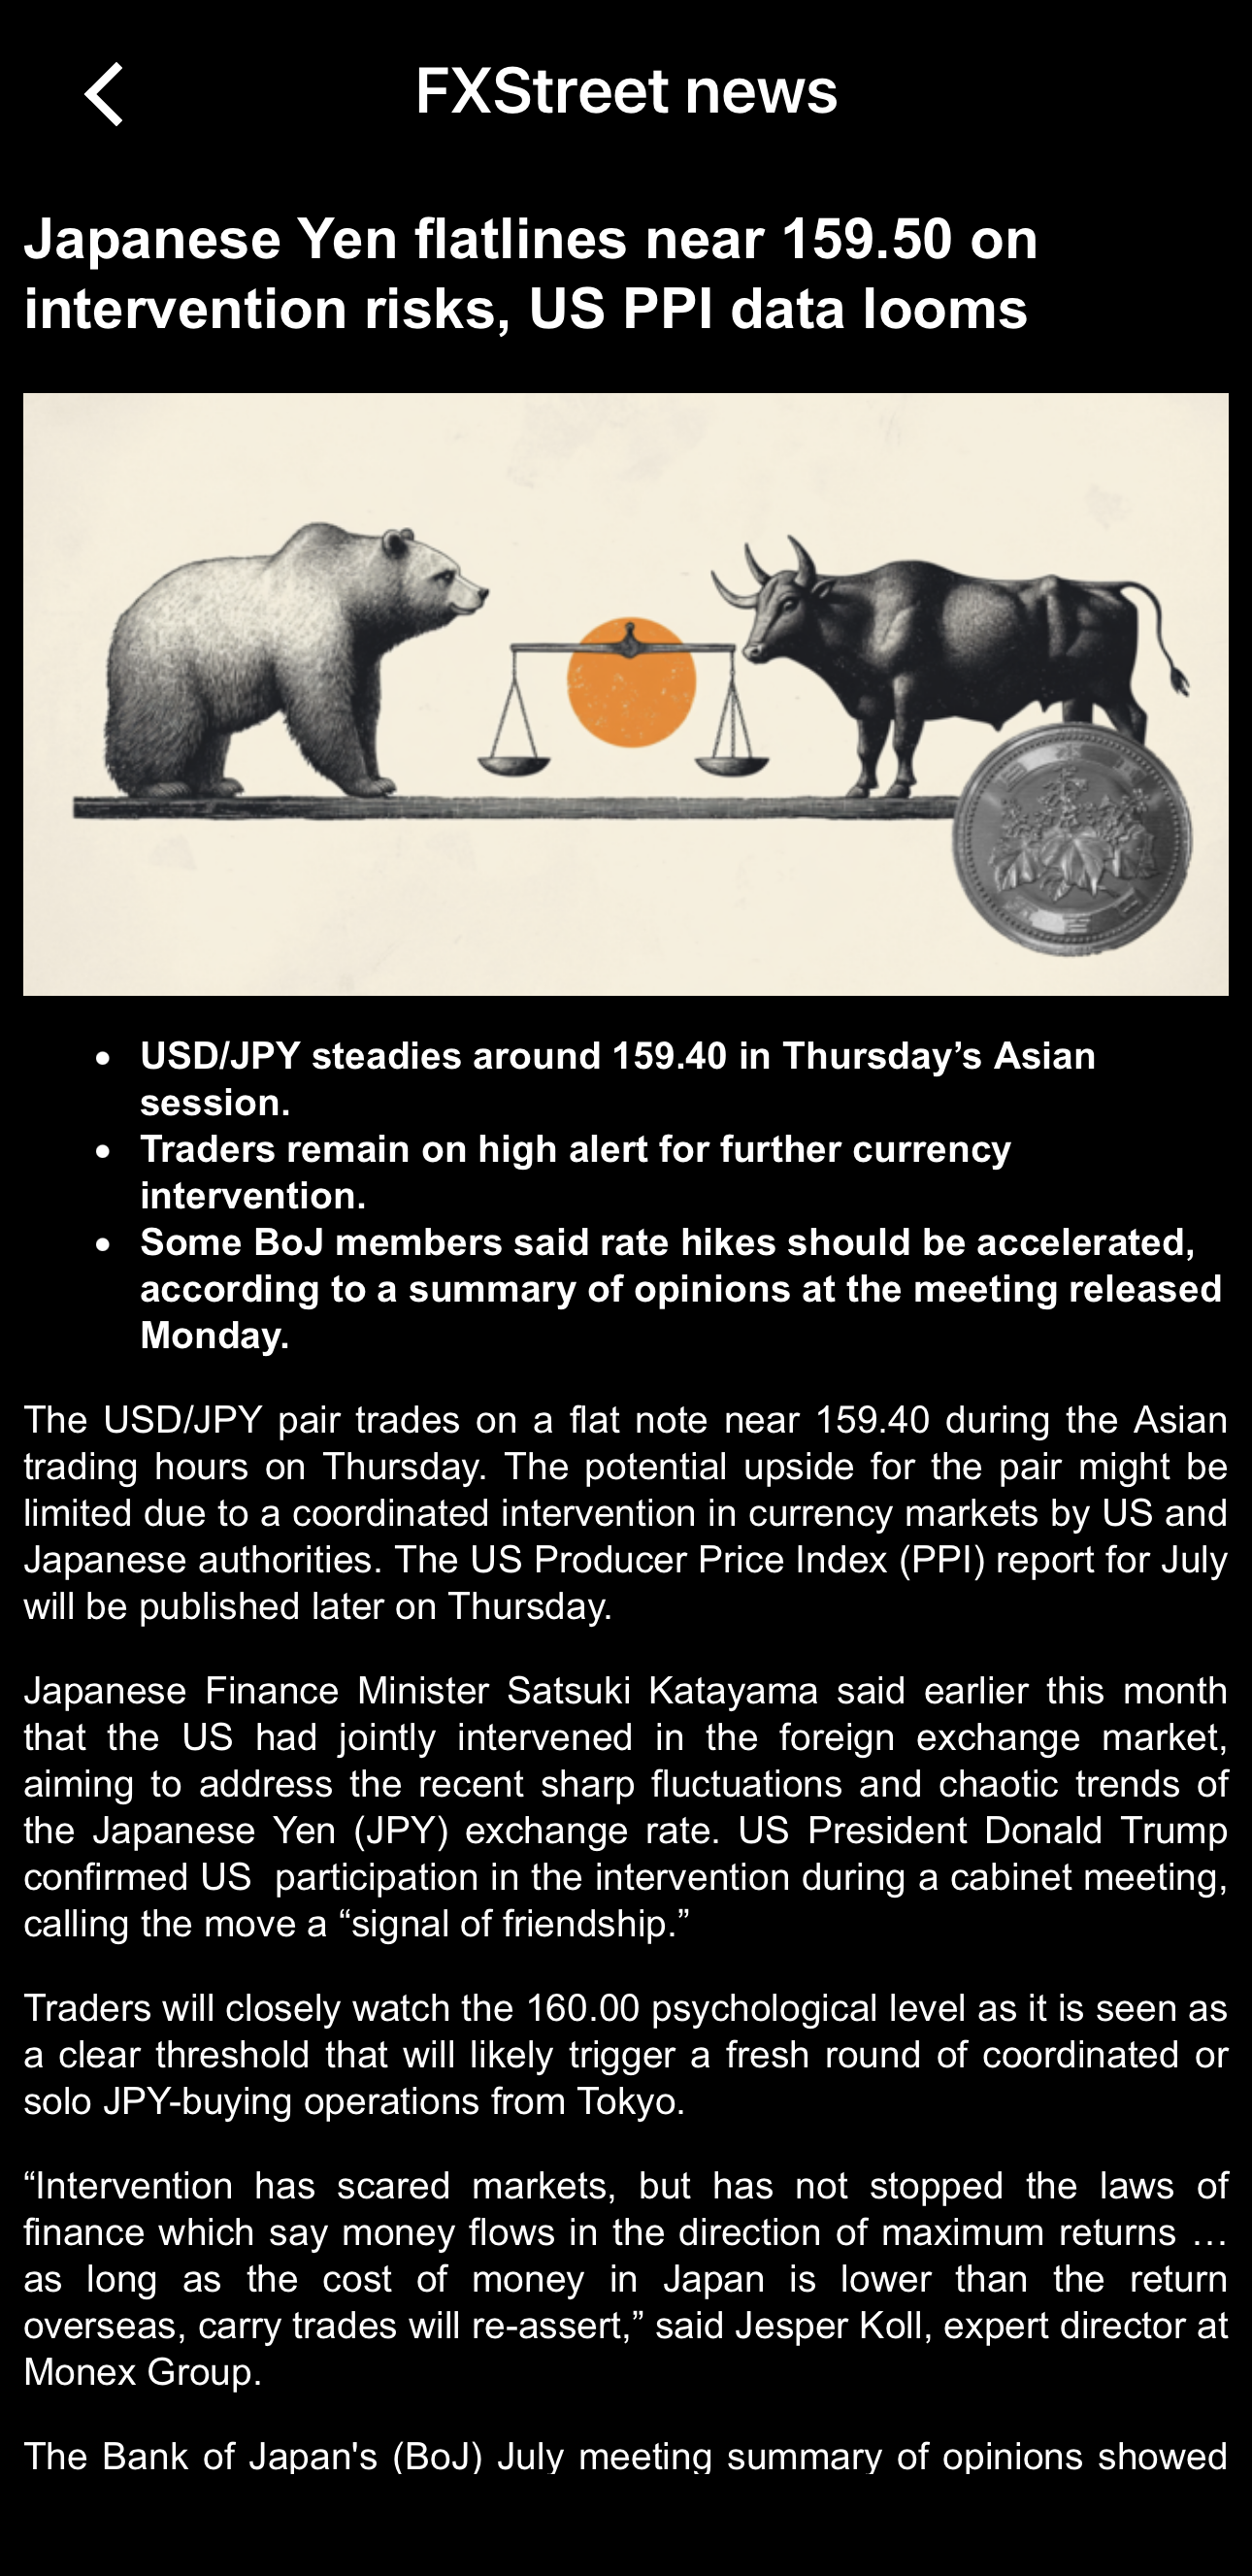
News comes from FXStreet. A news card shows the headline, the publication date, an image and the opening lines.
Tap the card to read the article on the FXStreet news screen. It opens with the key points, and depending on the story it can also carry annotated charts, a technical analysis and answers to common questions about the instrument.
cTrader Copy events
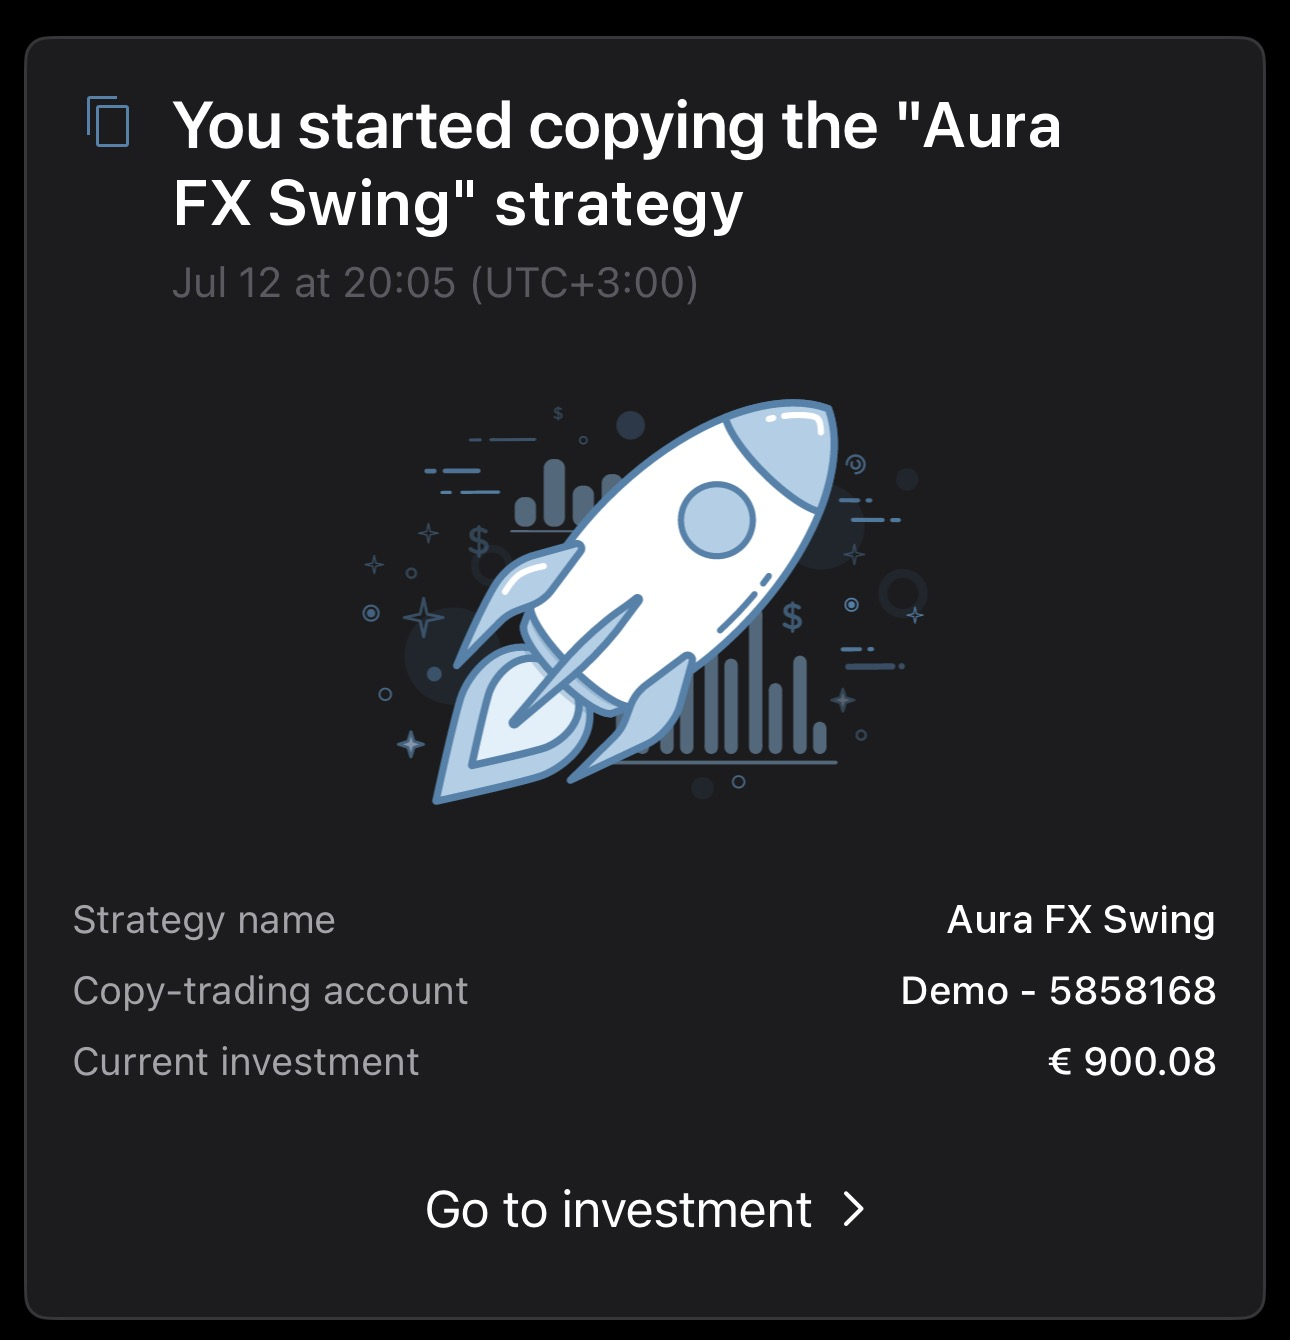
A cTrader Copy card reports a change to a strategy you invest in, such as the start of copying, and when it happened:
- Strategy name – the strategy the event concerns.
- Copy-trading account – the account that copies the strategy.
- Current investment – the funds allocated to the strategy.
Tap Go to investment to open the investment in cTrader Copy.
cTrader ID account events
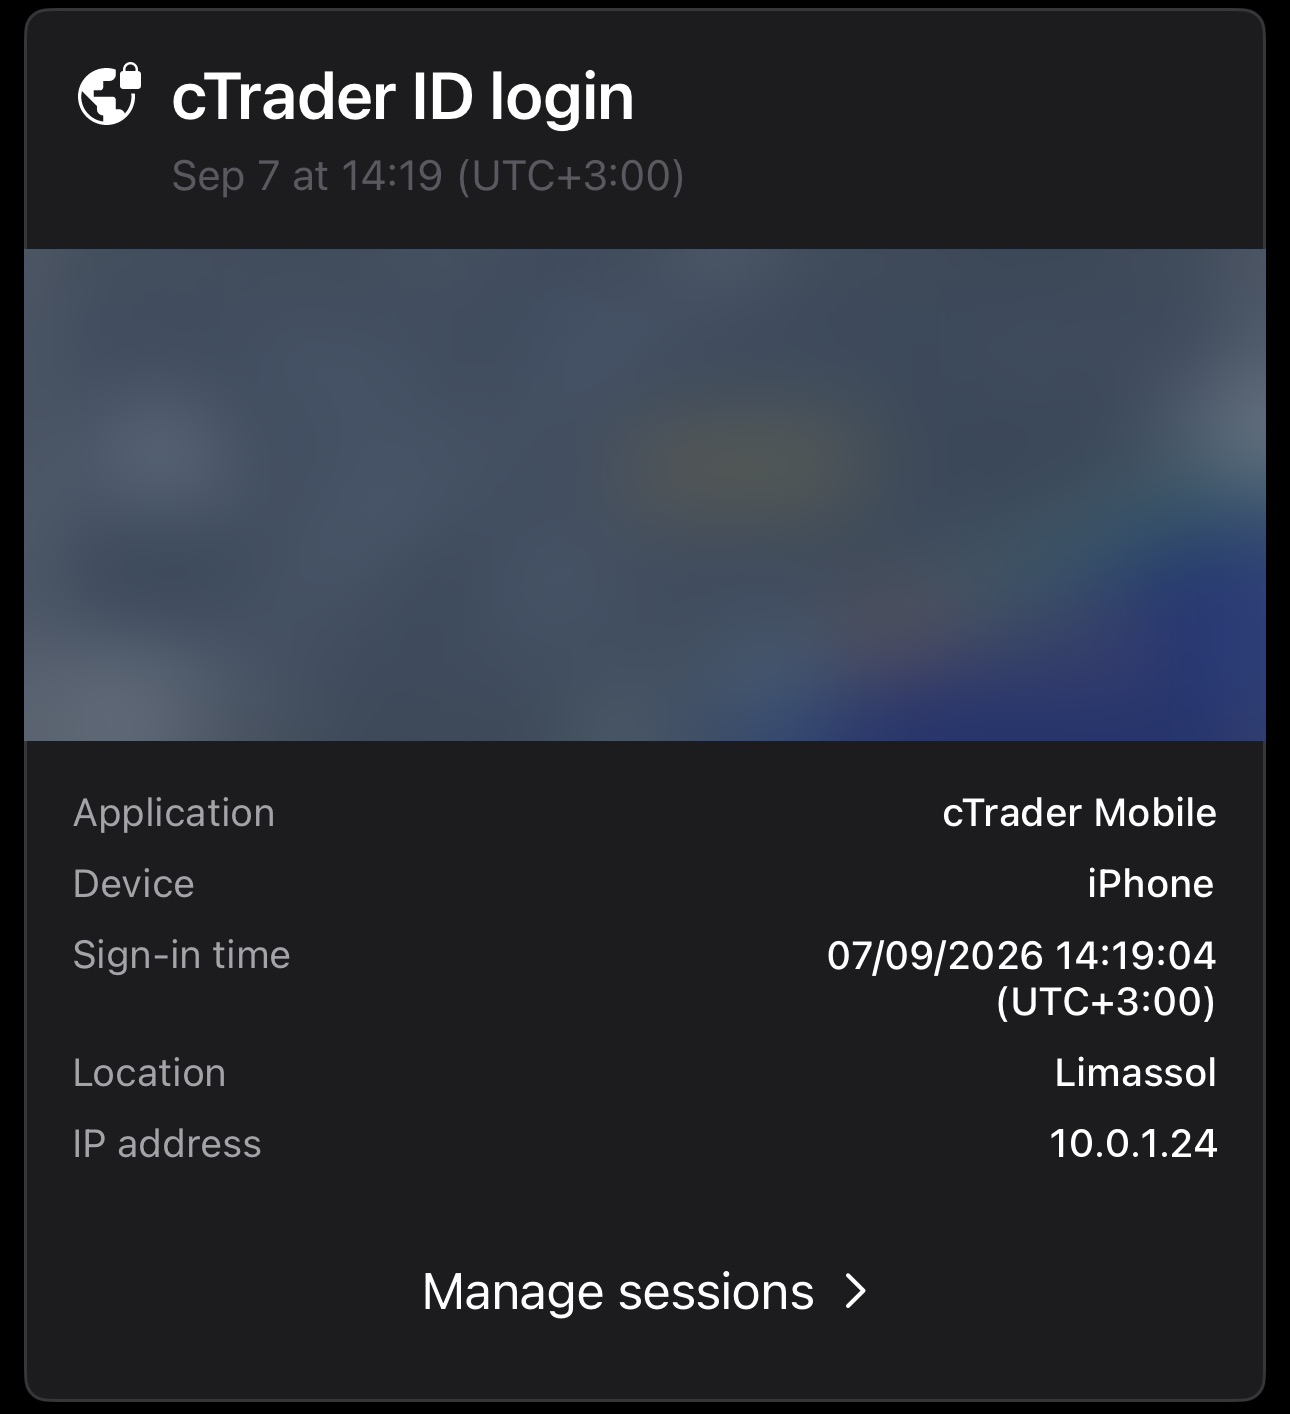
A cTrader ID login card reports a sign-in with your cTrader ID, with a location on the map:
- Application – the cTrader app used to sign in.
- Device – the device used to sign in.
- Sign-in time – the date and time of the sign-in.
- Location – the city the sign-in came from.
- IP address – the address the sign-in came from.
Tap Manage sessions to open your active sessions and terminate any you do not recognise.