Stats to share
Stats to share creates a public link to the real-time statistics of an active trading account.
Benefits for money managers
- Show prospective clients a live, view-only page instead of a screenshot.
- Publish the ROI, equity and performance history behind the account, so they can check it before committing.
Account access rights is a different feature: it lets someone trade the account.
Generate and share a link
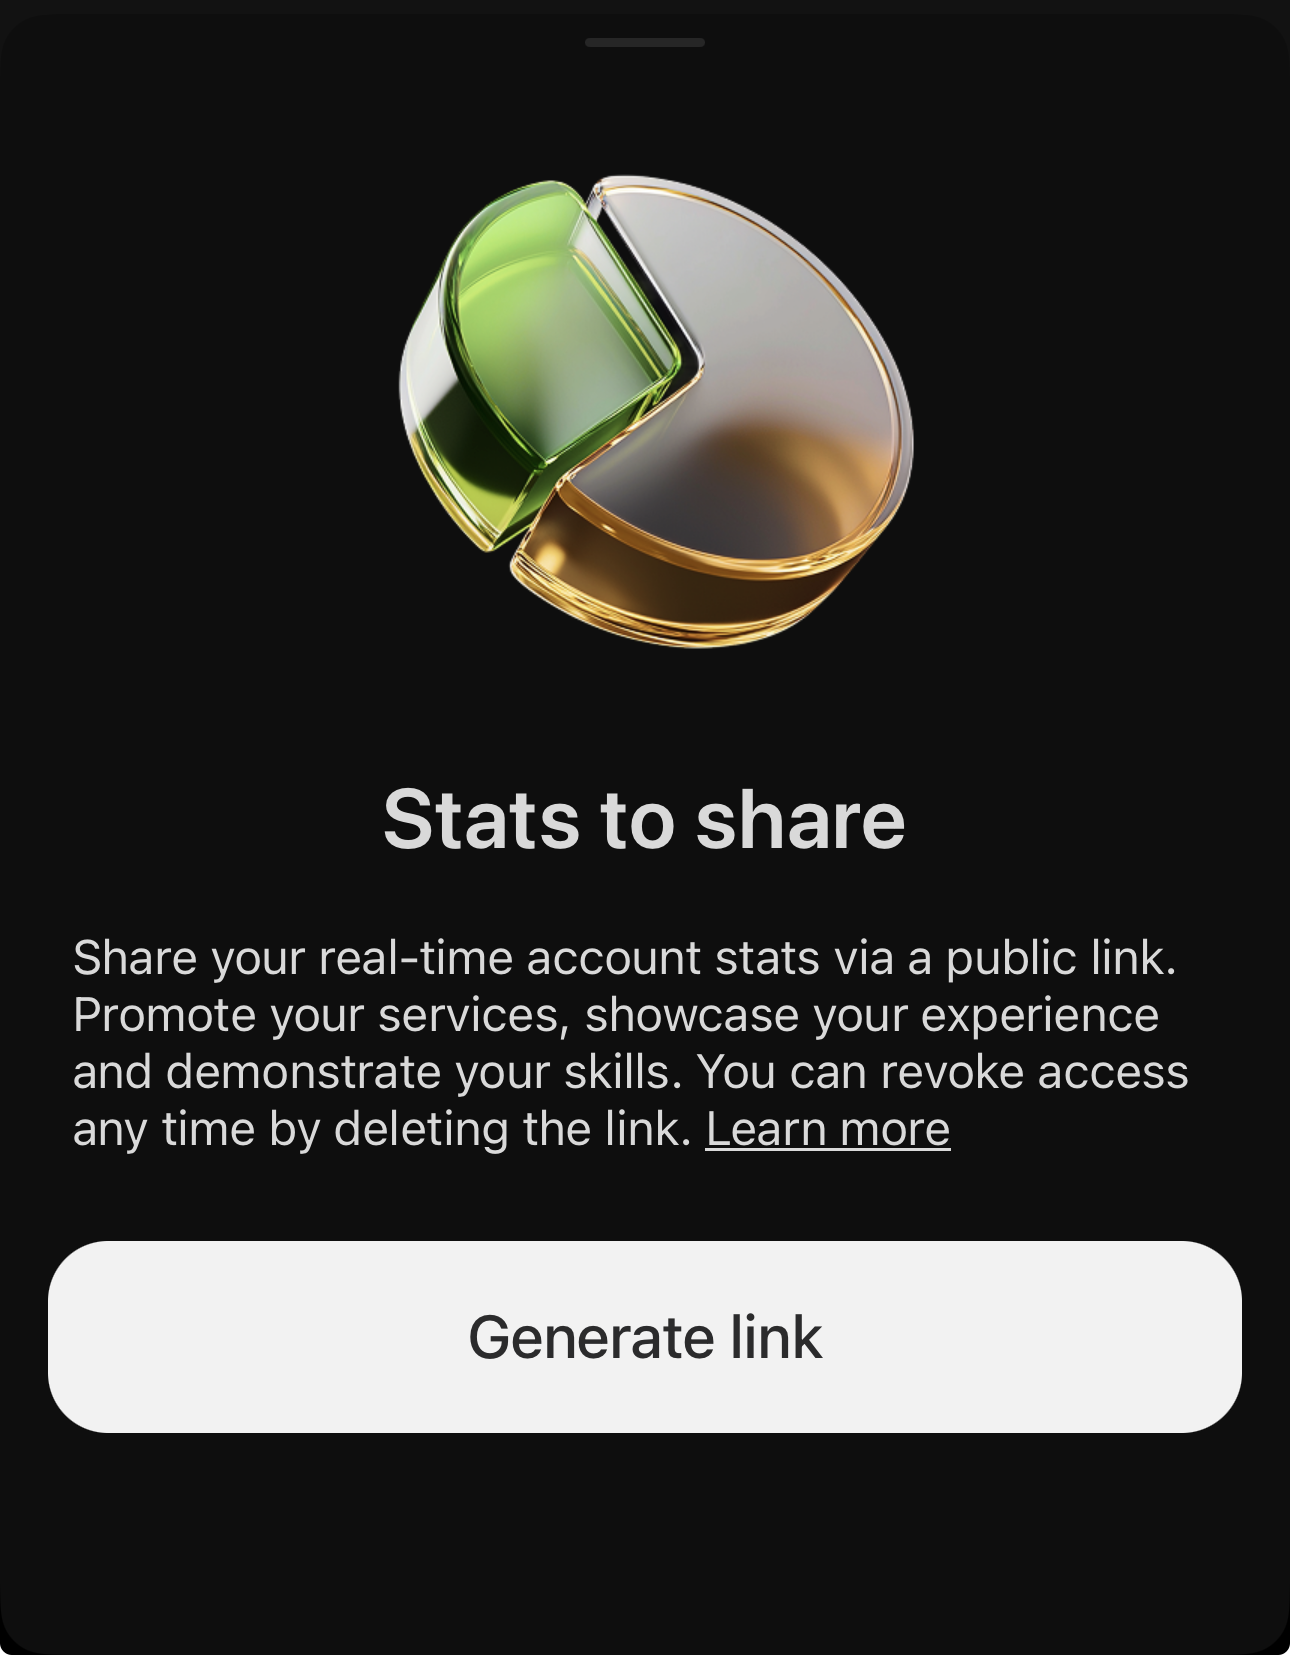
- Open My cTrader and select the account.
- Tap Stats to share under the balance.
- Tap Generate link.
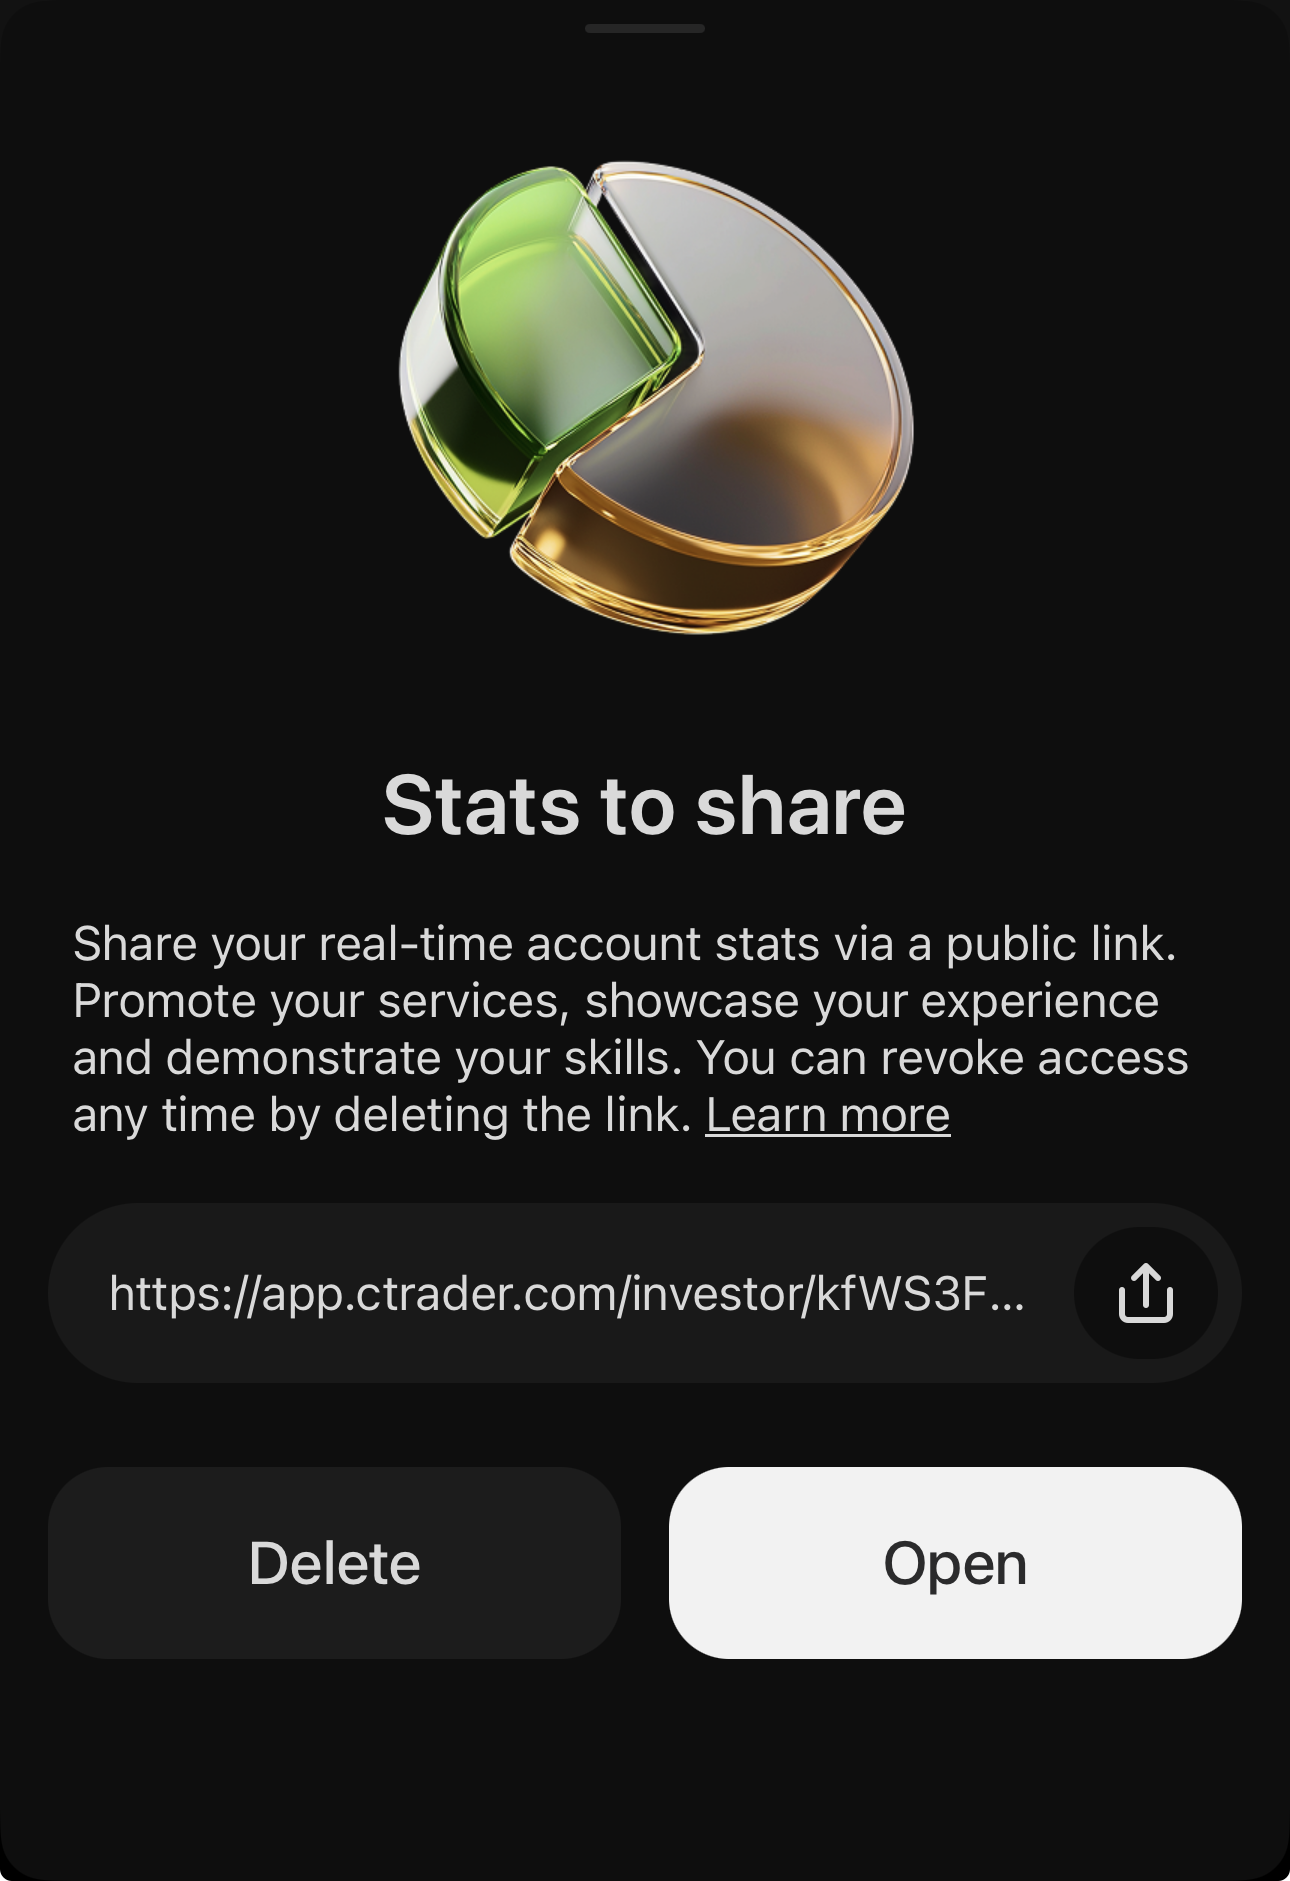
- Tap beside the link and choose a channel and contact or copy the link.
The generated URL remains available until you delete it. Tap Open to view the public page or use to send the same link again.
Account stats
The link opens a single scrolling page, headed Summary and running down through the charts to a set of expandable sections.
Summary and charts
Summary reports the headline result of the account.
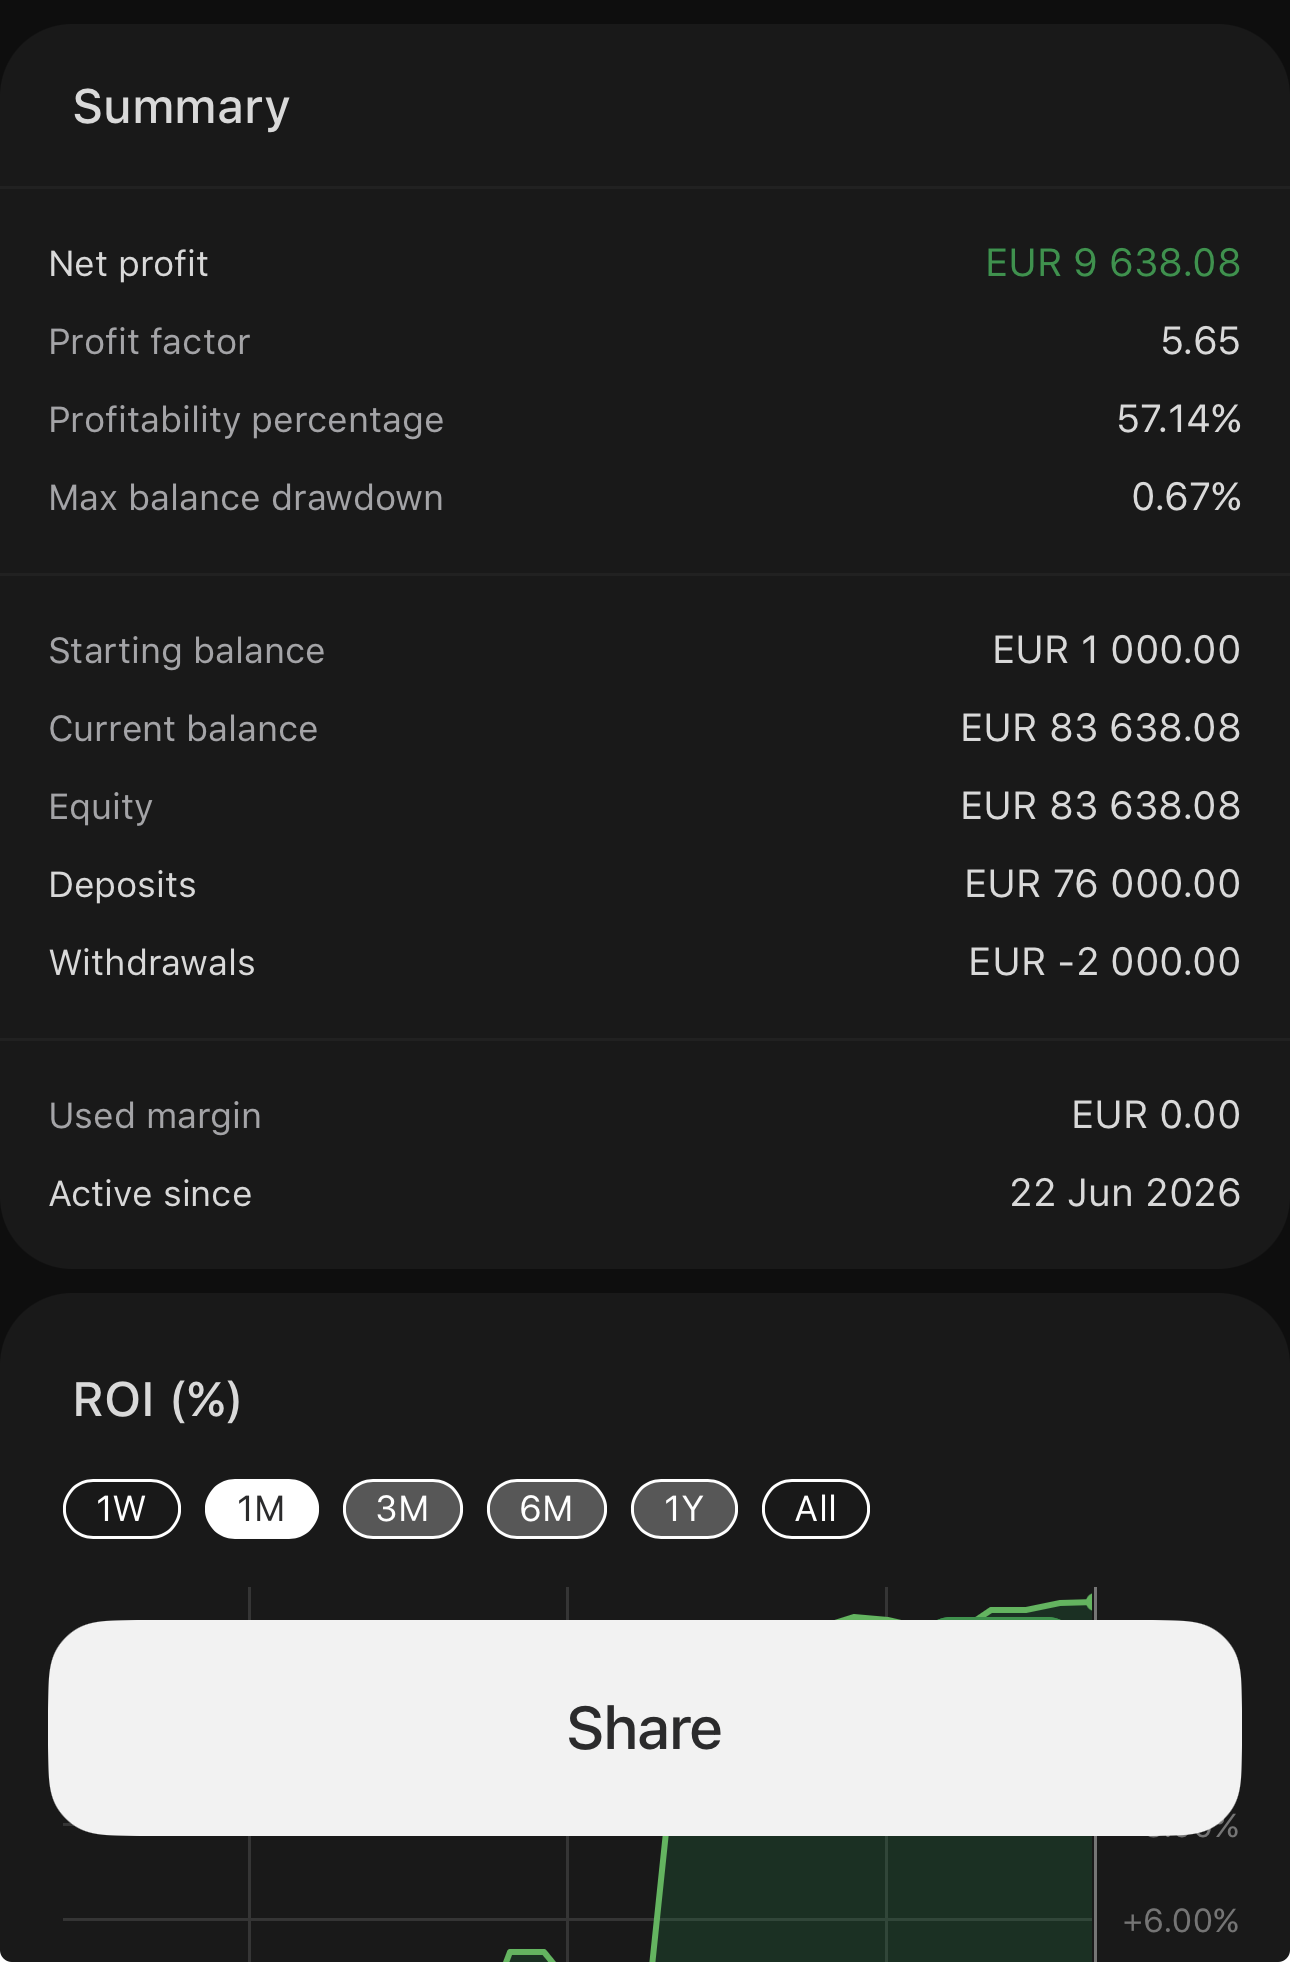
- Net profit – the combined result of all closed deals, after commission and fees.
- Profit factor – gross profit divided by gross loss.
- Profitability percentage – the share of closed deals that ended in profit.
- Max balance drawdown – the largest fall in balance from a peak to the trough that followed it, as a percentage.
- Starting balance – the balance the account opened with.
- Current balance – the balance after all closed deals, deposits and withdrawals.
- Equity – the current balance plus the unrealised result of any open positions.
- Deposits and Withdrawals – the totals paid into and out of the account since it opened.
- Used margin – the amount currently committed to open positions.
- Active since – the date the account was opened.
Four charts follow, each with its own period controls.
- ROI (%) – the return on the account over 1W, 1M, 3M, 6M, 1Y or All.
- Equity – balance and equity together, with every deposit and withdrawal marked.
- ROI (Monthly) – the return month by month, for a chosen year.
- Performance – winning and losing deals per period, Monthly or Daily.
Volume breakdown
Volume Breakdown splits traded volume by symbol, with the same 1W to All range selector the charts above it carry. Each segment of the donut is one symbol.
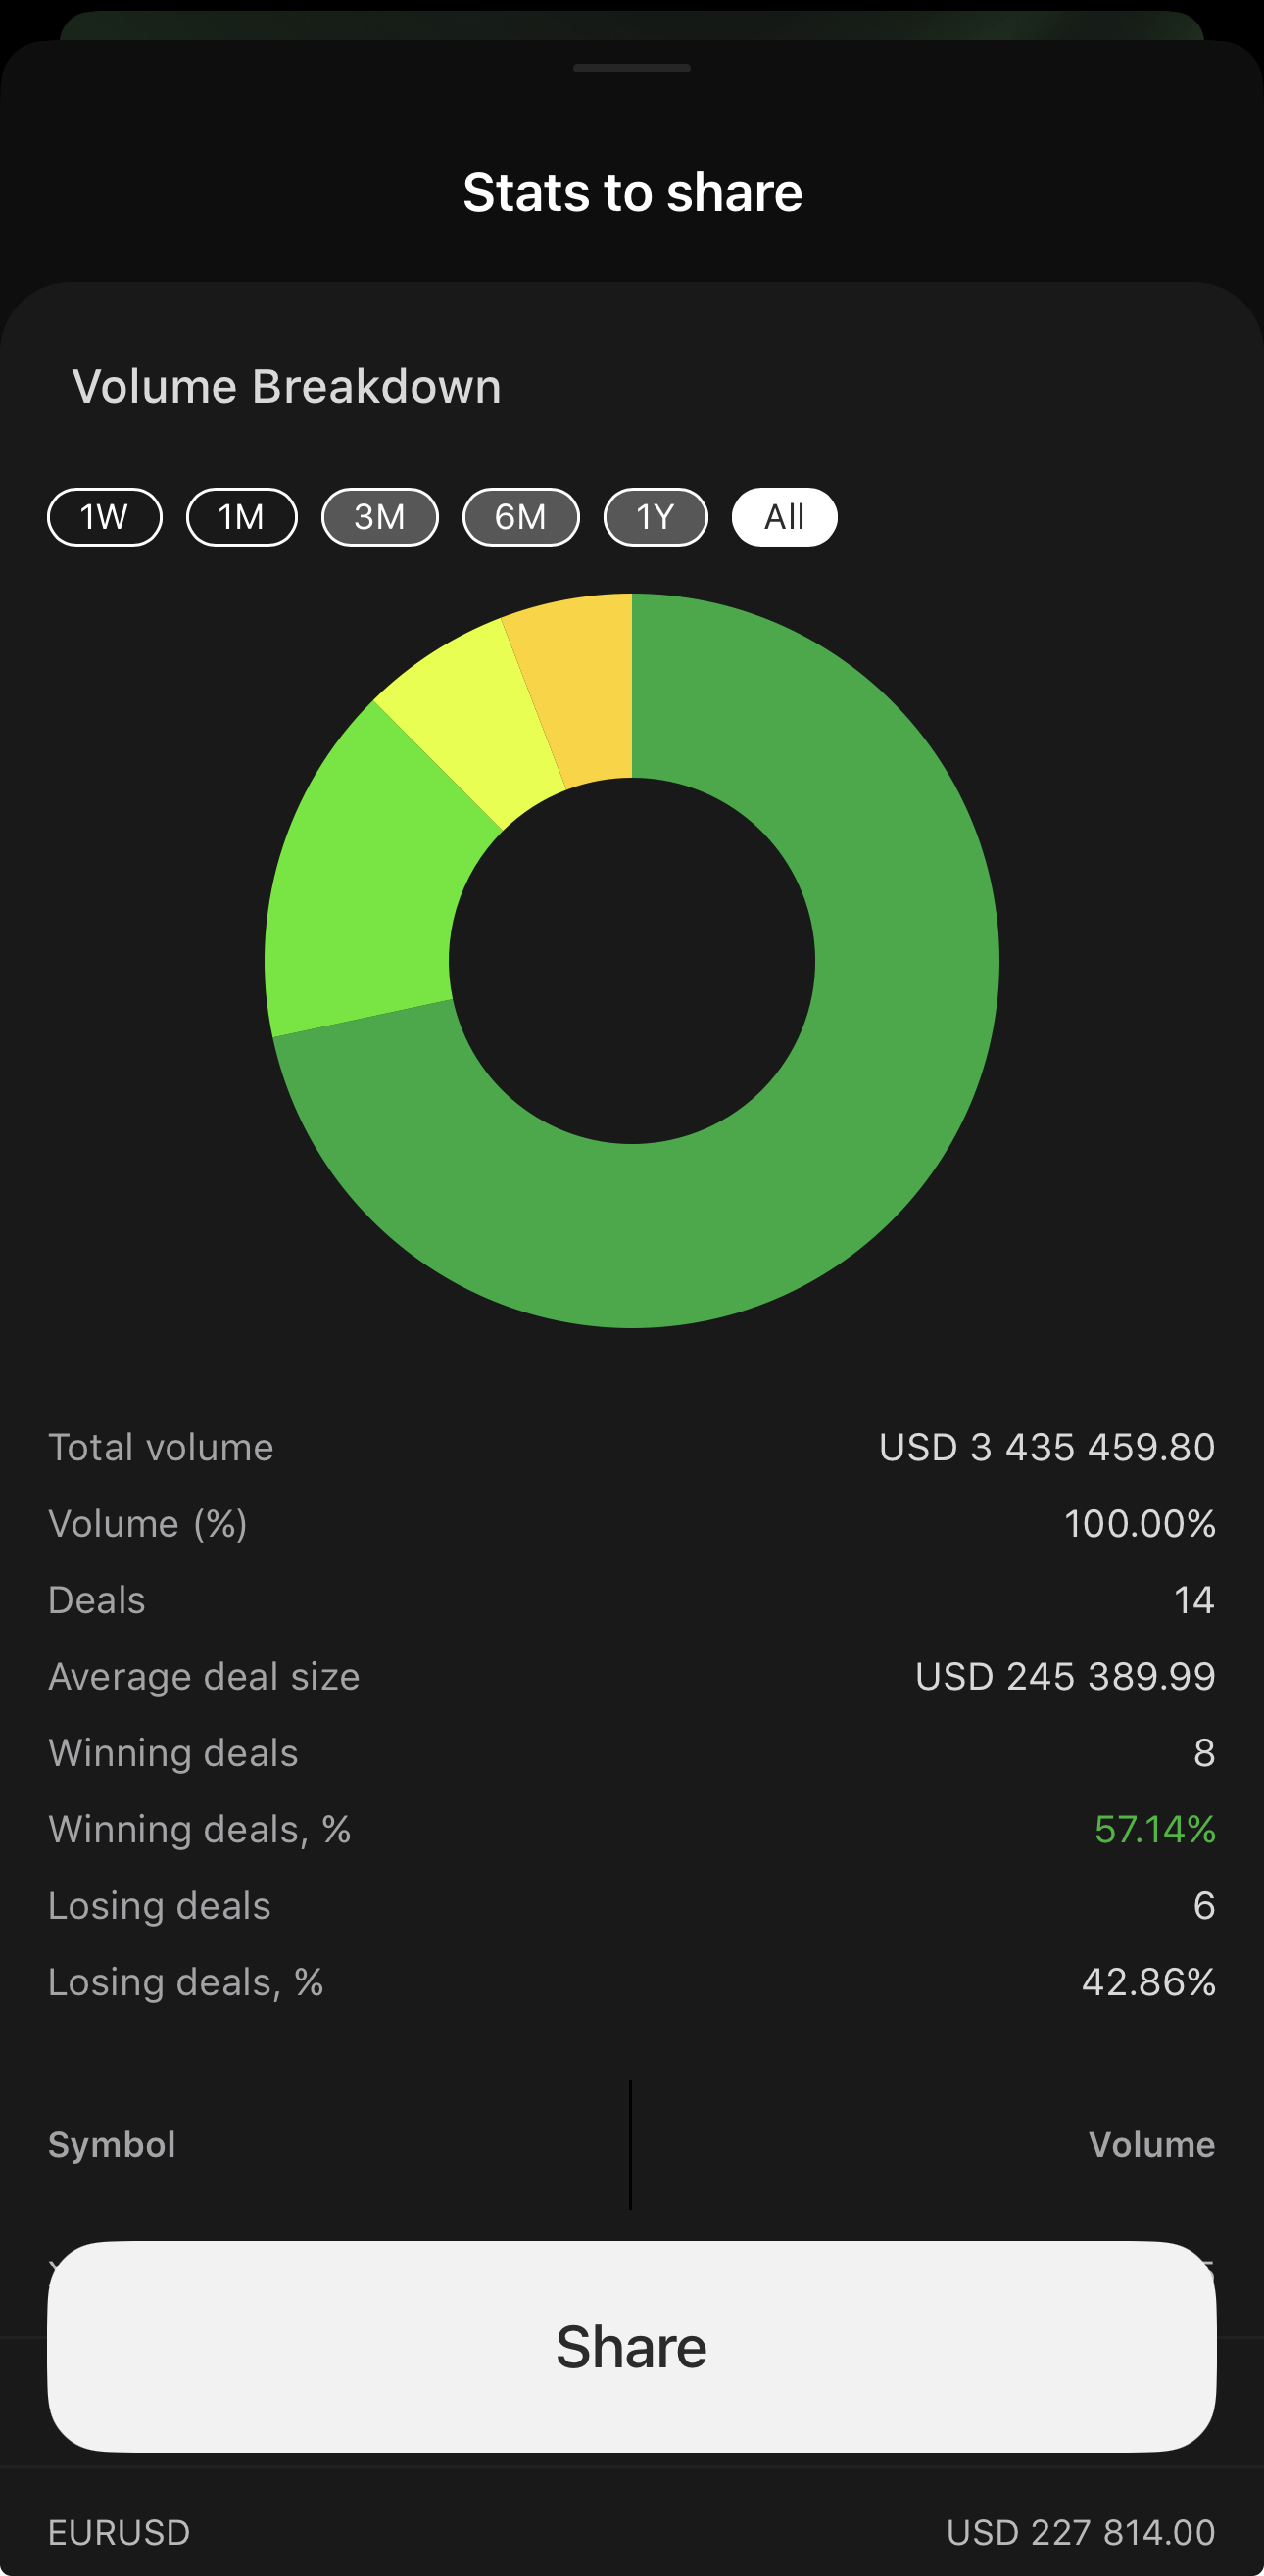
- Total volume – the value traded across the selected range.
- Volume (%) – the per-symbol shares added together.
- Deals – the number of deals making up that volume.
- Average deal size – the total volume divided by the number of deals.
- Winning deals – the number of winning deals.
- Winning deals, % – the same as a share.
- Losing deals – the number of losing deals.
- Losing deals, % – the same as a share.
A table underneath lists the volume traded per symbol.
The four following record lists show how many entries they hold. Deals, Symbols and History add a period selector, and tapping an entry in Symbols, Positions or History opens its full record.
Performance stats
Performance stats summarises deal outcomes.
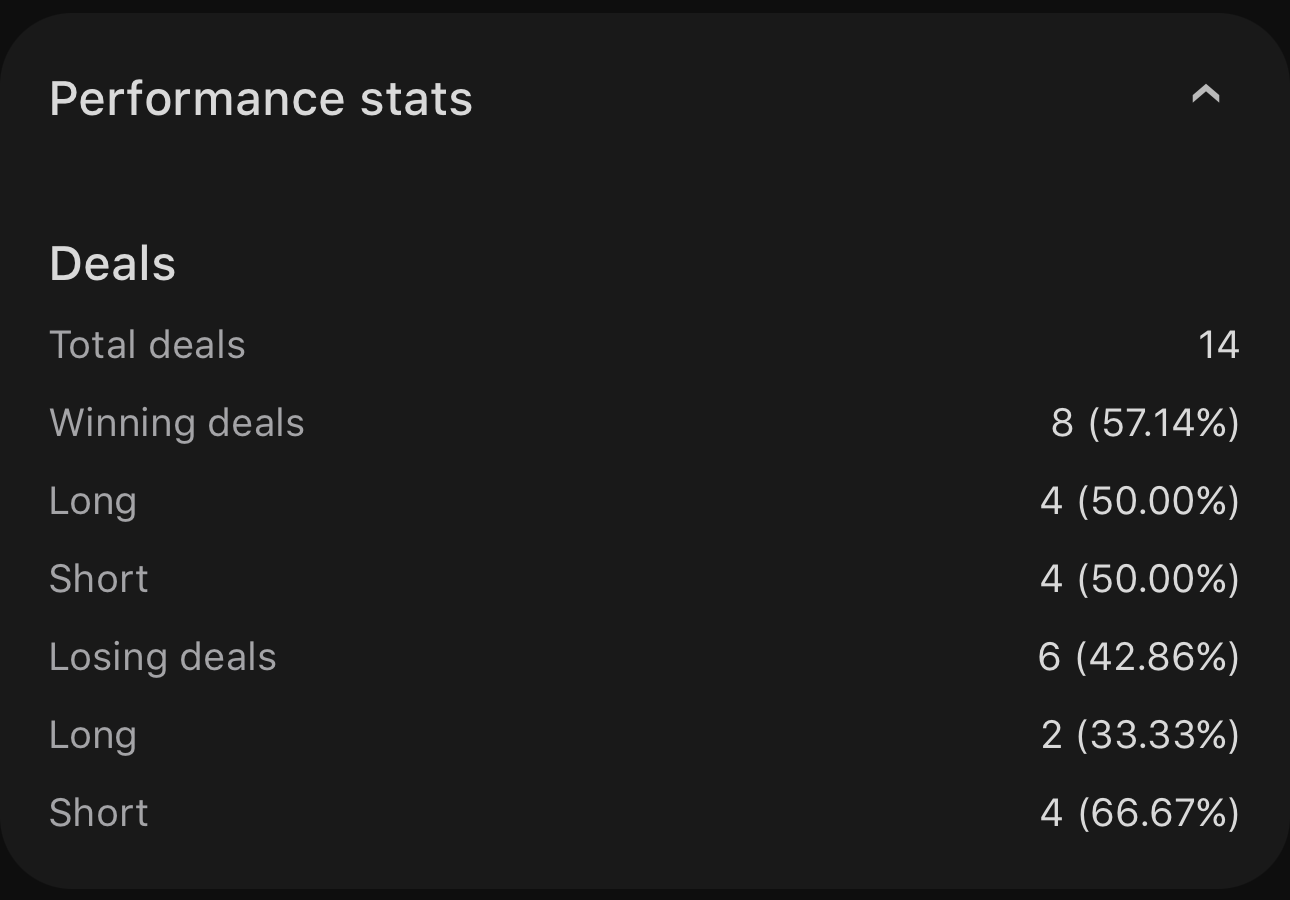
- Total deals – the number of deals on the account.
- Winning deals and Losing deals – how many closed each way, as a count and a percentage.
- Long and Short – the rows underneath each result, splitting it by direction.
Deals
Deals reports trading results for the selected period.
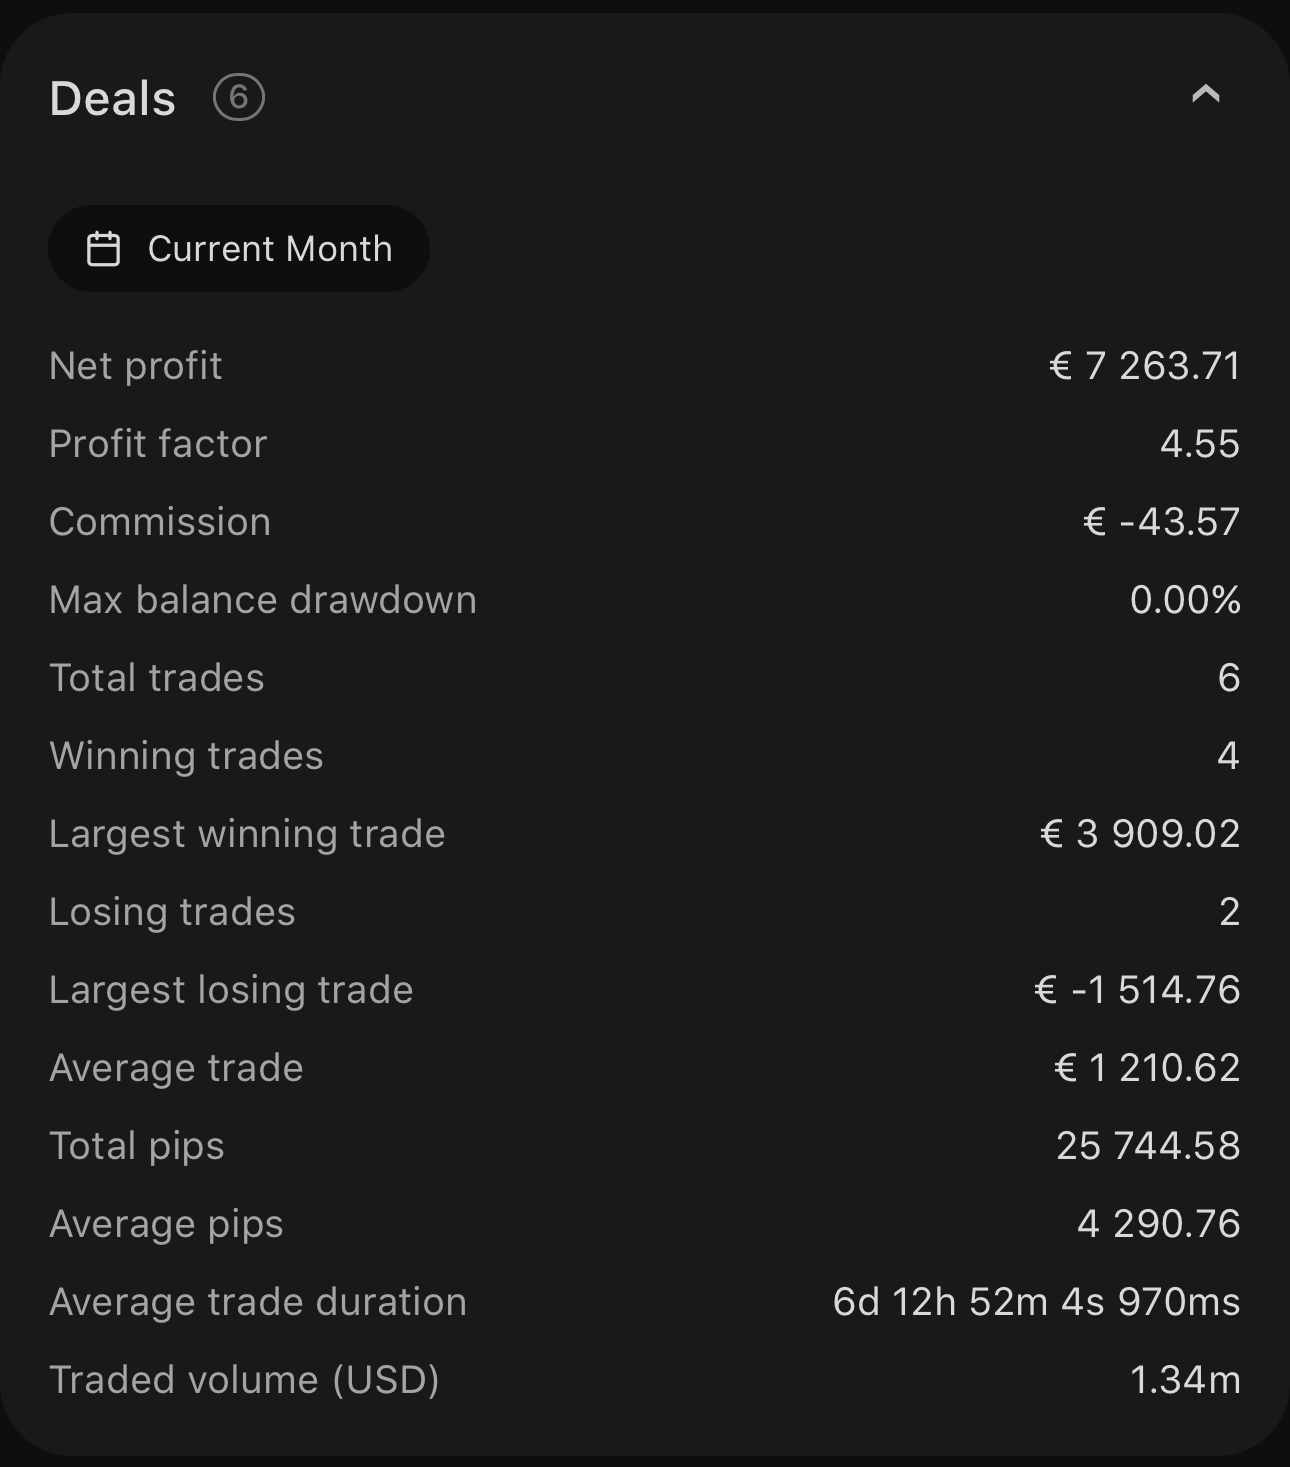
It carries Net profit, Profit factor and Max balance drawdown as Summary does, then the trade statistics the app reports per symbol, calculated here for the account over the period you choose.
Symbols
Symbols breaks the selected-period results down by instrument.
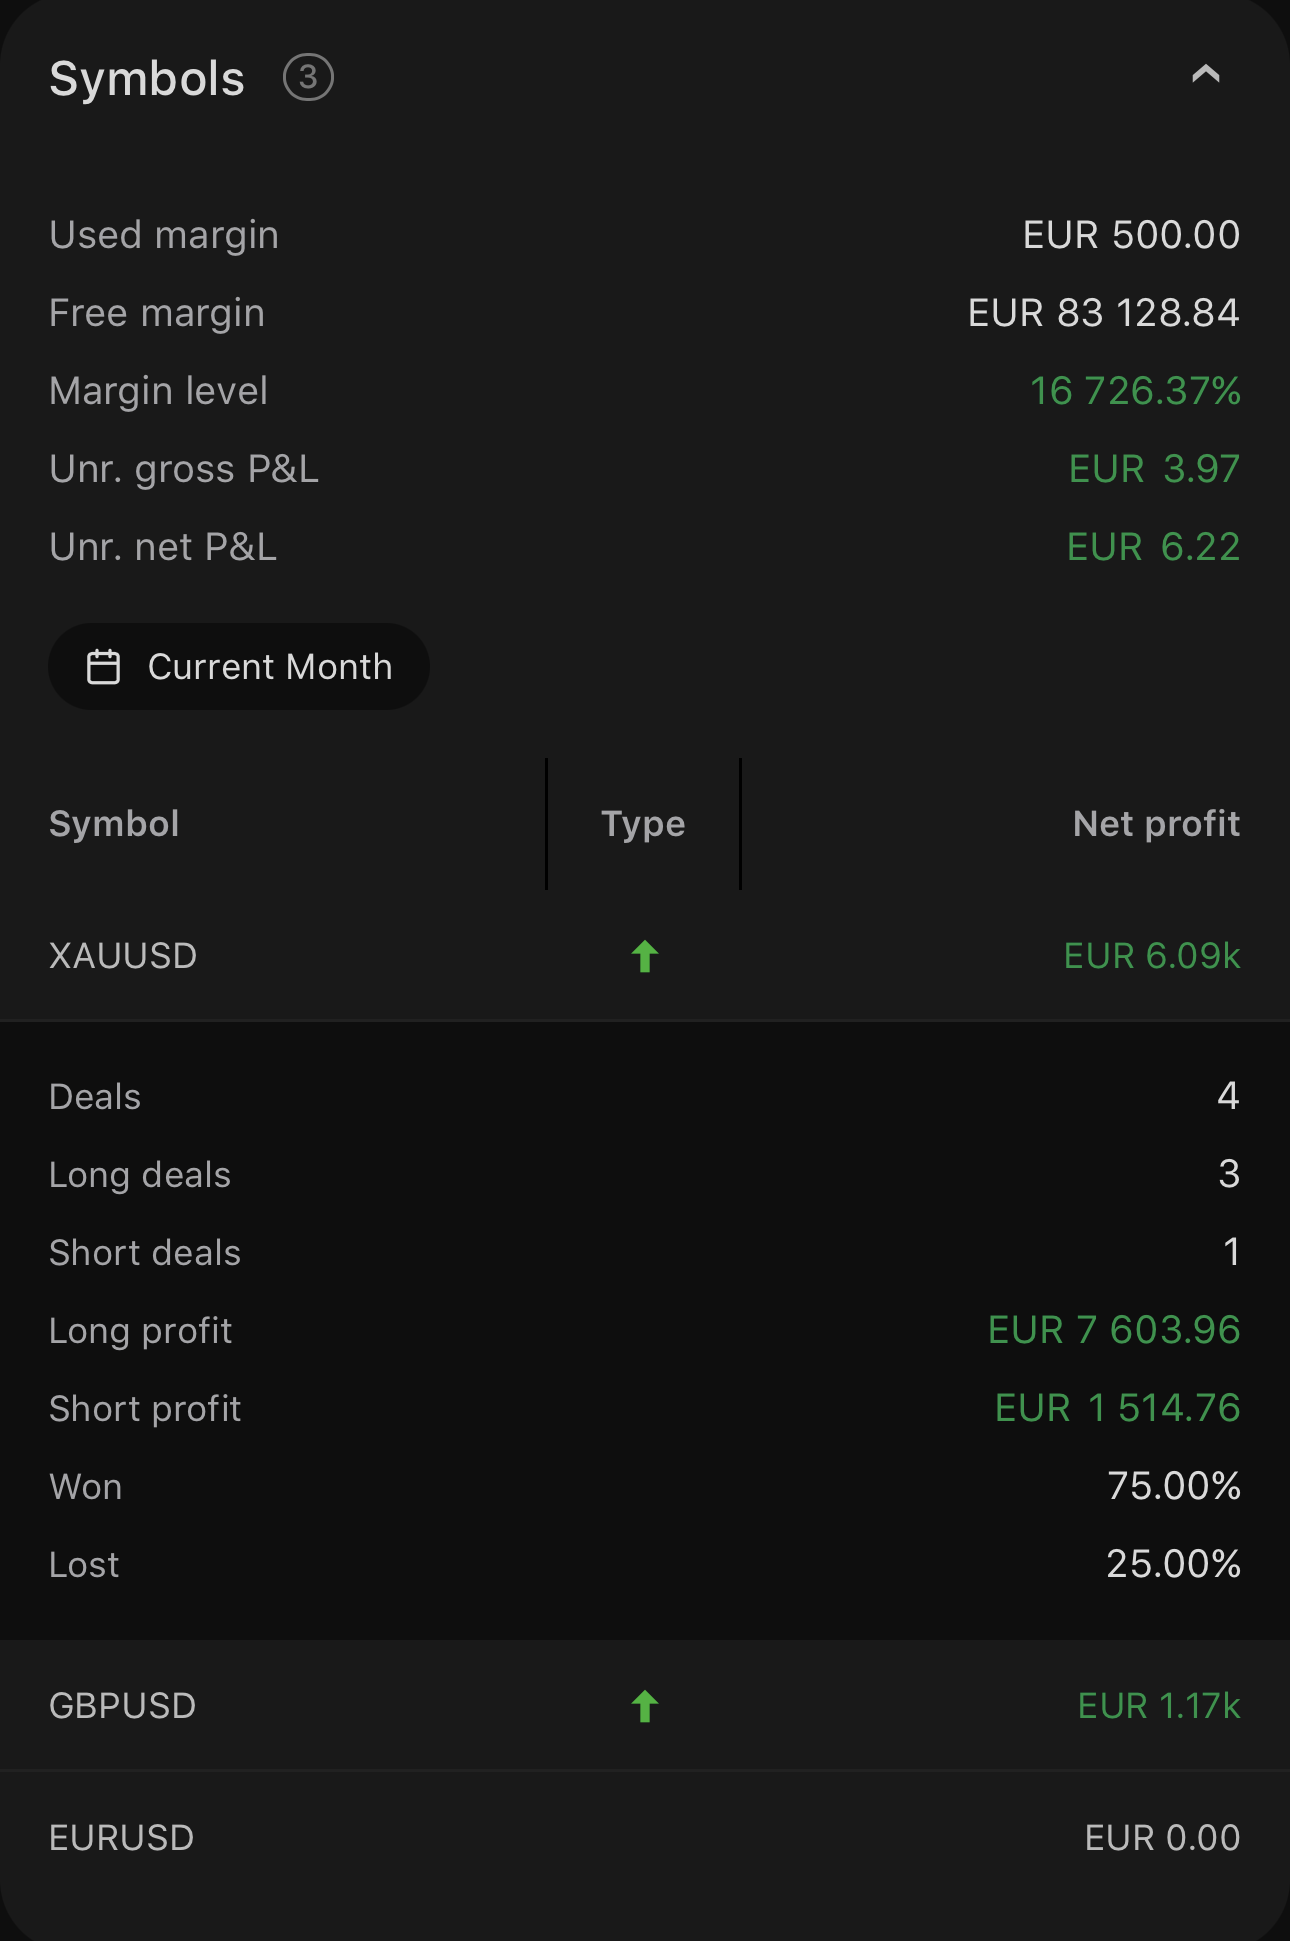
The snapshot above the symbol list repeats Used margin from Summary and adds:
- Free margin – the equity still available to open more.
- Margin level – equity against used margin, as a percentage.
- Unr. gross P&L and Unr. net P&L – the unrealised result of open positions before and after costs.
Each row carries the Symbol, its Type and its Net profit. Expanding a row adds:
- Deals – how many deals the symbol holds.
- Long deals and Short deals – that count split by direction.
- Long profit and Short profit – the result of each side.
- Won and Lost – how many deals ended each way.
Positions
Positions lists what is open on the account now and remains empty when nothing is open. Each row shows the symbol, direction and unrealised net result.
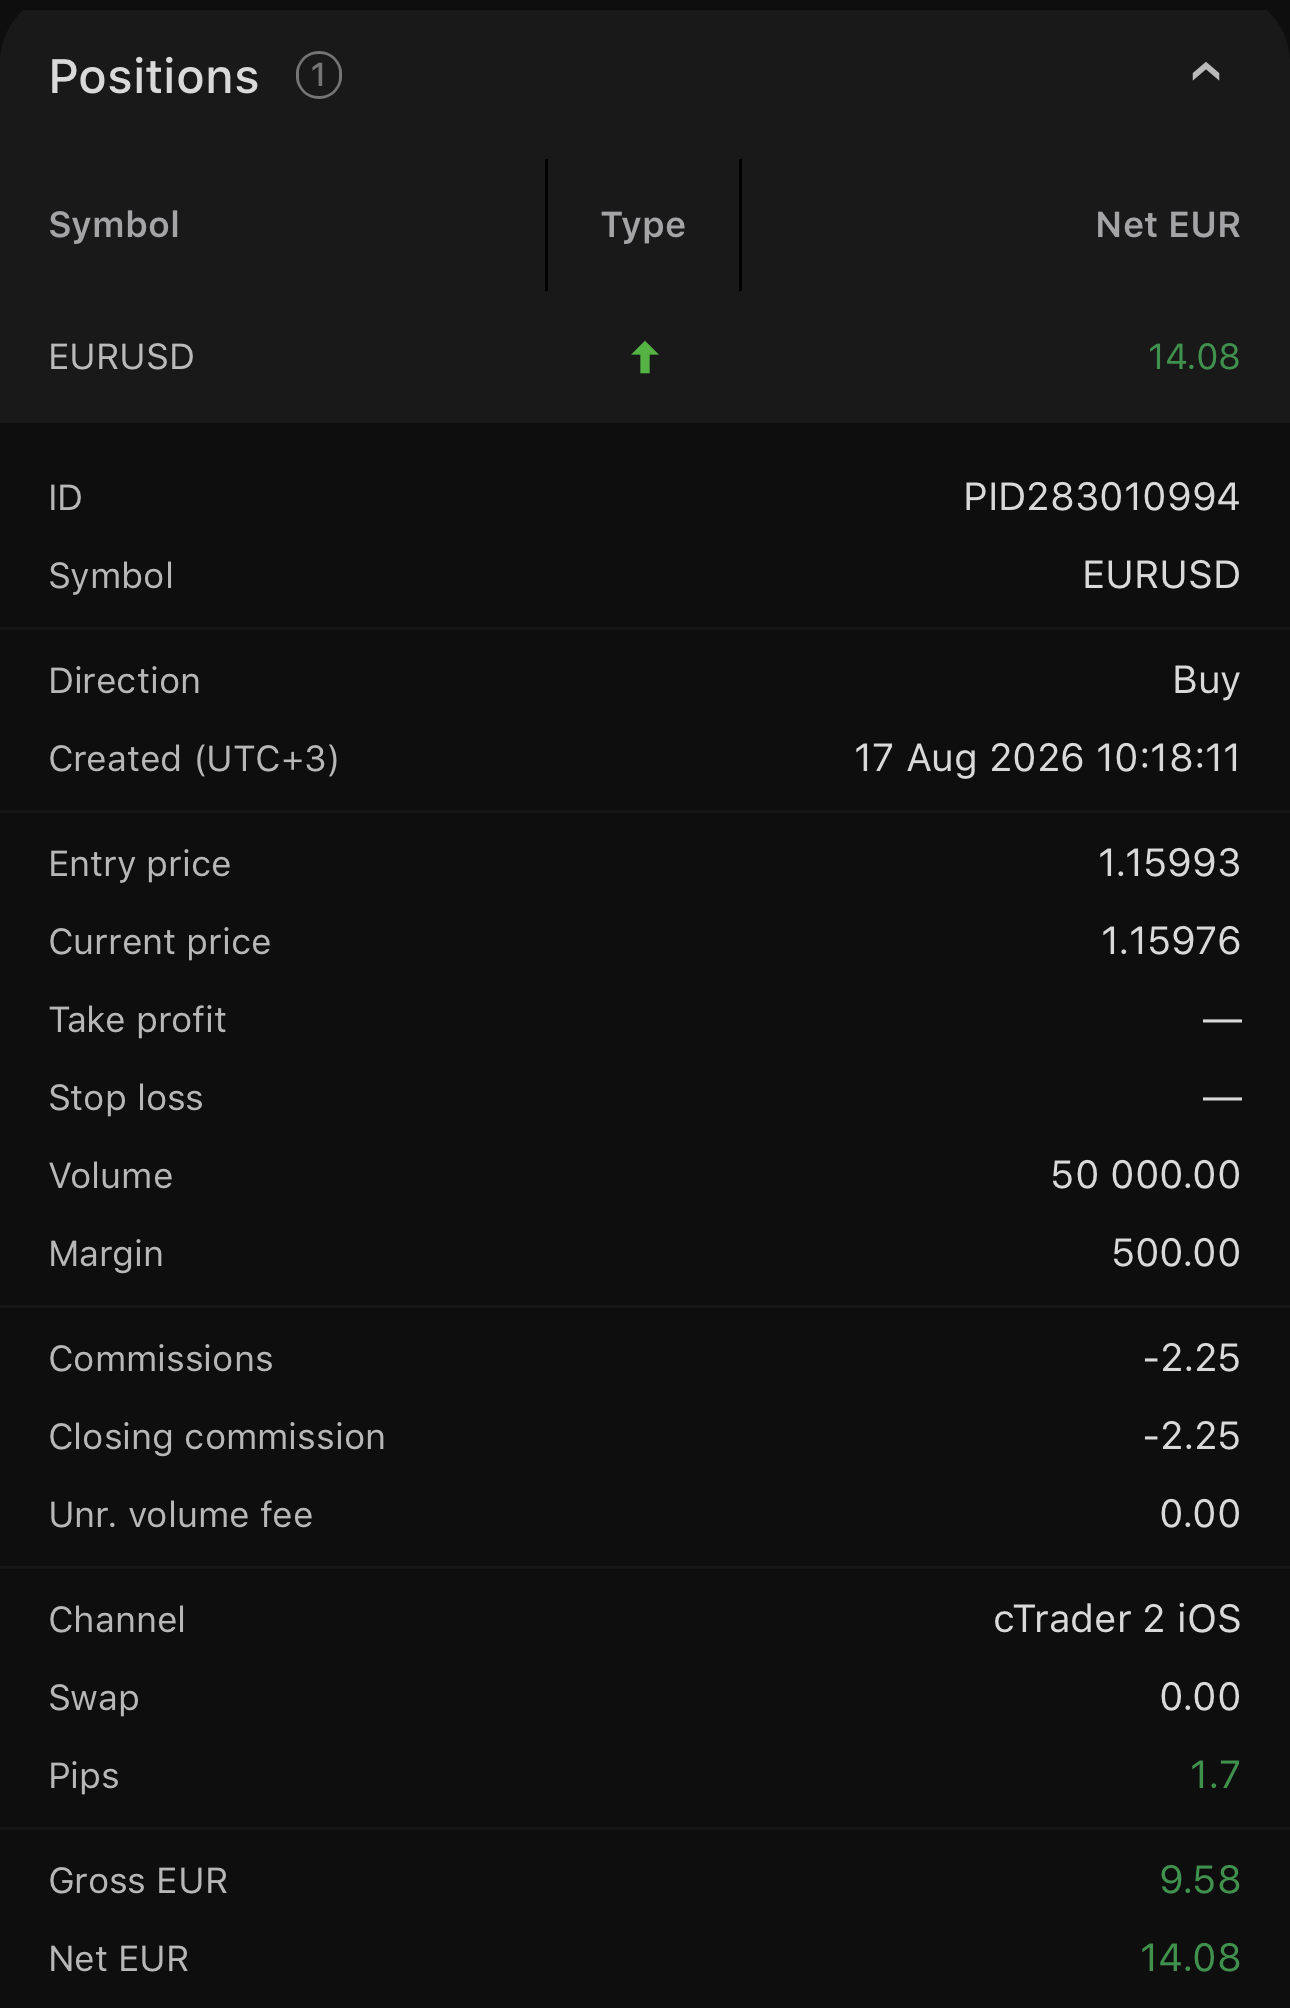
The expanded record adds:
- ID – the position identifier.
- Symbol – the instrument.
- Direction – buy or sell.
- Created – the date and time the position opened, with the UTC offset.
- Entry price and Current price – the price it opened at and the current one.
- Take profit and Stop loss – the protections set on it.
- Volume – the trade size.
- Margin – the funds committed to it.
- Commissions and Closing commission – charged so far and due on closing.
- Unr. volume fee – the volume fee accrued but not yet charged.
- Channel – the app the position was opened from.
- Swap – what holding it overnight has cost or paid.
- Pips – the move so far, in pips.
- Gross and Net – the unrealised result before and after costs.
History
History lists the closed deals for the selected period. Each row shows the symbol, direction and net result.
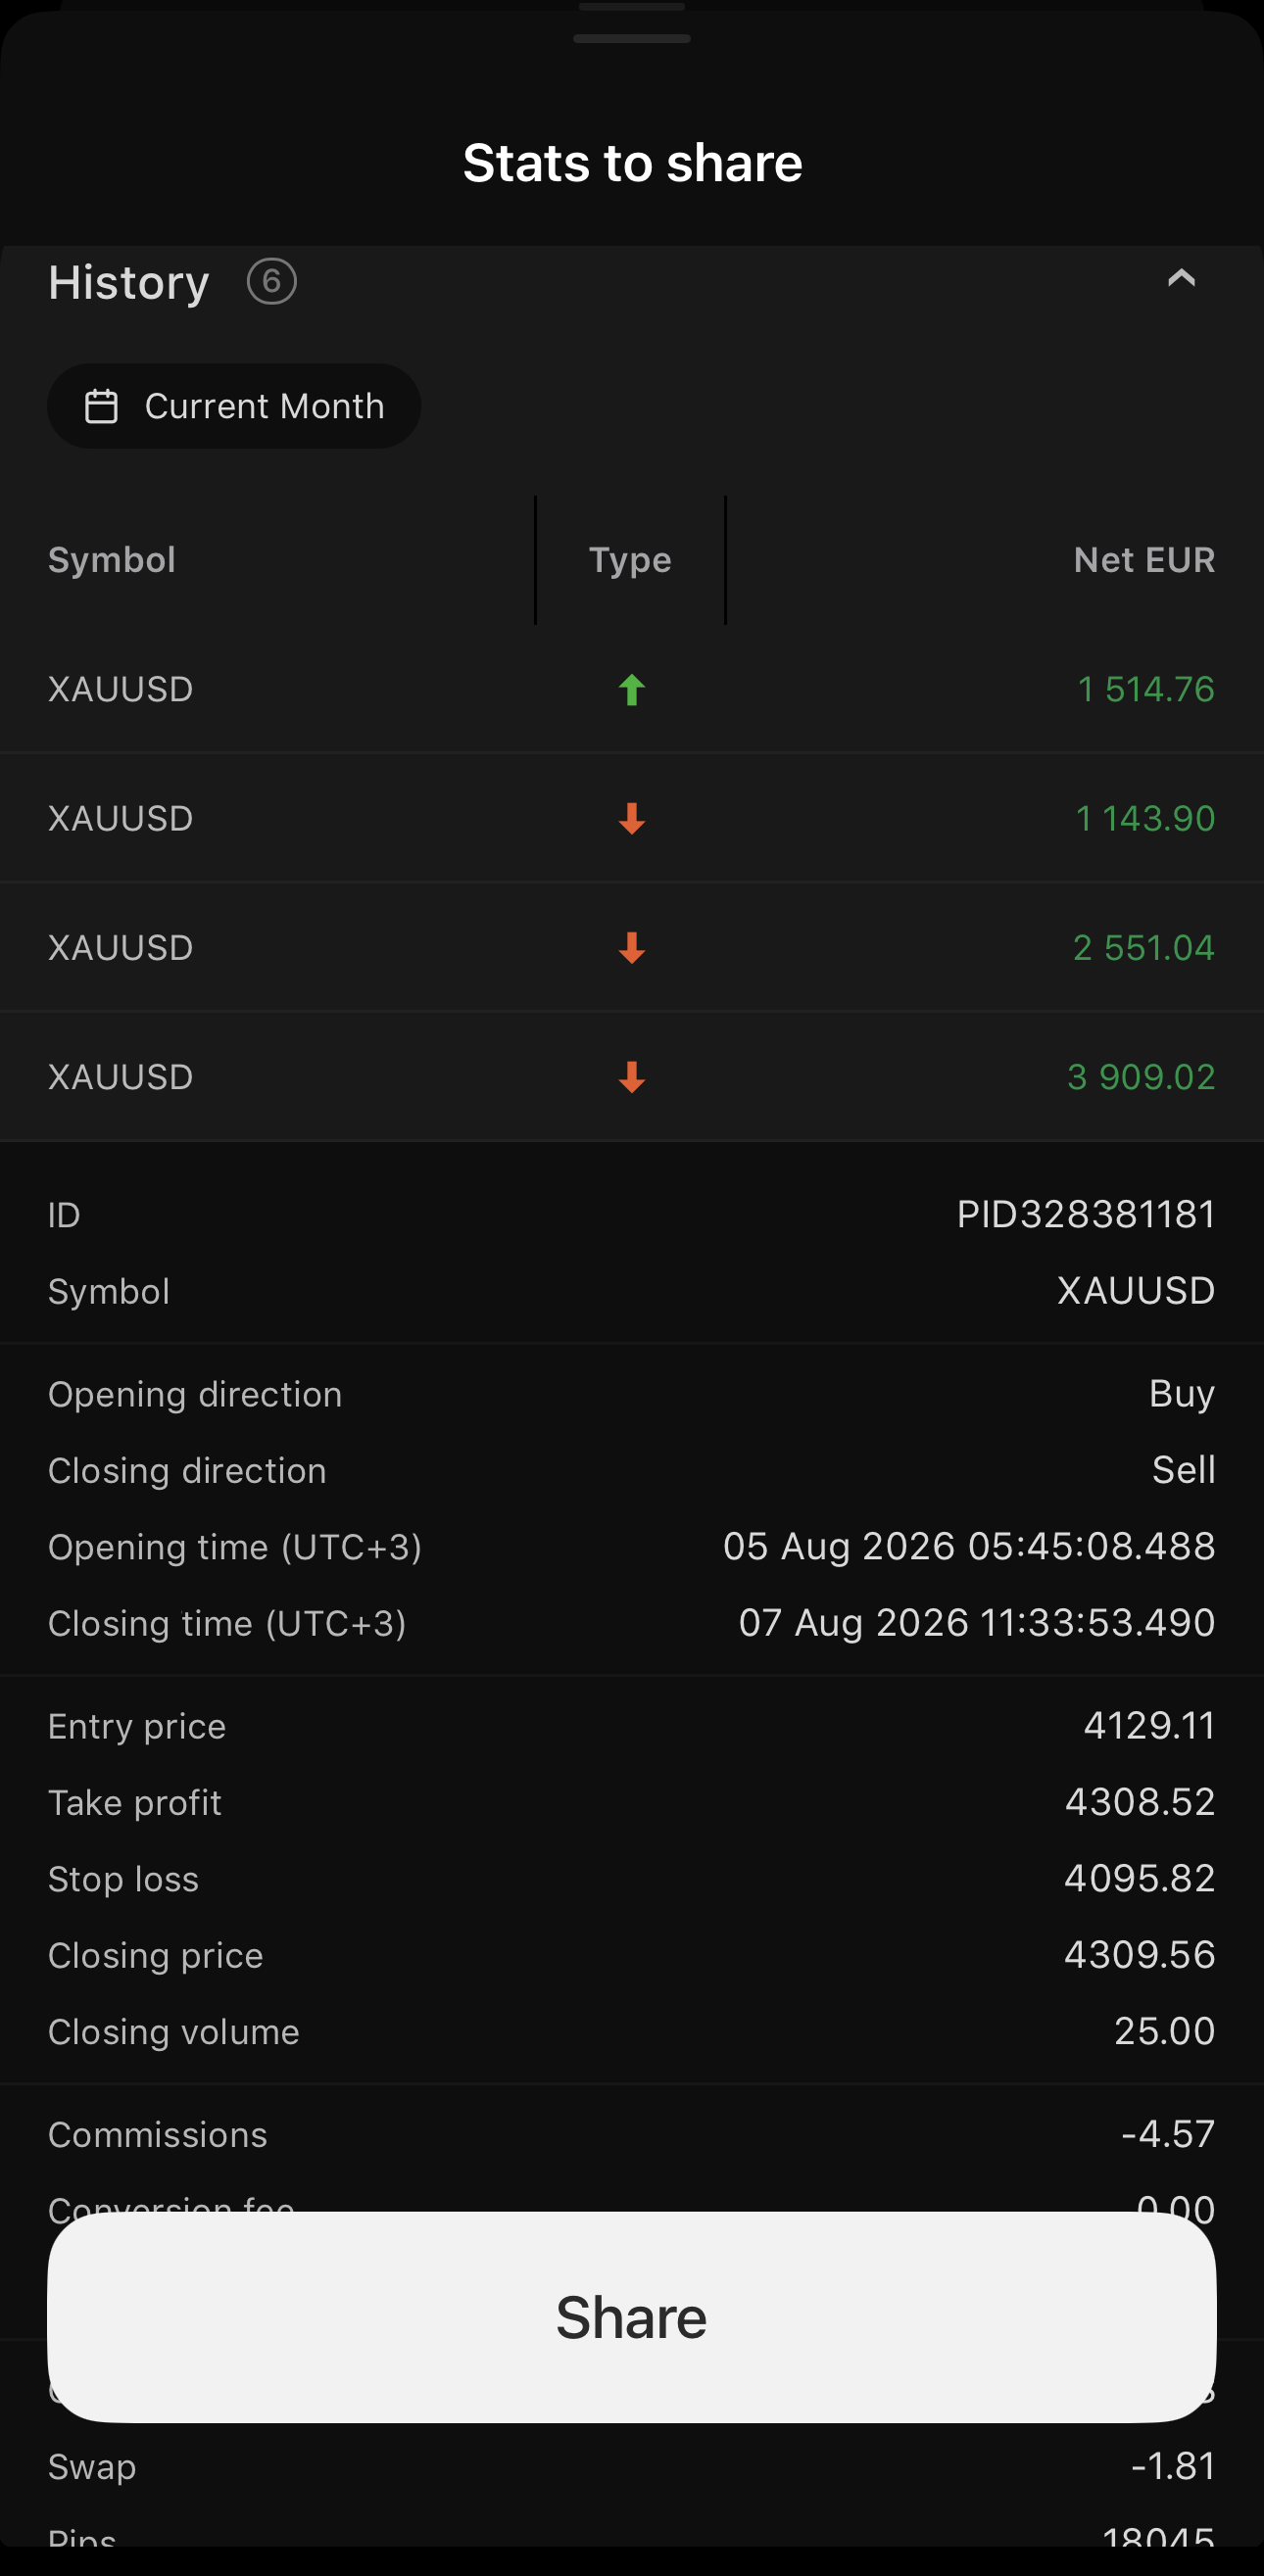
It repeats ID, Symbol, Entry price, Take profit, Stop loss, Commissions, Swap, Pips, Gross and Net from a position's record, realised here rather than unrealised, and adds:
- Opening direction and Closing direction – the side the deal opened and closed on.
- The opening and closing times, each with the UTC offset.
- Closing price – the price the deal closed at.
- Closing volume – the trade size the deal closed.
- Conversion fee – what it cost to convert into the account currency.
Stop sharing
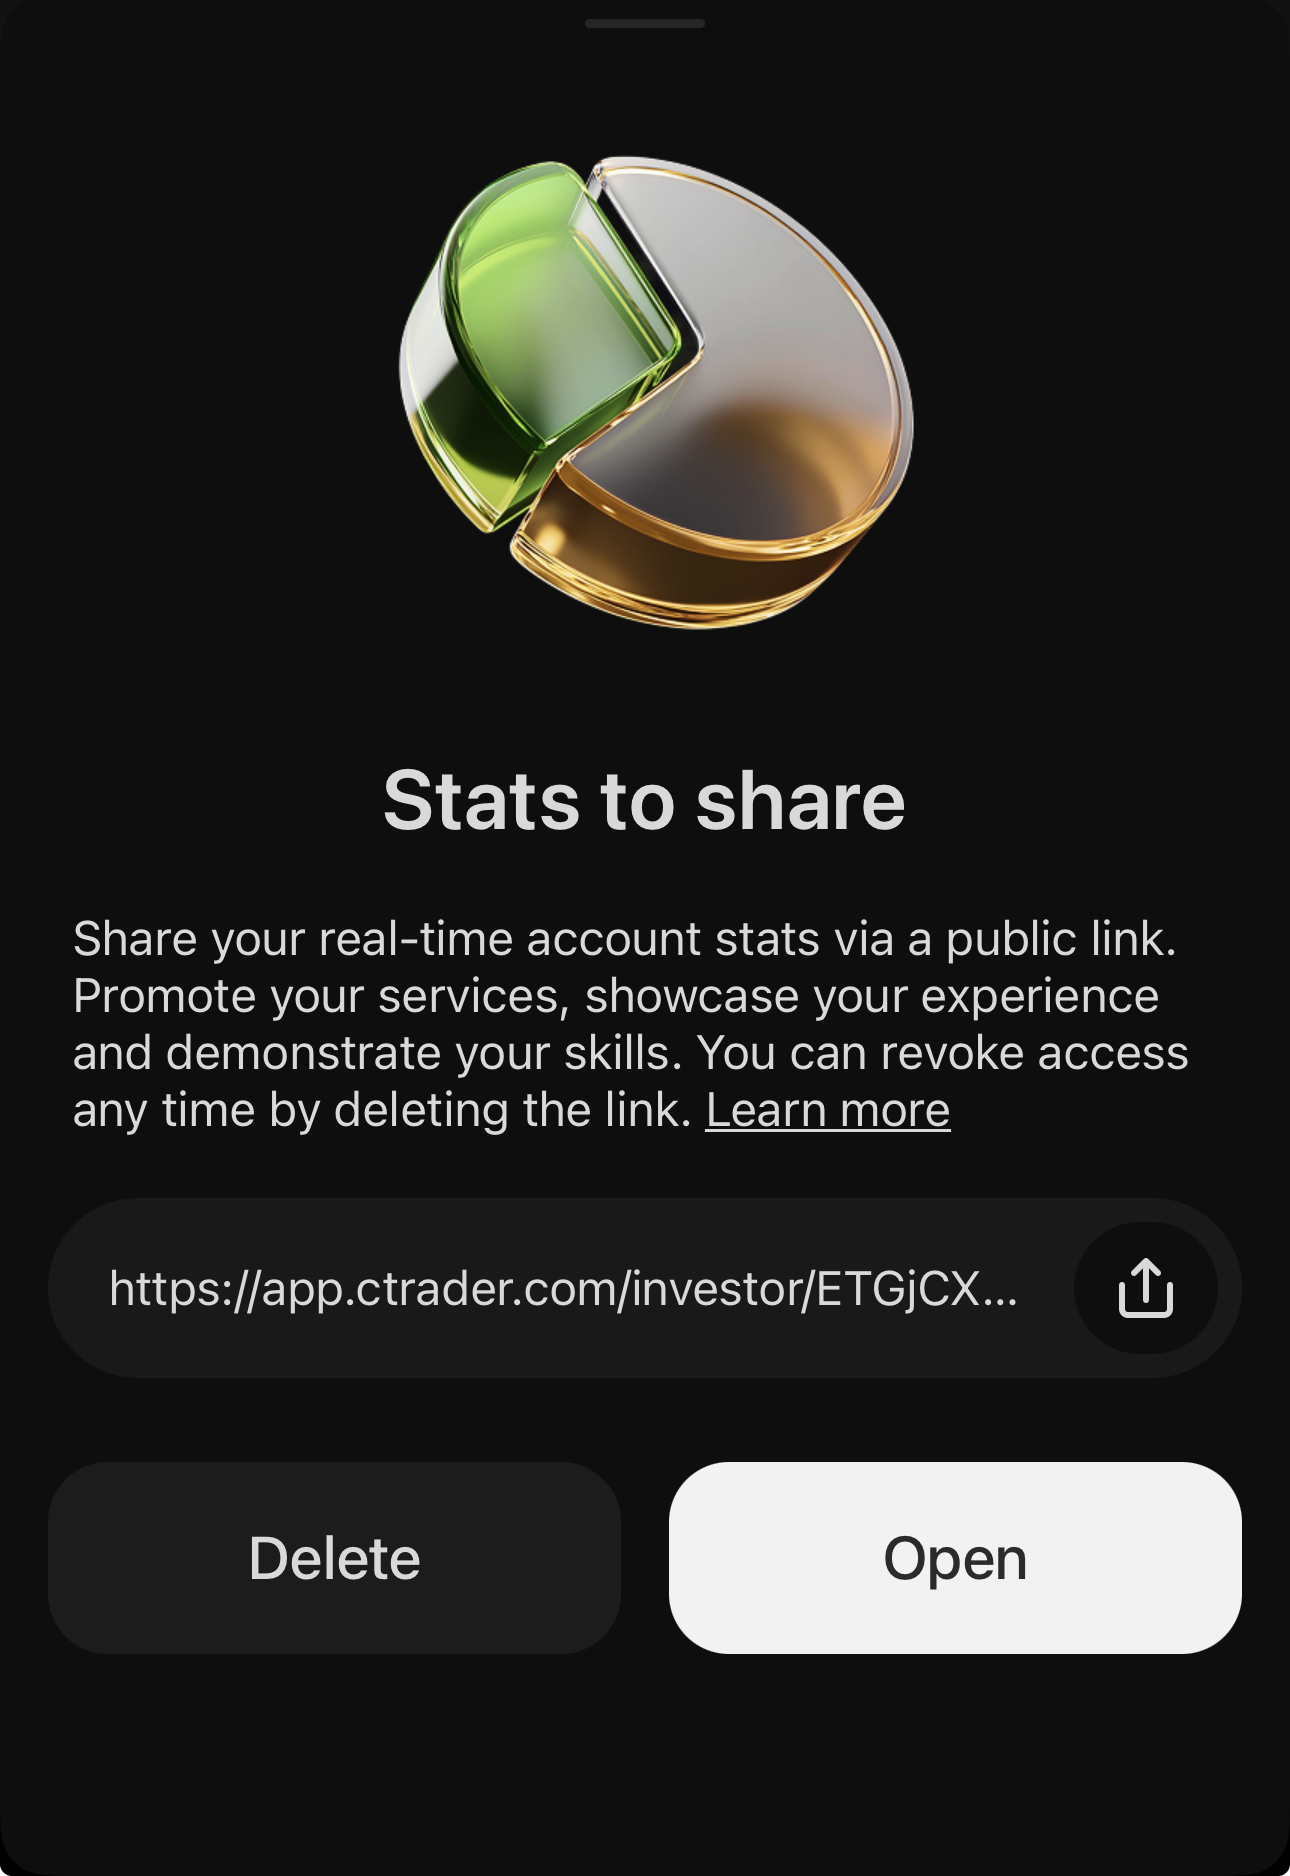
- Open Stats to share for the account.
- Tap Delete.
Deleting the link invalidates every copy you have sent. If you generate another link later, it has a new URL.