Symbol overview
The symbol overview gathers everything about a single symbol onto one screen: live prices, trading controls, chart preview, market data and the symbol's trading conditions.
To open it, tap a symbol in a watchlist or select one in the search in the top bar.
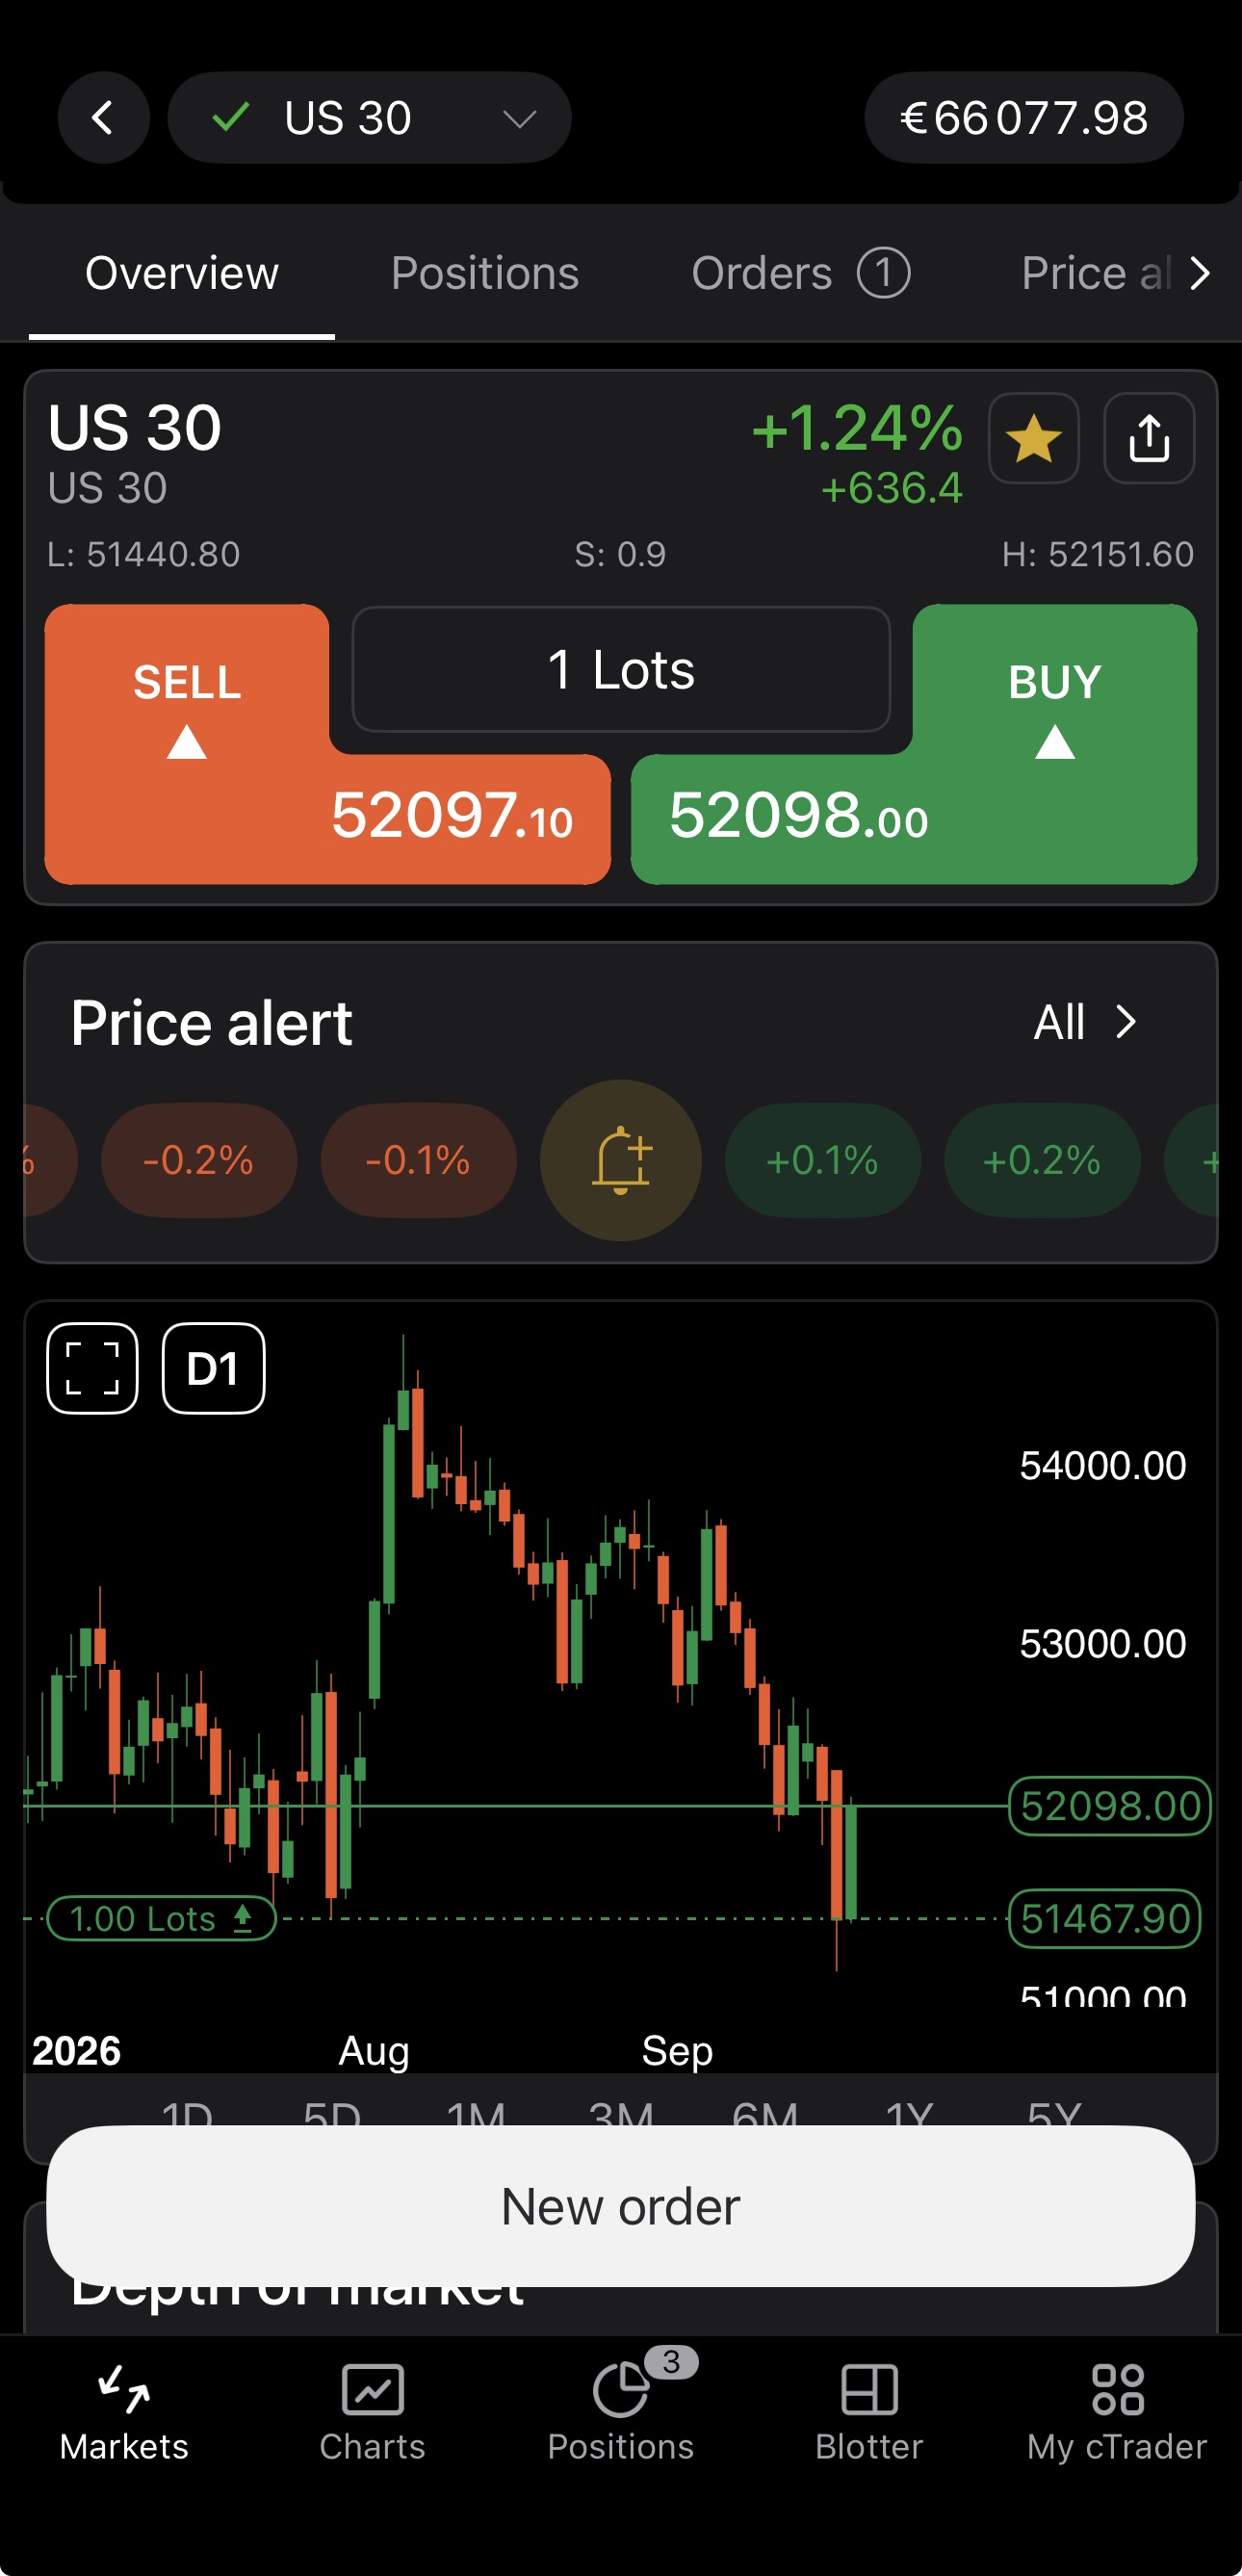
The screen opens on Overview. The other tabs to the right list only the items belonging to the current symbol: Positions, Orders, Price alerts and History.
The Overview tab is a vertical stack of blocks, described below in the order they appear. The New order button stays above the bottom bar as you scroll and opens the Place order menu.
Symbol
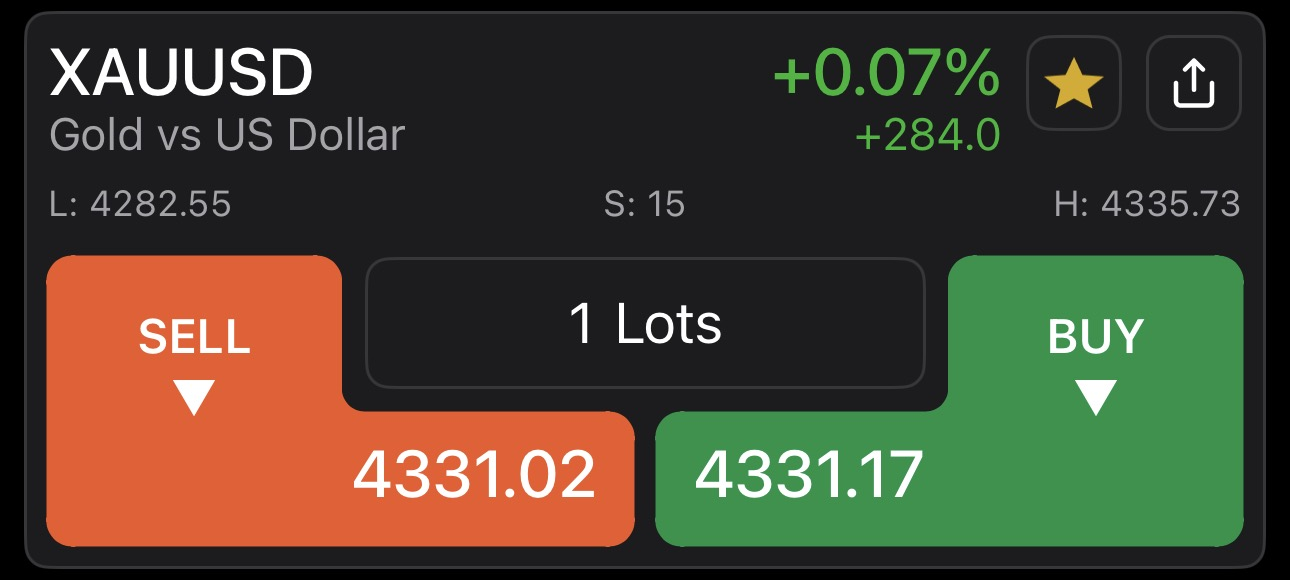
The Symbol section sits at the top of the Overview tab and carries the symbol's identity, its performance so far today and the controls for trading it.
The upper row shows the symbol with the full symbol name beneath it, and the day's change as both a percentage and a number of points. The change is green when the price has risen since the session opened and orange when it has fallen. Two buttons sit to the right:
- – add the symbol to any of your watchlists, or remove it.
- – share the symbol as a deeplink. Opening the link takes the recipient straight to the symbol in their own cTrader app.
The next row gives the day's range and the current cost of trading:
- L – the lowest price reached today.
- S – the current spread, in pips.
- H – the highest price reached today.
The bottom row holds the Sell and Buy buttons. Set the volume in the corresponding field in the middle, then tap Sell on the left or Buy on the right. Sell carries the bid price and Buy the ask. The arrow under each label shows which way that price last moved.
With Quick Trade on, the market order is placed immediately at the current price. These buttons place market orders only: unlike in chart trading, they cannot be dragged onto the price for a pending one. With Quick Trade off, the Place order screen opens instead.
Note
The Quick Trade options are set in Settings.
You can also trade the symbol from its chart. See Chart trading.
When the market is closed, the Sell and Buy controls are inactive.
Price alerts
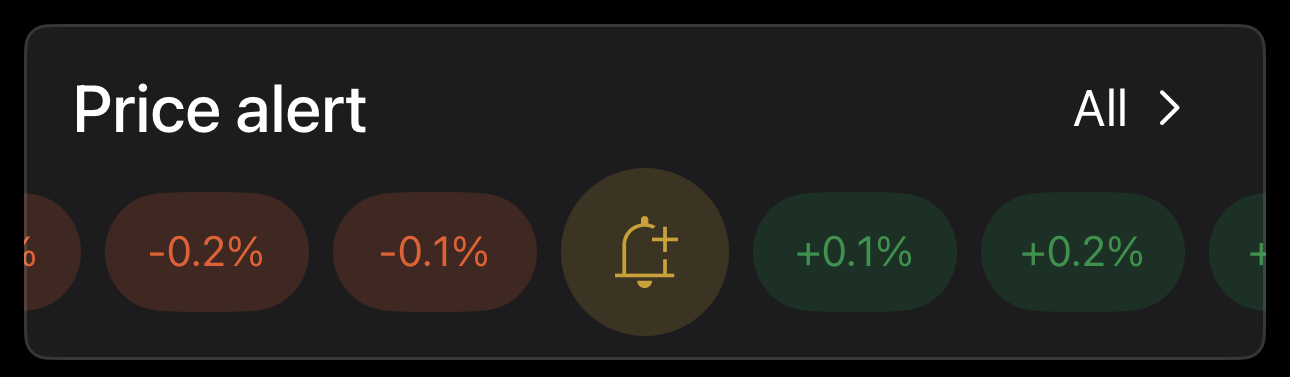
The Price alert block sets an alert on the symbol without leaving the Overview screen. It holds a row of preset buttons, each a percentage move from the current price. Orange is a fall (−0.1%), green a rise (+0.1%). Tap a preset to create the alert, or scroll the row sideways for larger moves.
Between the orange and green presets sits the (Add alert) button, which opens the full alert form for setting a custom price.
Tap All to open the Price alerts tab, which lists all alerts you have created for the symbol. You can also create an alert from there by tapping Create.
See Price alerts for details.
Chart preview
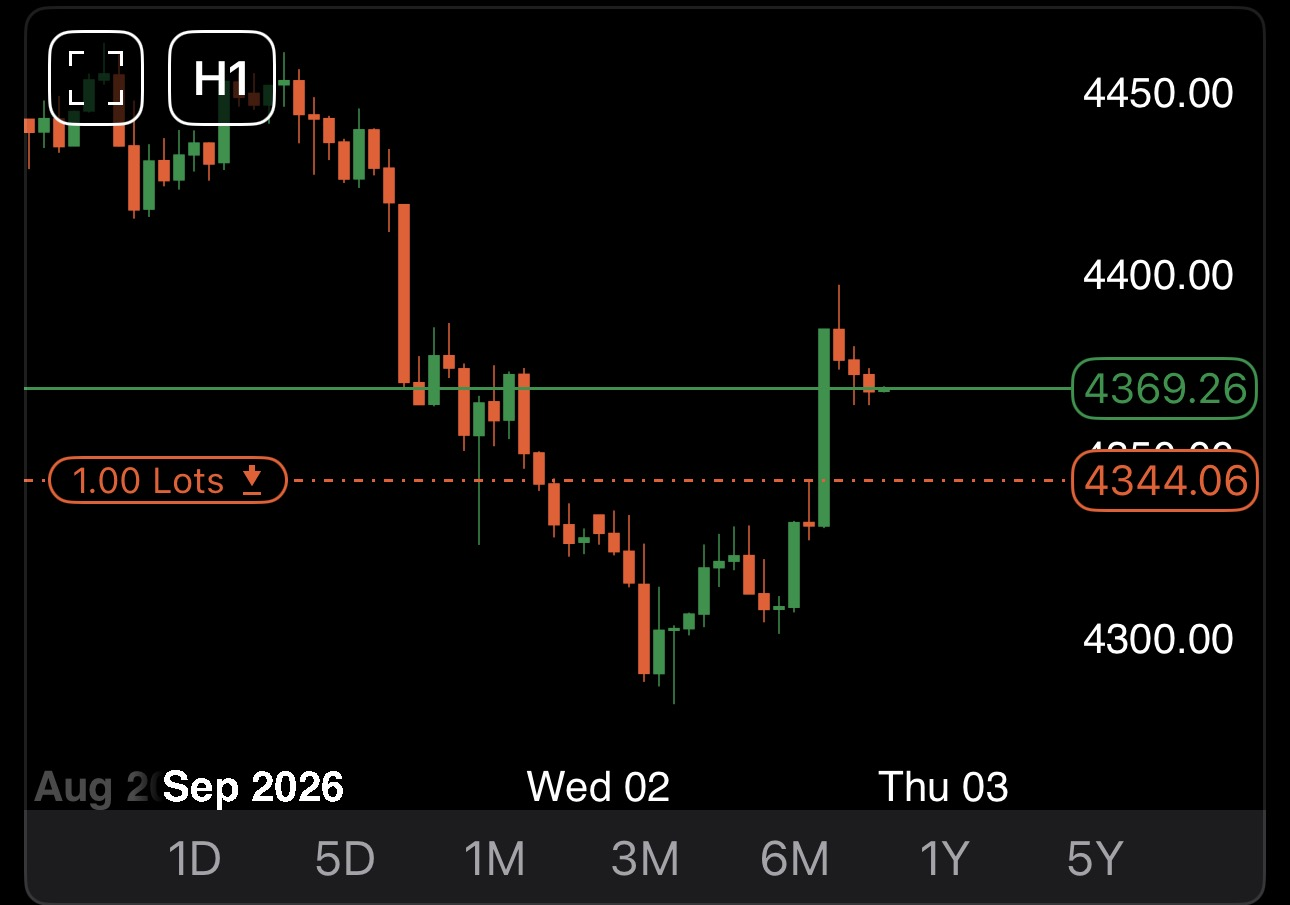
The chart preview reads the symbol's price movement without leaving the symbol overview. A coloured price level and bubble mark the live price.
It plots your positions, pending orders and protection levels for the symbol, so you can see where your trades sit relative to the current price. Whatever you have added to the symbol's chart in Charts appears here too: chart objects such as line studies and the risk-reward tool.
Two controls sit over the chart:
- – open the symbol in Charts, where the full chart toolbar is available – drawings, indicators, the risk-reward tool and chart settings. Tapping the chart does the same.
- Period – the period each bar currently represents. Tap it to open the period selector.
The date range beneath the chart preview (1D, 5D, 1M, 3M, 6M, 1Y and 5Y) sets how much history is visible, independently of the period.
See Chart trading to learn how to trade from a chart.
Period selector
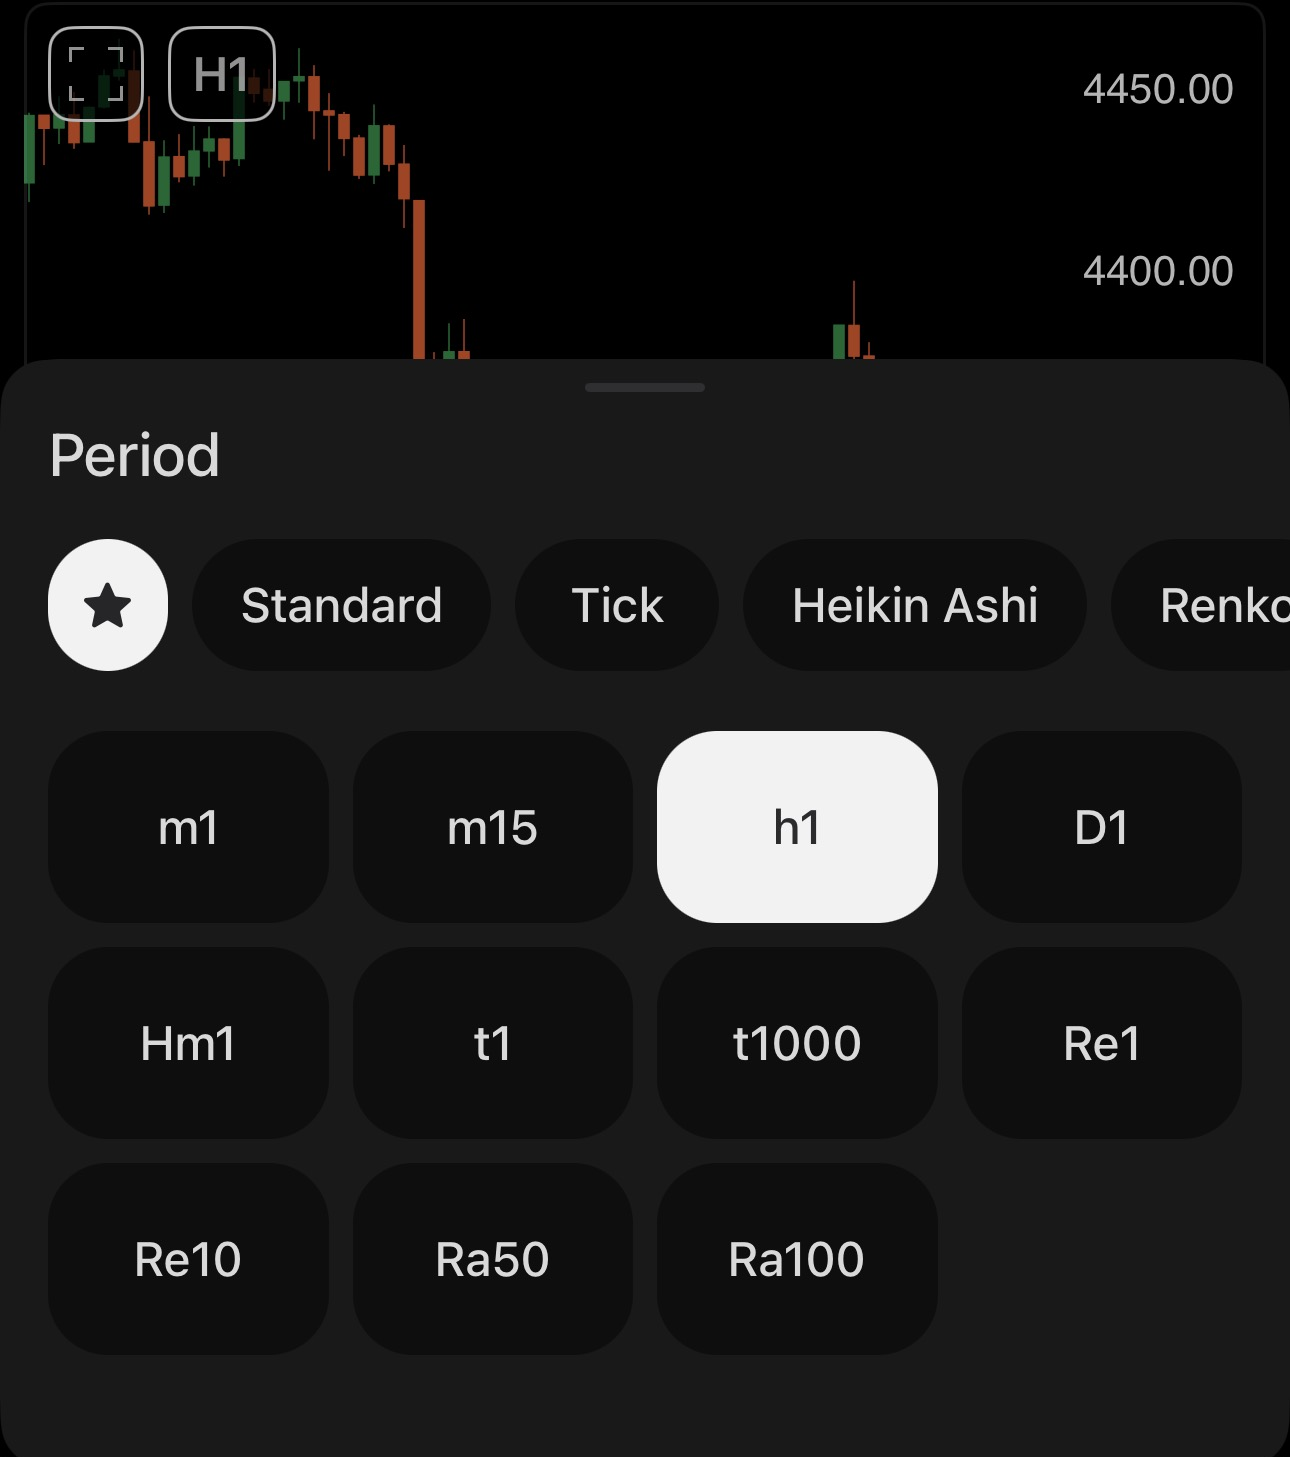
The period selector works the same way as in Charts.
Market sentiment
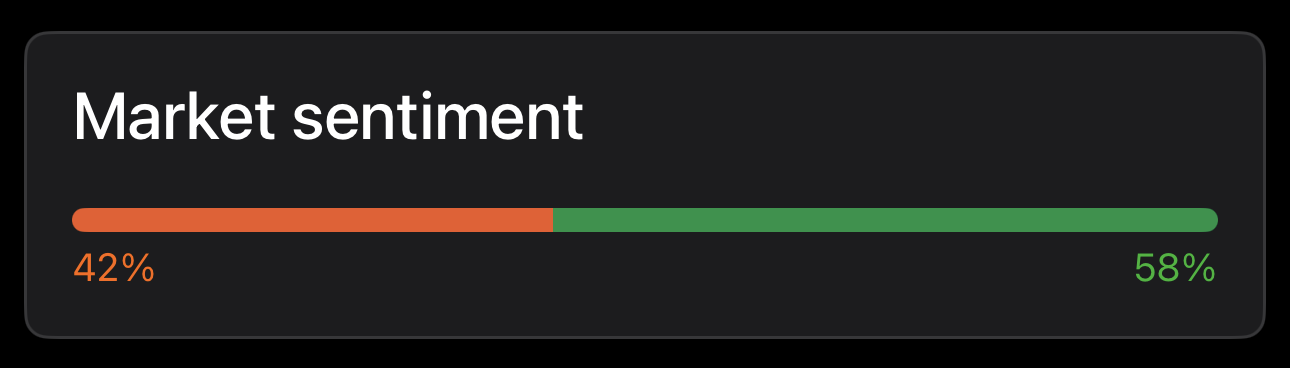
The Market sentiment block shows how other traders are positioned in the symbol: the percentage of cTrader accounts expecting the price to rise against the percentage expecting it to fall. The data is collected from all available cTrader servers, so it is cross-broker rather than limited to your own broker's clients.
See Market sentiment for details.
Depth of market
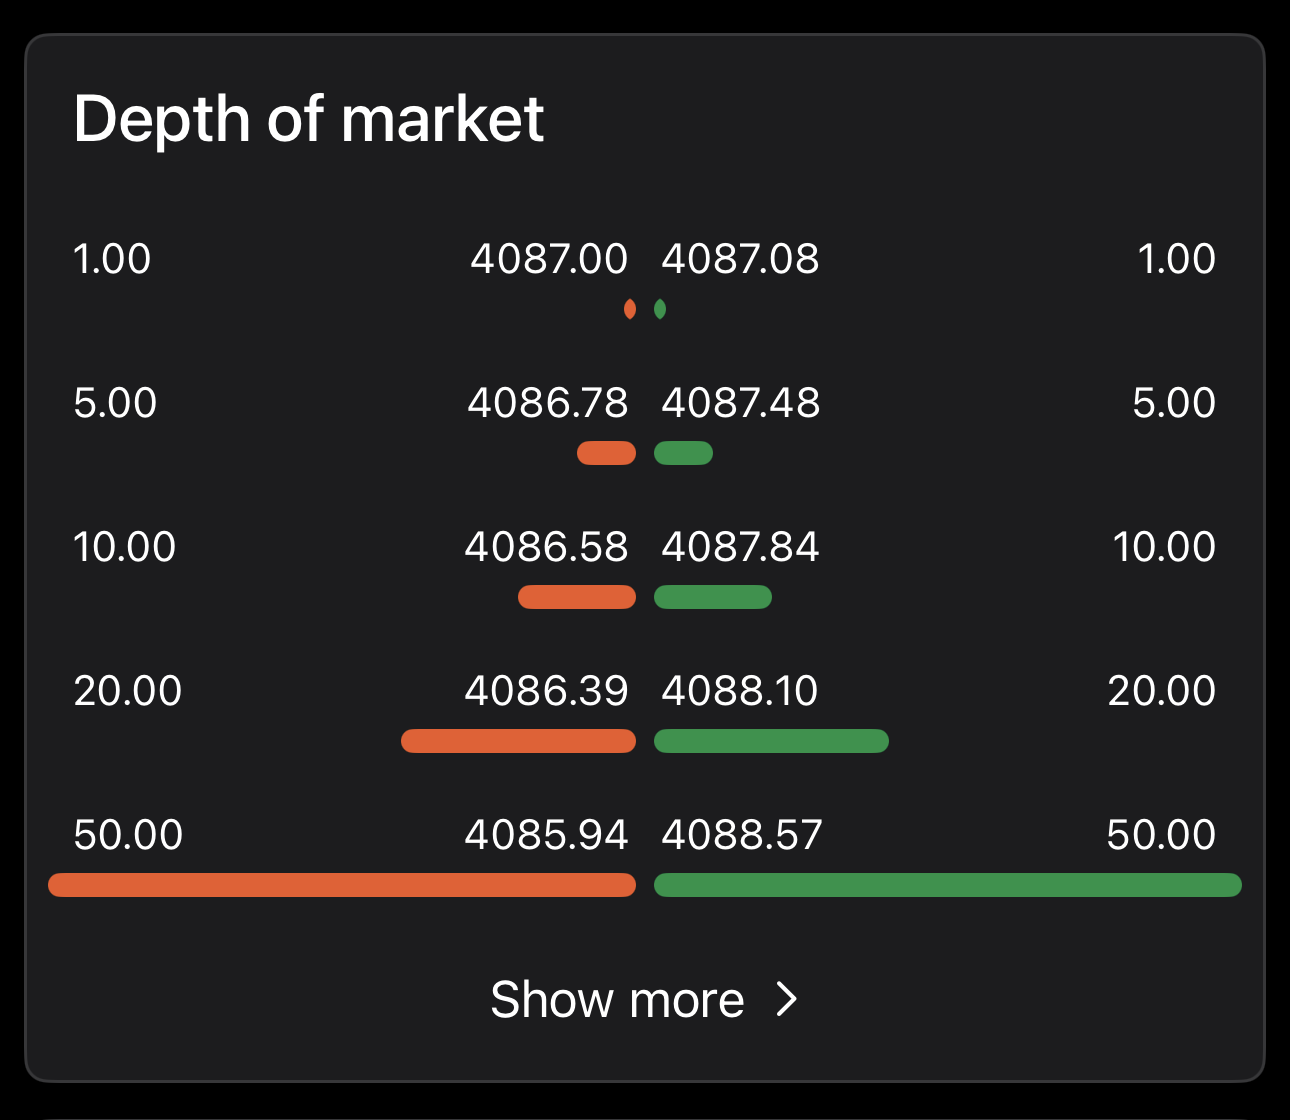
Depth of market measures the liquidity available for a symbol: the volume of buy and sell orders resting at each price level. The deeper the market, the more you can trade before your own order pushes the price against you.
The block presents this as a volume-weighted average price (VWAP) ladder. Each row is a trade size in lots, paired with the average price you would get for that size: sell on the left, buy on the right. The bars widen as the size grows, showing how much the fill worsens on a large order.
Tap Show more to open the ladder on its own screen. It shows the same information and lets you place an order from there, at the size you have just checked.
See Depth of market for details.
Economic calendar
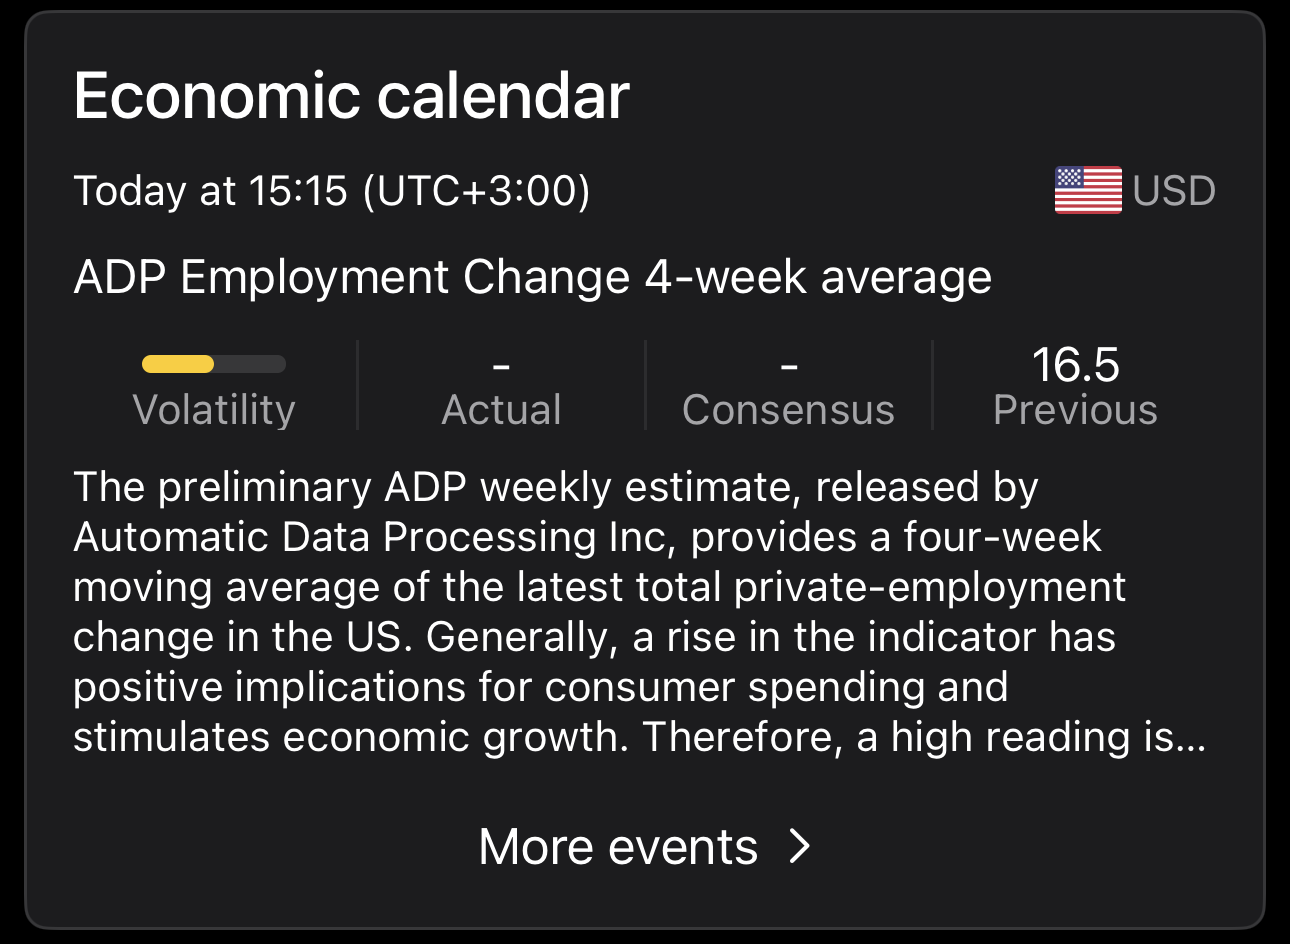
The economic calendar block carries the most recent event affecting the symbol:
- The date and time of the release, as well as the currency it concerns.
- The event title.
- Volatility, Actual, Consensus and Previous – the same figures the economic calendar in My cTrader defines.
- A description of the release and what its readings suggest.
Tap the event to open it on its own Event details screen and read the full event description.
Tap More events for the full calendar, where a filter narrows the list by period.
Note
This block covers the current symbol only. For every symbol, see economic calendar events in Blotter.
Technical analysis by Autochartist
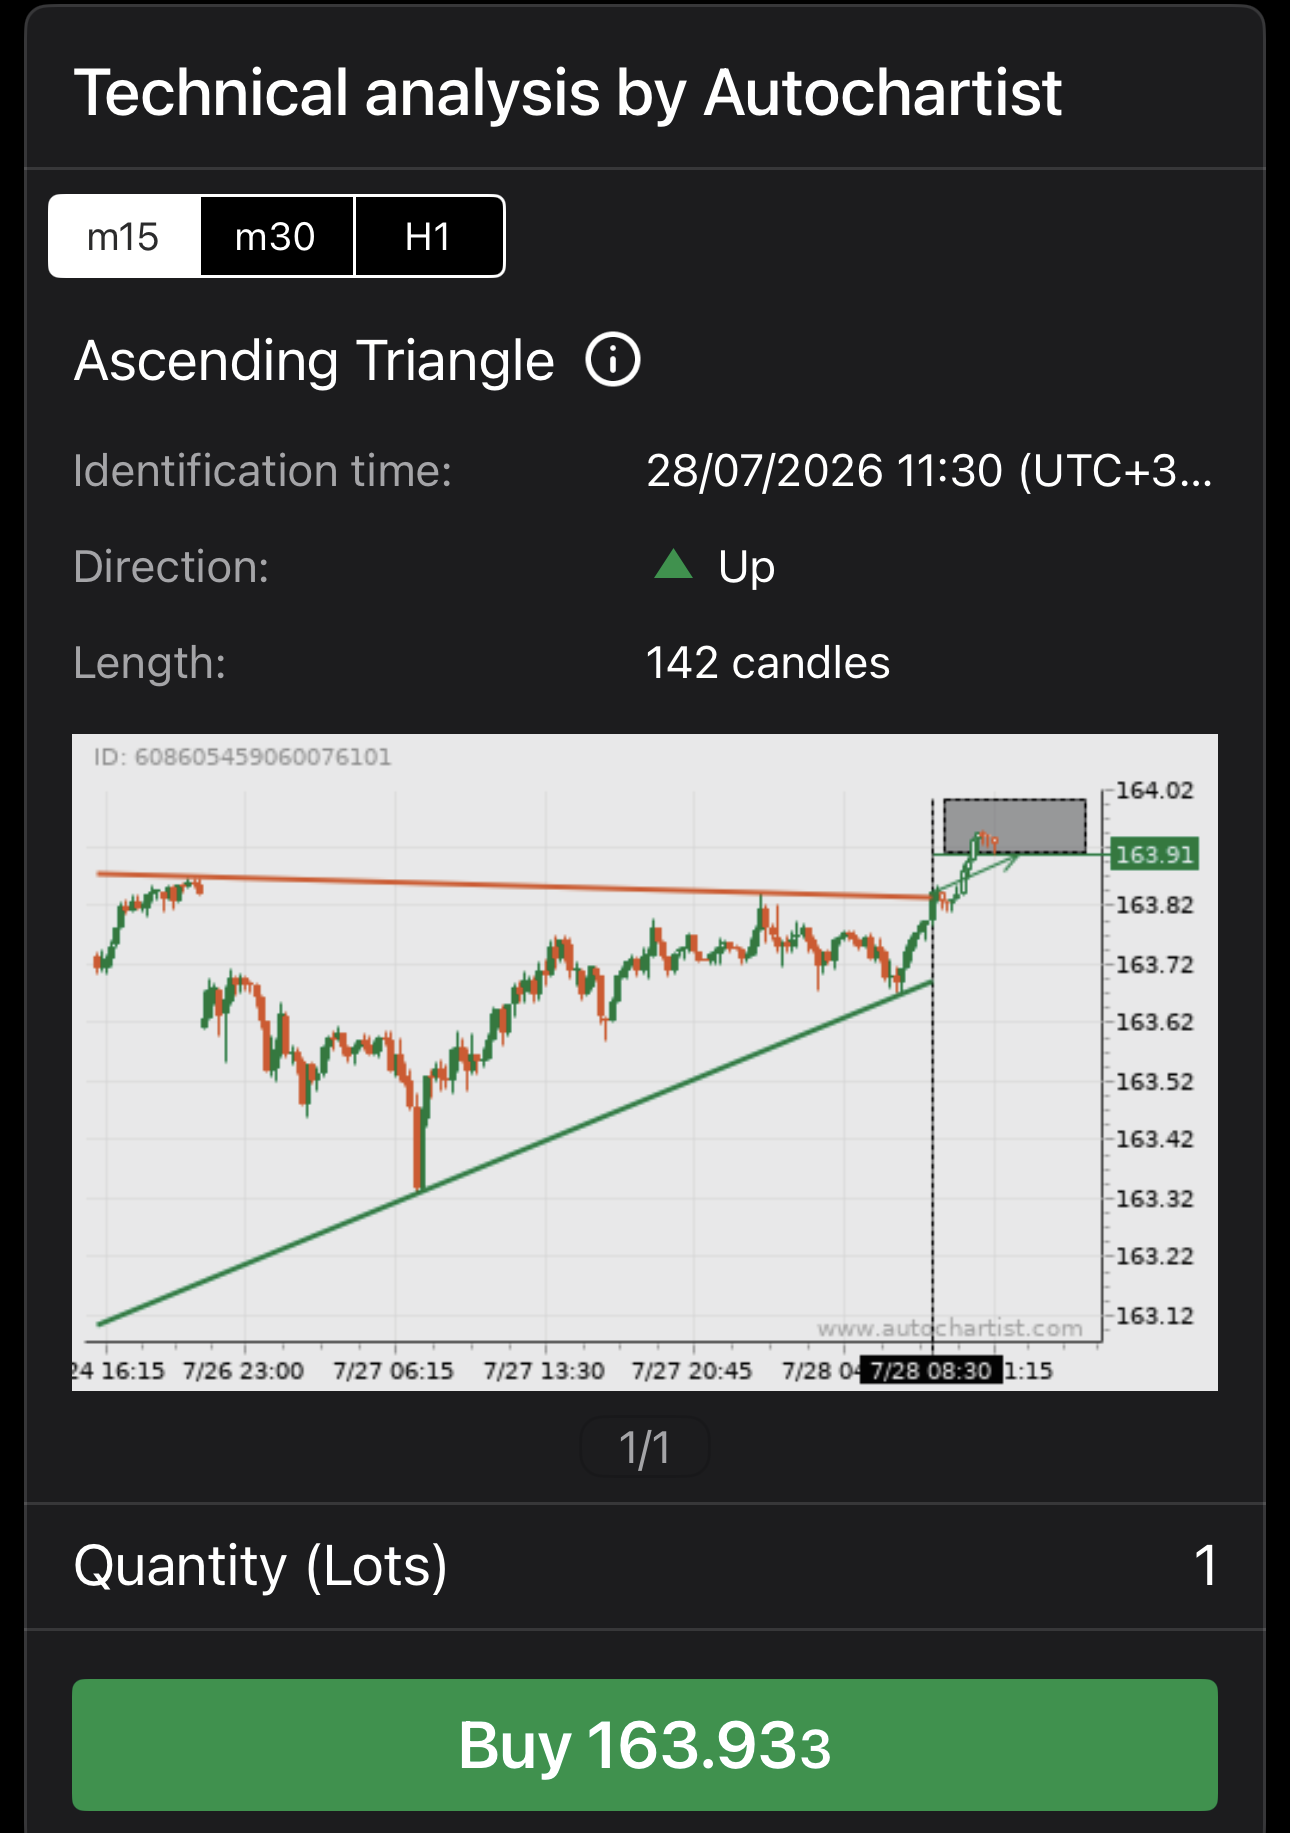
The Technical analysis by Autochartist block shows potential trading opportunities for the symbol based on pattern recognition.
The period selector at the top of the block (m15, m30 and H1) sets the period Autochartist scans. Each period is analysed on its own, so switching between them brings up different patterns, and a single period can hold several. The counter under the image tells you how many patterns the period has and which one you are looking at.
Each pattern gives its name, its Identification time, Direction and Length, and a chart of the symbol with the pattern drawn on it. Set the trade size in Quantity/Volume and tap the trade button to act on the pattern without leaving the block.
Tap the pattern, or beside its name, to open the Pattern details screen, where the full analysis sits alongside the same trading controls. See Autochartist signals for what each field reports.
Note
The analysis is provided by Autochartist and is available only for brokers that have subscribed to the service.
Symbol details
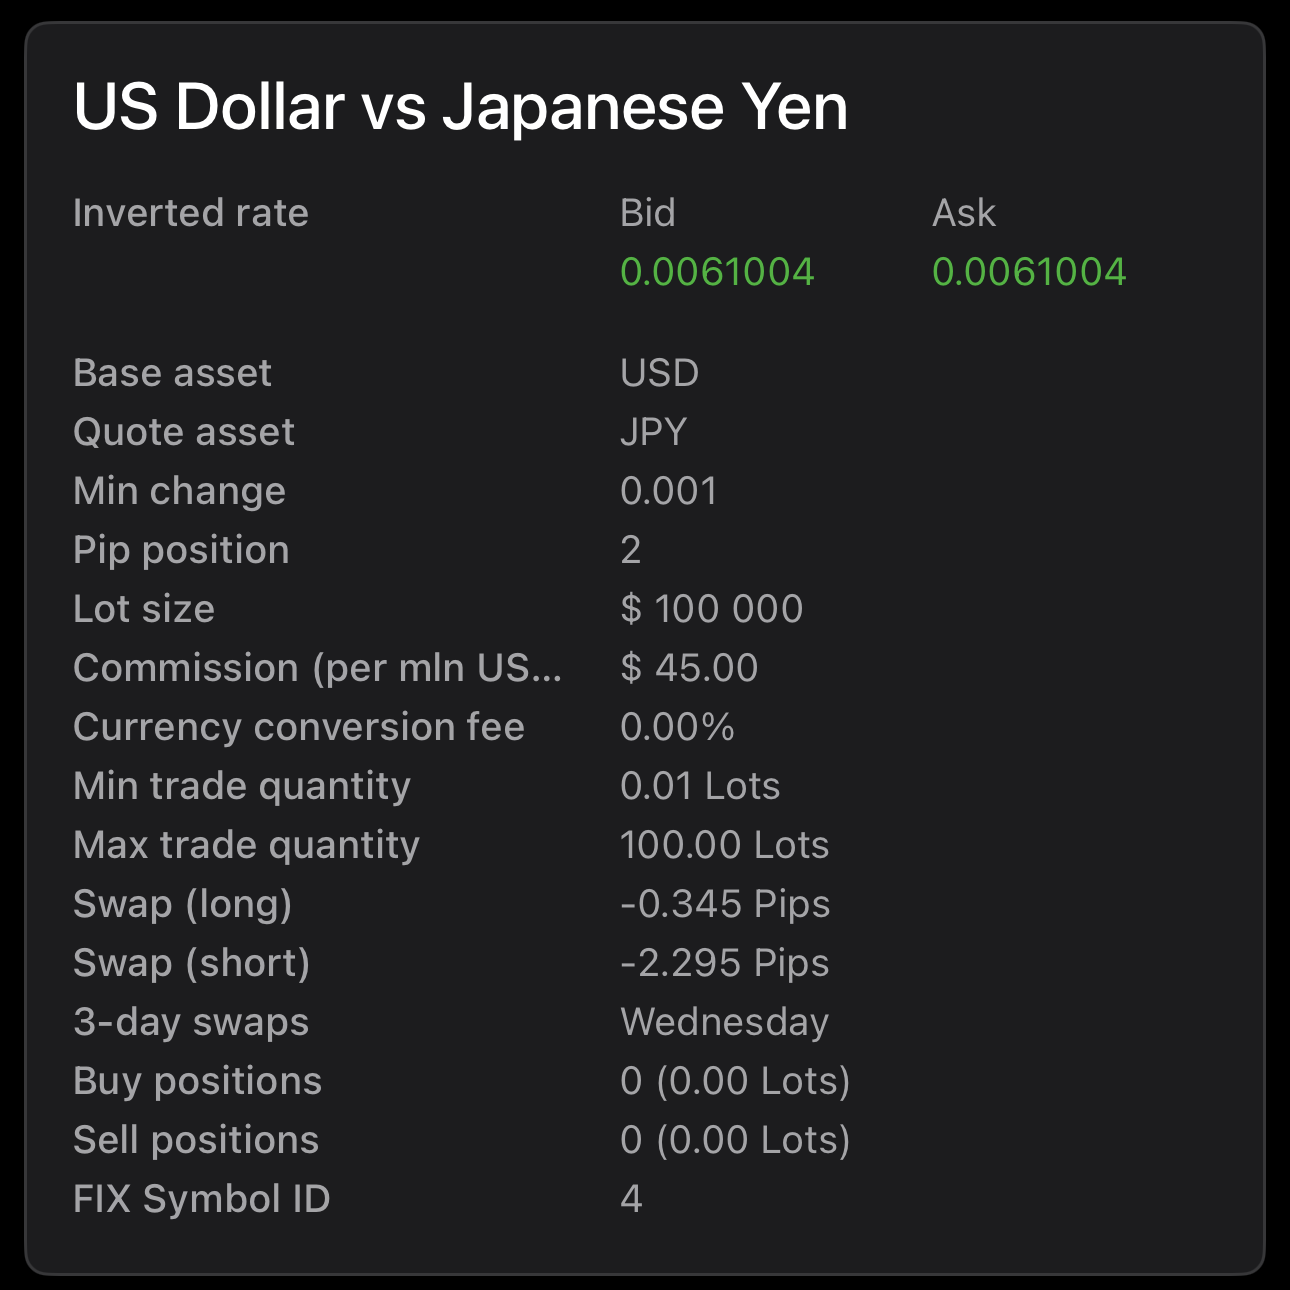
The symbol details block gathers the trading conditions your broker applies to the symbol. It is headed by the symbol's full name and holds:
- Inverted rate – the bid and ask with the symbol quoted the other way round: how much of the base asset one unit of the quote asset buys.
- Base asset – the asset you are buying or selling.
- Quote asset – the asset the price of the base asset is expressed in.
- Min change – the smallest amount the price can move.
- Pip position – the decimal place counted as a pip.
- Lot size – how much of the base asset one lot represents.
- Commission – what your broker charges, over the volume it is charged on.
- Currency conversion fee – what is charged when a deal has to be converted into your account currency.
- Min trade quantity – the smallest volume you can trade in one order.
- Max trade quantity – the largest volume you can trade in one order.
- Swap (long) – what you are charged or paid for holding a buy position overnight, in pips.
- Swap (short) – what you are charged or paid for holding a sell position overnight, in pips.
- 3-day swaps – the weekday on which three days of swap are charged at once, covering the weekend.
- Buy positions – how many buy positions you hold in the symbol, and their volume.
- Sell positions – how many sell positions you hold in the symbol, and their volume.
- FIX Symbol ID – the identifier the symbol carries in the FIX API.
See Symbols for how a symbol is put together, and Commissions and Swaps for how those charges are set.
Note
Every value here comes from your broker's own configuration, so it differs from broker to broker.
Market hours
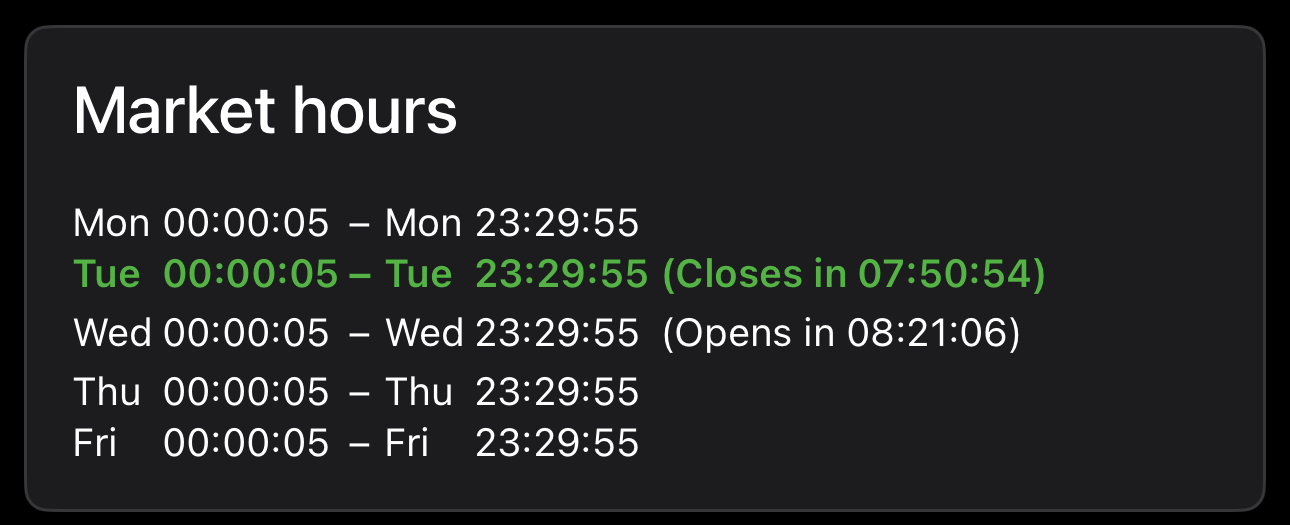
The market hours block lists the symbol's trading sessions for the week, one row per session, each with its opening and closing day and time.
The active session is picked out in green, counting down to its close. The session that follows counts down to its open.
See Trading sessions for how sessions are set and why they differ between symbols.
Trade statistics
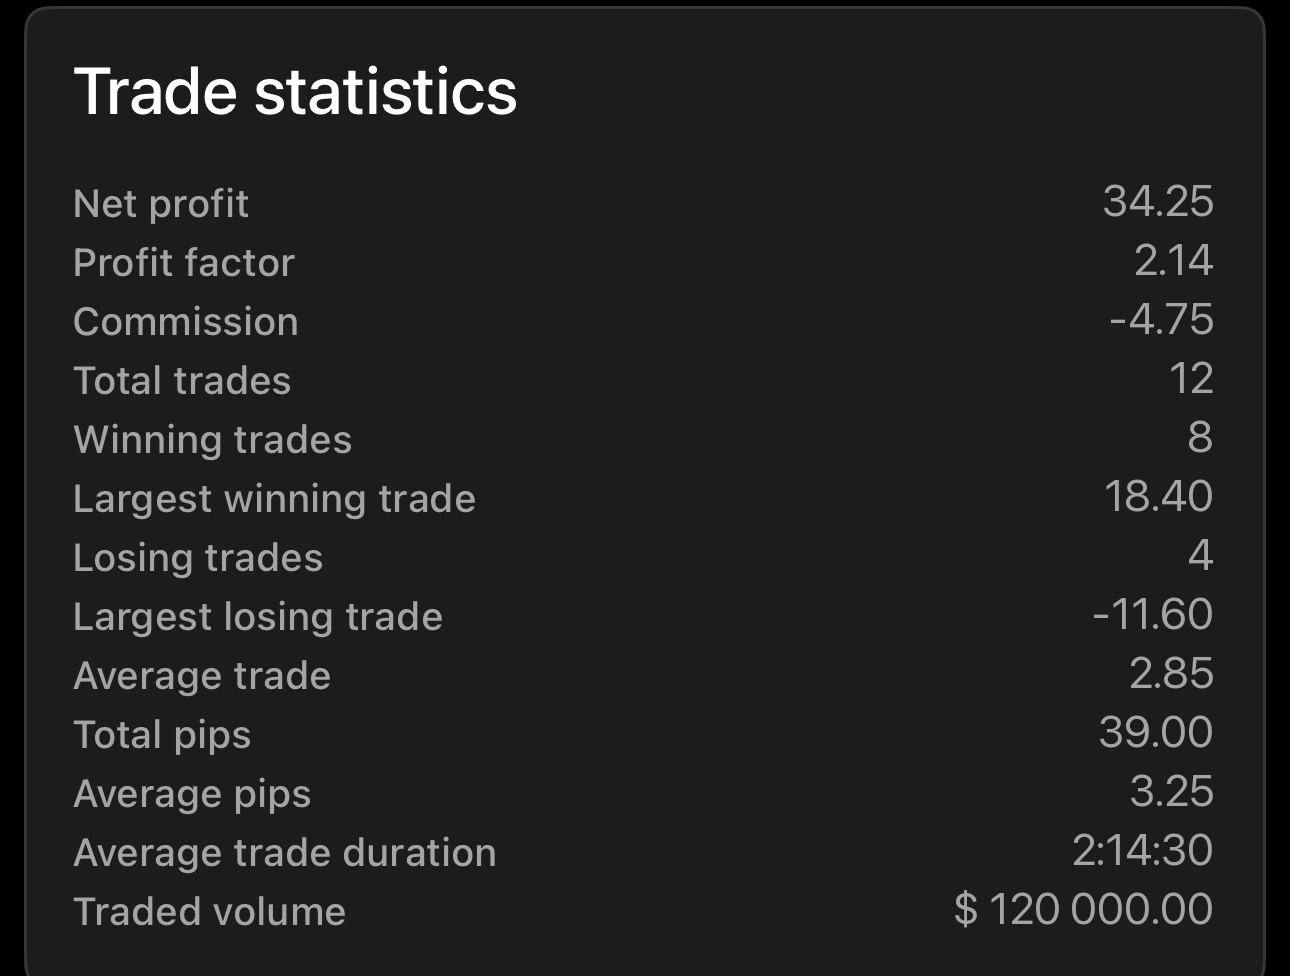
The trade statistics block covers how the account has performed in this symbol, across the trades you have closed:
- Net profit – your overall profit or loss on the symbol.
- Profit factor – gross profit divided by gross loss. Above 1 means the winners outweigh the losers.
- Commission – what you have paid to trade the symbol.
- Total trades – how many trades you have closed in the symbol.
- Winning trades – how many of them closed in profit.
- Largest winning trade – your best single result.
- Losing trades – how many of them closed at a loss.
- Largest losing trade – your worst single result.
- Average trade – net profit spread across every trade.
- Total pips – the same performance counted in pips rather than money, so it is not skewed by the volume you traded.
- Average pips – those pips spread across every trade.
- Average trade duration – how long you tend to hold a position in this symbol.
- Traded volume – how much you have traded in total.
A dash means the figure cannot be worked out yet: no closed trades in the symbol, or none of the kind that row counts.
Leverage
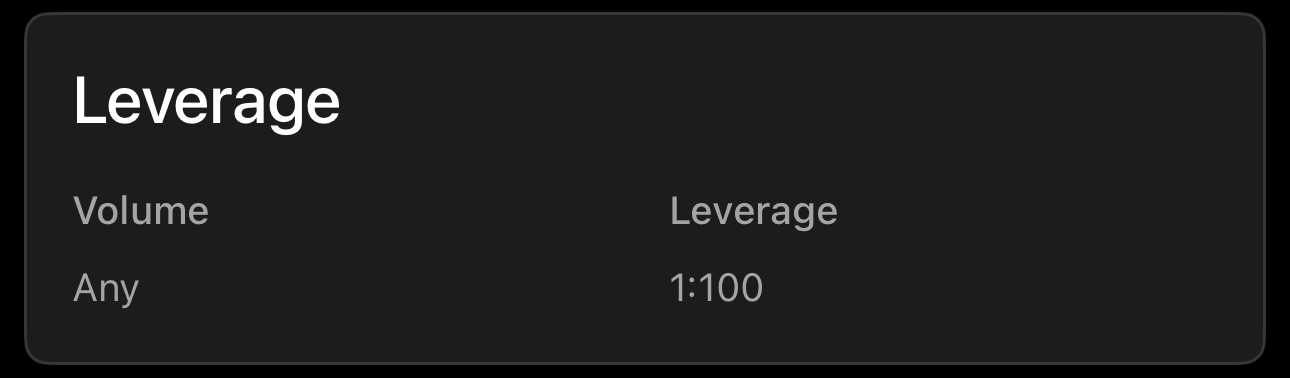
The Leverage block shows the leverage your broker applies to this symbol, which sets how much margin a position requires. It is a table of two columns:
- Volume – the exposure a row covers.
- Leverage – the ratio that applies to it.
See Dynamic leverage for details.
Note
Leverage volume is always displayed in USD, regardless of the symbol.