Chart modes
cTrader offers 3 modes of the chart layout: multi-chart, single-chart and free-chart modes. These modes change the layout of the charts on the screen.
You can switch between the chart modes from the Instruments toolbar next to the chart.
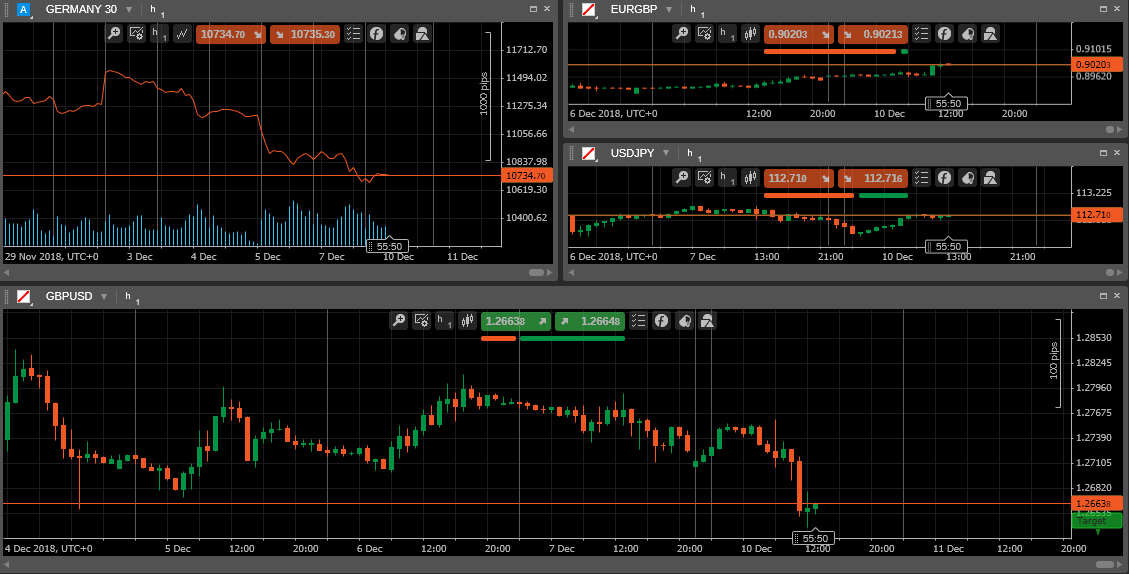
Click the Multi-chart icon on the Instruments toolbar to enable multi-chart mode. This mode is active by default.
You can add more charts and drag them around in the charts area. Learn how to add new charts from the Open charts section.
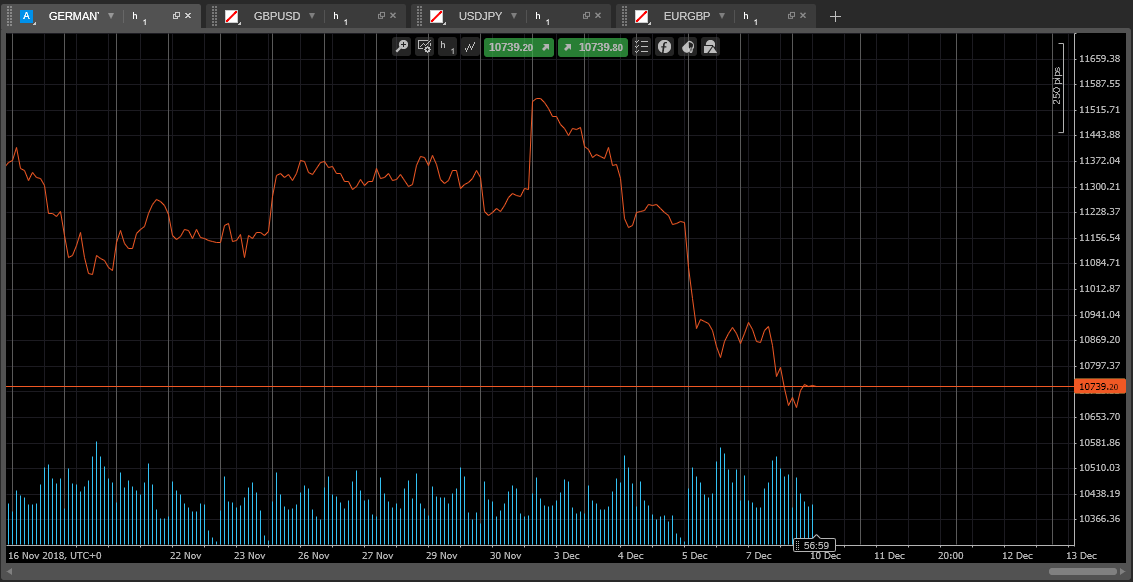
Click the Single-chart icon on the Instruments toolbar to enable single-chart mode.
In this mode, one chart uses the entire charts area of the screen and the other opened charts are displayed as tabs at the top of the chart area.
You can switch between the charts by selecting the tabs above. To add a new chart, click the Plus icon next to the tabs.
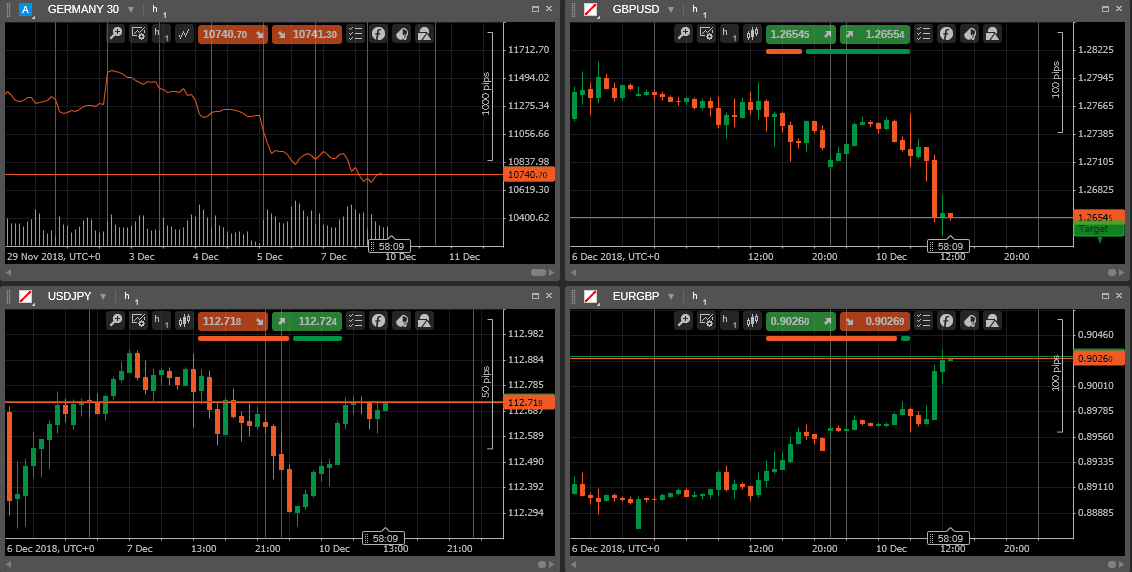
Click the Free-chart icon on the Instruments toolbar to enable free-chart mode. It is similar to multi-chart but also allows resizing each chart individually.