Chart viewing options
Chart viewing options in cTrader allow you to show or hide different elements on the chart; simply right-click anywhere on the chart, select Viewing options from the drop-down, and check or uncheck the relevant items to adjust their visibility.
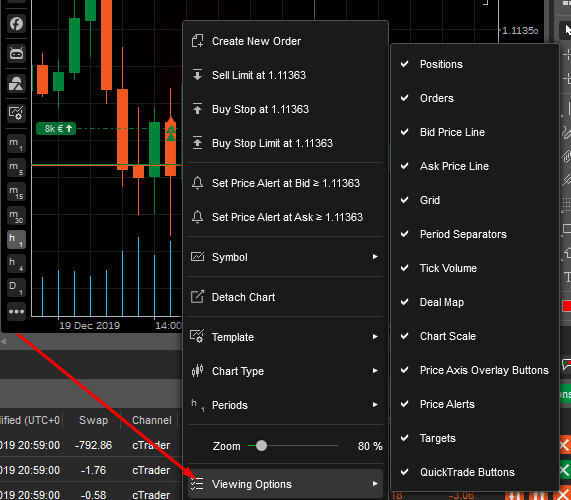
- Positions – the position badge and line on the chart (if any positions are opened for the symbol).
- Orders – the pending order badge on the chart (if any pending orders are placed for the symbol).
- Bid price line – the orange line on the chart displaying the bid price level in real time.
- Ask price line – the green line on the chart displaying the ask price level in the real time.
- Grid – the grid on the chart background.
- Period separator – the vertical line separating the periods on the chart.
- Tick volume – the tick volume bars to the bottom of the chart.
- Deal map – the deal arrow marks on the chart bar.
- Chart scale – the chart scale in pips displayed to the upper right of the chart area.
- Price axis overlay button – the Detach chart button to the upper-right of the price axis.
- Price alerts – the price alert line on the chart (if any price alerts are set for the symbol).
- Target – the indicator displaying the trading central data on the chart.
- Quick Trade button – the Quick Trade button to the top of the chart.
- Market sentiment – the market sentiment displayed below the Quick Trade button.