Line studies and chart objects
Instruments toolbar
cTrader offers a comprehensive set of line studies and special objects for advanced technical analysis.
All these options are available from the Instruments toolbar to the left side of the chart.
Note
You can place the Instruments toolbar from any side of the chart area by dragging it.

Mouse cursor
The Mouse cursor is the default mouse pointer. Use it to move across the chart and modify the chart objects, or drag the chart by the timeline.
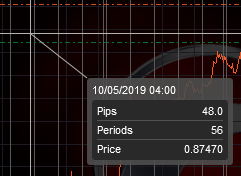
Crosshair cursor
The Crosshair cursor makes it easier to see the exact price at the exact time. Click the Crosshair and hover over the chart. The exact price and time will be highlighted on the corresponding axes.
Click and hold the left mouse button and move the cursor to another point on the chart to see the price and time differences between the points.
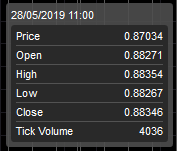
Market snapshot
Using the market snapshot you can compare the following prices at a certain point: the actual price, open, high, low, close and volume.
Click the Market snapshot icon and hover the cursor on the chart. You can also use the market snapshot tool in the indicators areas to get more details.
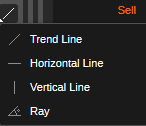
Lines
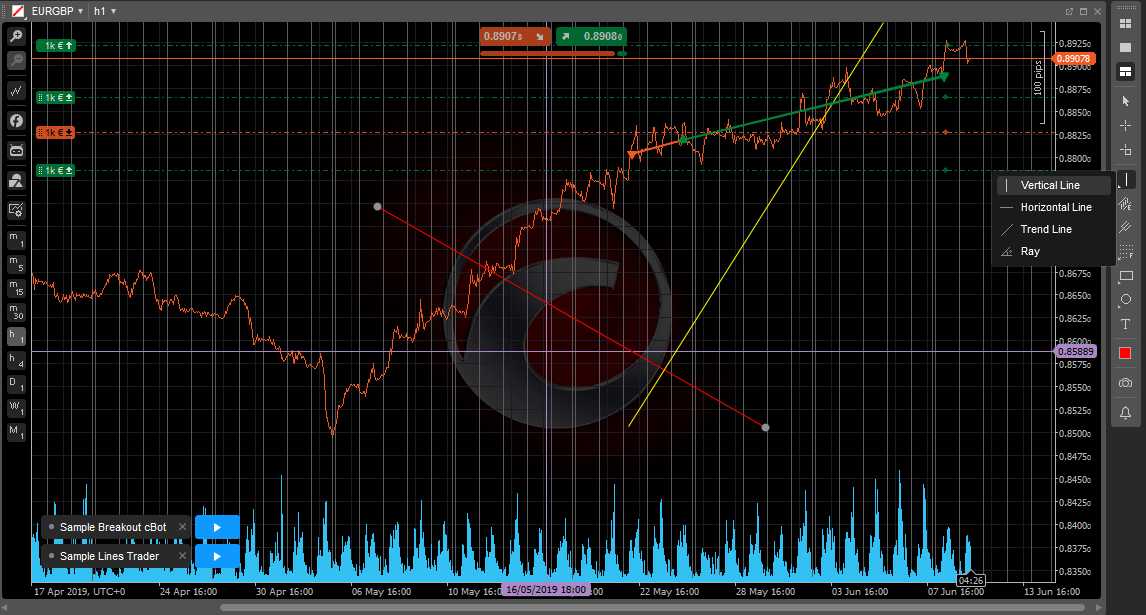
You can draw vertical and horizontal lines, trend lines (diagonal), as well as rays directly on the charts.
These tools are grouped under the single button on the Instruments toolbar - the Trend line button. Hover over the Trend line button to expand the lines drop-down and select the desired line type.
Select the corresponding button and click on the chart to place a line.
To create a trend line or a ray, click and hold the left mouse button on the first point in the chart, move the mouse pointer to the second point, and release the mouse button to create a line or ray connecting these two points.
-
Vertical lines are often used to mark certain areas on the chart, for example, the correlation between the price and indicators below (purple on the screenshot above).
-
Horizontal lines are often used to mark the support and resistance levels on the chart (blue on the screenshot above).
-
Trend lines (green on the screenshot above) allow marking trends.
-
Rays (shown in red in the screenshot above) are very similar to trend lines, but they make it easier to mark a trend and predict its future movement.
Note
The Ray tool allows controlling the exact angle in degrees (the value after the slash symbol in the picture below).
When drawing lines, the two points of a line will be snapped to the price bars by default. Use Shift on your keyboard to prevent snapping to the price and place the drawing points more precisely if prompted.
Manage lines
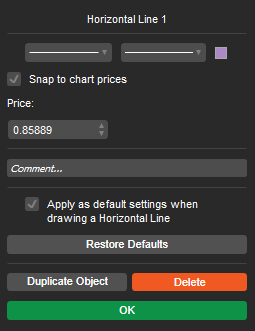
To edit a line, right-click on it directly in the chart and use the pop-up to select the line style, thickness and colour.
Check the Apply as default box to apply the current settings as the default for all the future objects of this type.
For horizontal lines check the Snap to chart prices box and set the exact price level to place the horizontal line.
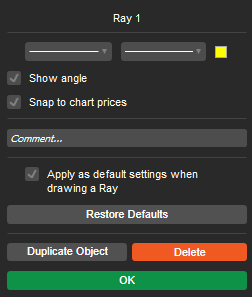
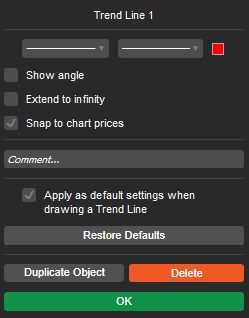
For trend lines and rays check the Show angle box to display the exact line angle on the chart.
Check the Extend to infinity box to turn a trend line to a ray and vice versa.
When done click OK to apply changes.
To move a line, just drag and drop it to another location.
Use Ctrl + drag, or Ctrl + C and Ctrl + V to copy the line.
To edit points (change direction) of a trend line or a ray, hover over the key points of the trend line or ray (dots on the line), and drag and drop them separately to another location.
To delete a line, right-click on it in the chart and click Delete in the drop-down. Alternatively, select a line in the chart by clicking it and press Del on the keyboard.
You can also delete a line or any other chart object from the chart by using the chart menu.
Right-click anywhere on the chart, select Objects from the drop-down list, select the desired object or line and click X next to it.
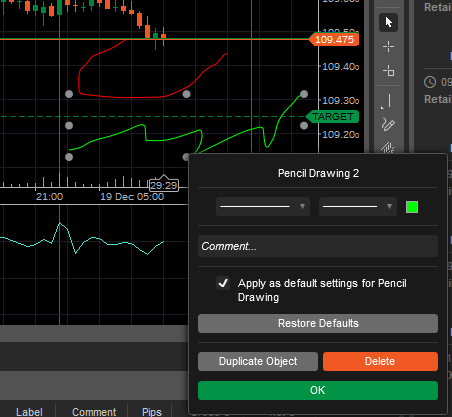
Pencil
The pencil tool lets you draw freehand shapes and annotations directly on the chart in any mode using a pencil cursor.
Unlike most other drawing tools, it is not limited to a fixed shape. This makes it useful for adding notes directly on the chart when setting up a trade and for later review
To use a pencil, select the Pencil icon from the Instruments toolbar and start drawing by holding the left mouse button on the chart.
You can adjust the colour and thickness of your pencil marks. Right-click a pencil drawing to open settings.
Use Ctrl + drag to copy your drawing anywhere on the chart.
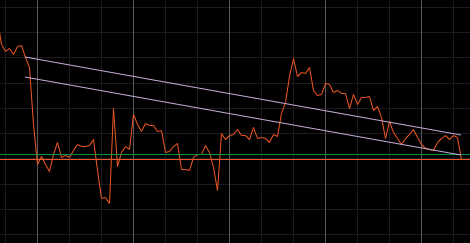
Equidistant channel
The equidistant price channel allows drawing two precisely parallel lines on the chart.
Click the Equidistant Channel icon in the Instruments toolbar, then click and hold the left mouse button to draw a line from the first point to the second. Release the mouse button to create a line.
The second parallel line appears automatically.
To adjust the distance between the lines, click the line with the dot at its center and drag it.
To move both lines together, click and drag the line with the two dots at its ends. Click and drag the dots on the lines ends to adjust the length of the line or rotate the equidistant channel on the chart.
Use Ctrl + drag to copy the equidistant channel anywhere on the chart.
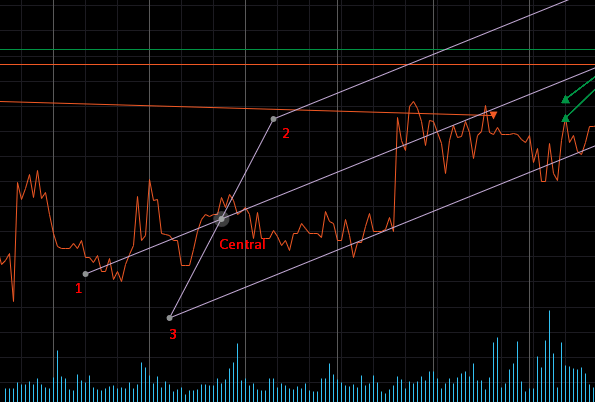
Andrews' pitchfork
Andrews' pitchfork is a technical tool that helps to identify possible support and resistance levels with three parallel lines that look like a pitchfork.
Click the Andrews' pitchfork icon in the Instruments toolbar, then click and hold the left mouse button to draw a trend line from point 1 to the central point.
Release the mouse button and drag the points 1, 2 and 3 of the pitchfork to the corresponding peaks of the price. To move the Andrews' pitchfork, hover over the central line and drag it.
Use Ctrl + drag to copy Andrews' pitchfork anywhere on the chart.
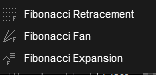
Fibonacci tools
There are 3 basic Fibonacci tools:
- Fibonacci retracement
- Fibonacci fan
- Fibonacci expansion
Hover over the Fibonacci button in the Instruments toolbar Click the corresponding button on the Instruments toolbar to start drawing, or hover over the button to select another Fibonacci tool.
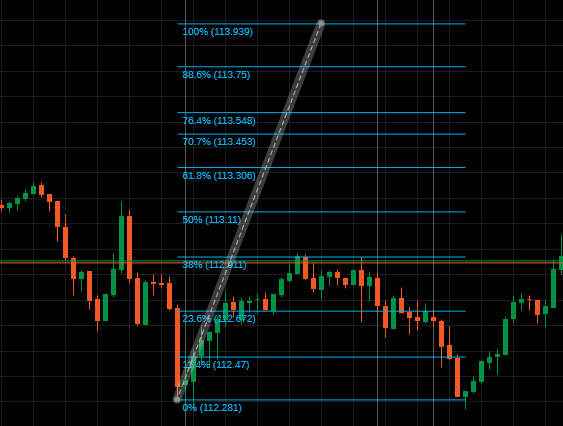
Fibonacci retracement
Fibonacci retracement is a charting technique that uses horizontal lines to indicate areas of support or resistance at the key Fibonacci levels before the trend continues in the original direction.
Fibonacci retracement price levels can be used as buy triggers on pullbacks during an uptrend.
Select Fibonacci retracement from the Instruments toolbar, and draw a trend line on the chart holding the left mouse button.
cTrader divides the vertical distance between the points using the Fibonacci ratios and draws the horizontal lines.
Fibonacci retracement is used to determine how far the price might retrace before continuing to move in the original direction.
Traders often use Fibonacci key levels to place pending orders.
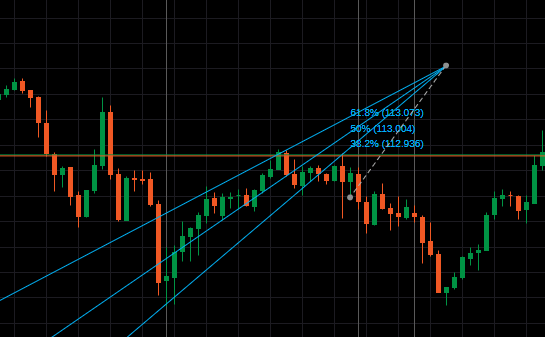
Fibonacci fan
Fibonacci fan is a charting technique that is used to estimate support and resistance levels by drawing new trend lines based on the Fibonacci retracement levels.
Select Fibonacci fan from the Instruments toolbar, then draw a trend line in the chart holding the left mouse button.
cTrader divides the vertical distance between the points of the trend and draws new lines connecting the Fibonacci levels with the starting point.
Fibonacci fan lines are dynamic and extend after the Fibonacci retracement points, which are static.
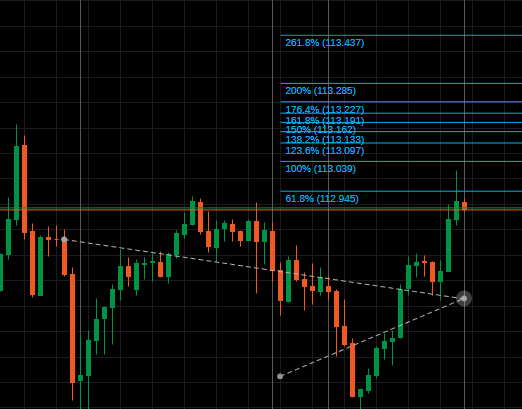
Fibonacci expansion
Fibonacci expansion is a charting technique used to plot possible levels of support and resistance by tracking not only the primary trend but also the retracement.
Select the Fibonacci expansion from the Instruments toolbar and draw the trend line by holding the left mouse button. Then release the mouse button and place the third point of the expansion which appears automatically linked to the cursor.
cTrader divides the vertical distance between the points of the trend using the Fibonacci ratios and then takes the low point of the retracement segment as a reference.
Fibonacci expansion is used to determine where the price might move after the retracement.
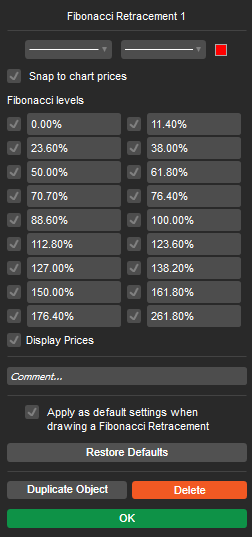
Edit Fibonacci objects
To edit Fibonacci object properties, right-click its trend line on the chart.
In the pop-up menu select the line type, thickness and colour.
Uncheck the Fibonacci levels to disable them, or type in new values to change the levels.
By default, cTrader snaps key points to chart prices when you edit or place a Fibonacci trend line. Uncheck Snap to chart prices if you do not want points to align automatically.
Uncheck the Display prices if you do not want to see the prices corresponding to the Fibonacci key levels directly in the chart.
Check the Apply as default box to apply the current settings as the default for all the future objects of this type.
To move a Fibonacci object, hover over its trend line and drag it over the chart to any desired location.
To edit points (change direction), hover over the key points of the trend line and drag them separately.
To delete a Fibonacci object, right-click on its trend line in the chart and click Delete in the drop-down. Alternatively, select an object in the chart by clicking it and press Del on the keyboard.
You can also delete an object from the chart by using the chart menu. Right-click anywhere on the chart, select Objects from the drop-down list, select the desired object or line and click X next to it.
Use Ctrl + drag to copy the Fibonacci object anywhere on the chart.
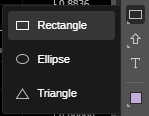
Shape objects
cTrader allows drawing rectangles, ellipses and triangles as outlines or filled shapes directly on charts.
By default, the Rectangle is displayed in the Instruments toolbar.
Hover over the Shapes button to select a shape.
To draw a shape, click the corresponding button on the Instruments toolbar, then hold the left mouse button in the chart and move the cursor. Release the button to draw a shape.
To move a shape just drag and drop it to any desired location on the chart.
To resize a shape object, hover over the key points and drag and drop them.
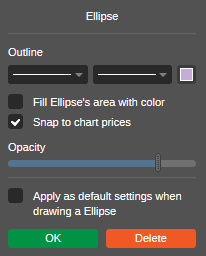
To edit a shape, right-click it and select the line type, thickness and colour. Check the Fill shape box to make it filled and select the opacity level.
Check the Apply as default box to apply the current settings as the default for all the future objects of this type.
Use Ctrl + drag to copy a shape object anywhere on the chart.
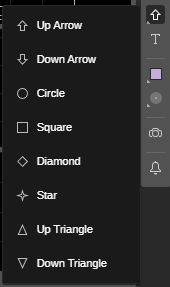
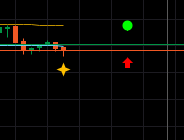
Markers
cTrader allows placing 8 different types of markers on the charts for more precise analysis. You can place circles, up arrows, down arrows, squares, diamonds, stars, up triangles and down triangles.
By default, the Up arrow is displayed on the Instruments toolbar. Hover over the button to select another marker from the drop-down list, then click directly on the chart to place the marker.
To move a marker just drag it to any desired location on the chart. To change the marker colour, click the marker to select it, then click the Colour icon from the Instruments toolbar and select the desired colour.
Use Ctrl + drag to copy your marker anywhere on the chart.
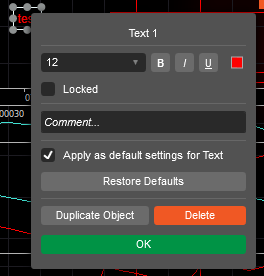
Text
cTrader allows typing and editing the text directly on the charts.
Select the Text icon from the Instruments toolbar, click the desired location on the chart, and type in the text.
You can resize the text frame by dragging one of its corners or move the whole text object by dragging it over the chart.
Right-click the text object to select the desired font, size, colour and style of the text. Check the Apply as default box to apply the current settings as the default for all the future objects of this type.
Change colour
cTrader allows customising colour for all the chart objects available in the Instruments toolbar.
The simplest way to change the colour of the object is to select your object on the chart, click the Colour icon in the toolbar, and select the desired colour.
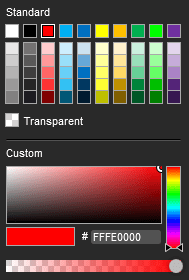
Alternatively, right-click a desired object on the chart and select the colour from the properties drop-down.
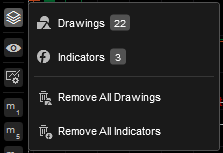
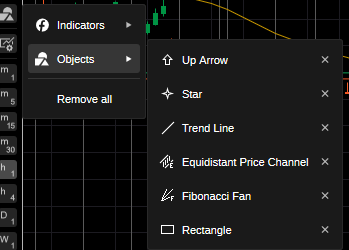
Delete objects from the chart
All active indicators and drawings are listed in the chart objects menu.
Hover over the Objects icon in the Chart toolbar, select the desired indicator or object from the drop down and click the X icon next to it to remove it.
Clicking an object in the drop-down will highlight it on the chart.