Range bars
Similarly to Renko charts, range bars are essential for detecting price trends and reducing market noise. In this article, we discuss how range bars are formed, their key differences from standard candlestick charts and Renko charts, and how range bars can be accessed in cTrader Web.
How range bars are formed
A standard candlestick trading chart forms a new candlestick once a certain amount of time passes regardless of the price movement that occurs during this period. As a result, candlestick charts often include large amounts of noise in the form of data that may not be particularly useful for creating and testing an effective trading strategy.
In contrast, range bars do not account for time and, instead, are formed purely based on price movements. Here is an example of a range bar chart that cTrader Web has constructed for GBPJPY using 10 pips as the volume threshold for new range bars.
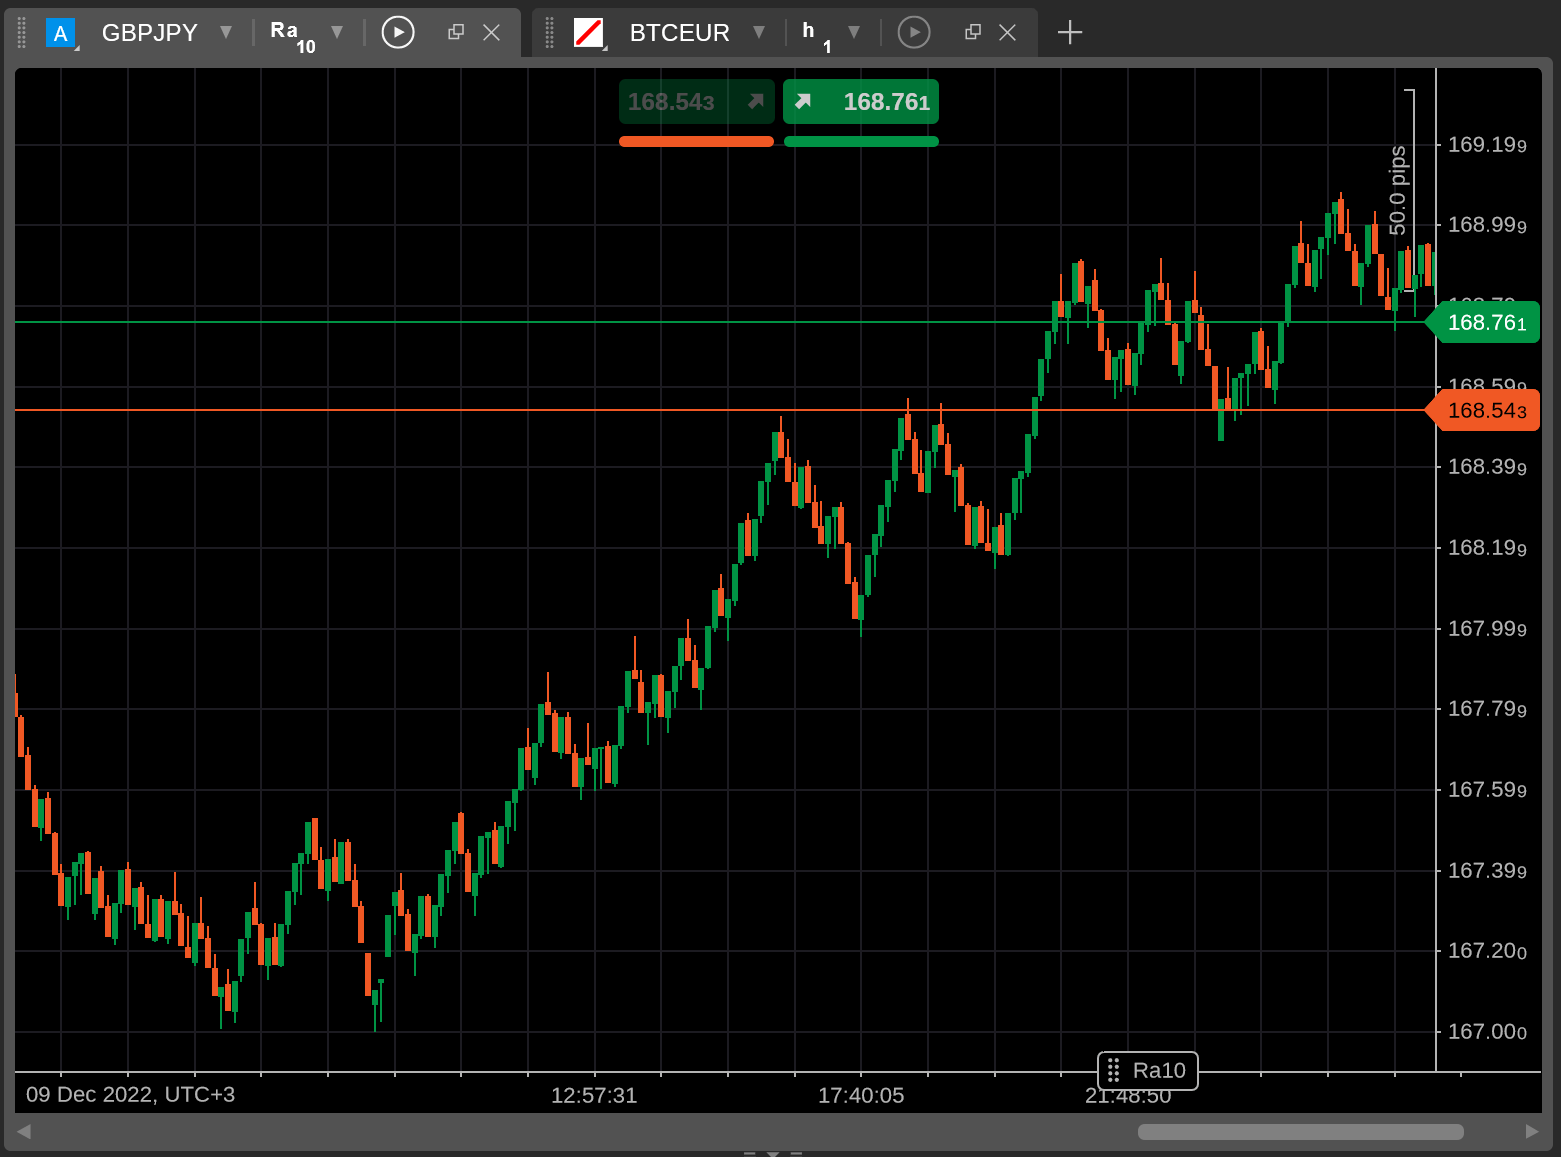
As you can see, range bars are structured similarly to candlesticks in that they include a high price, a low price, an open price and a close price. However, the way new range bars are formed is different from a conventional candlestick trading chart.
Specifically, once a symbol moves a certain amount of pips in either direction in comparison to the closing price of the previous range bar, a new bar is formed on the chart.
Note
Range bars are formed based on cumulative price movements in both directions.
In the above example, the ask price for GBPJPY may first decrease by 3 pips to 168.758 and then increase by 7 pips to reach 168.765. A new range bar will be formed on the chart as the cumulative price movement will reach 10 pips. Its low price will be 168.758 while its high and closing price will be equal to 168.765.
Contrast this process with how Renko charts are formed. Renko bricks are also formed when price movements exceed a certain threshold; however, this movement has to occur in a single direction. Range bars, on the other hand, reflect cumulative movements in any direction and, as some may argue, convey more information than Renko bricks.
How range bars relate to periods
As stated previously, the process of forming new range bars completely ignores the time component. In fact, in the screenshot above, each unit on the X-axis includes different amounts of time.

As you can see, the five units between 12:57:31 and 17:40:05 cover a period of almost five hours. The next five units on the X-axis (from 17:40:05 to 21:48:50), nevertheless, only represent a period that is slightly longer than four hours.
On the one hand, ignoring the time component may seem counterintuitive when trading. In practice, however, range bars are very effective when filtering market noise, particularly in highly volatile market conditions.
How to access range bars in cTrader Web
To construct a new range bar chart, first, open the Chart selector menu by clicking the Three dots icon to the right of the Period selector.
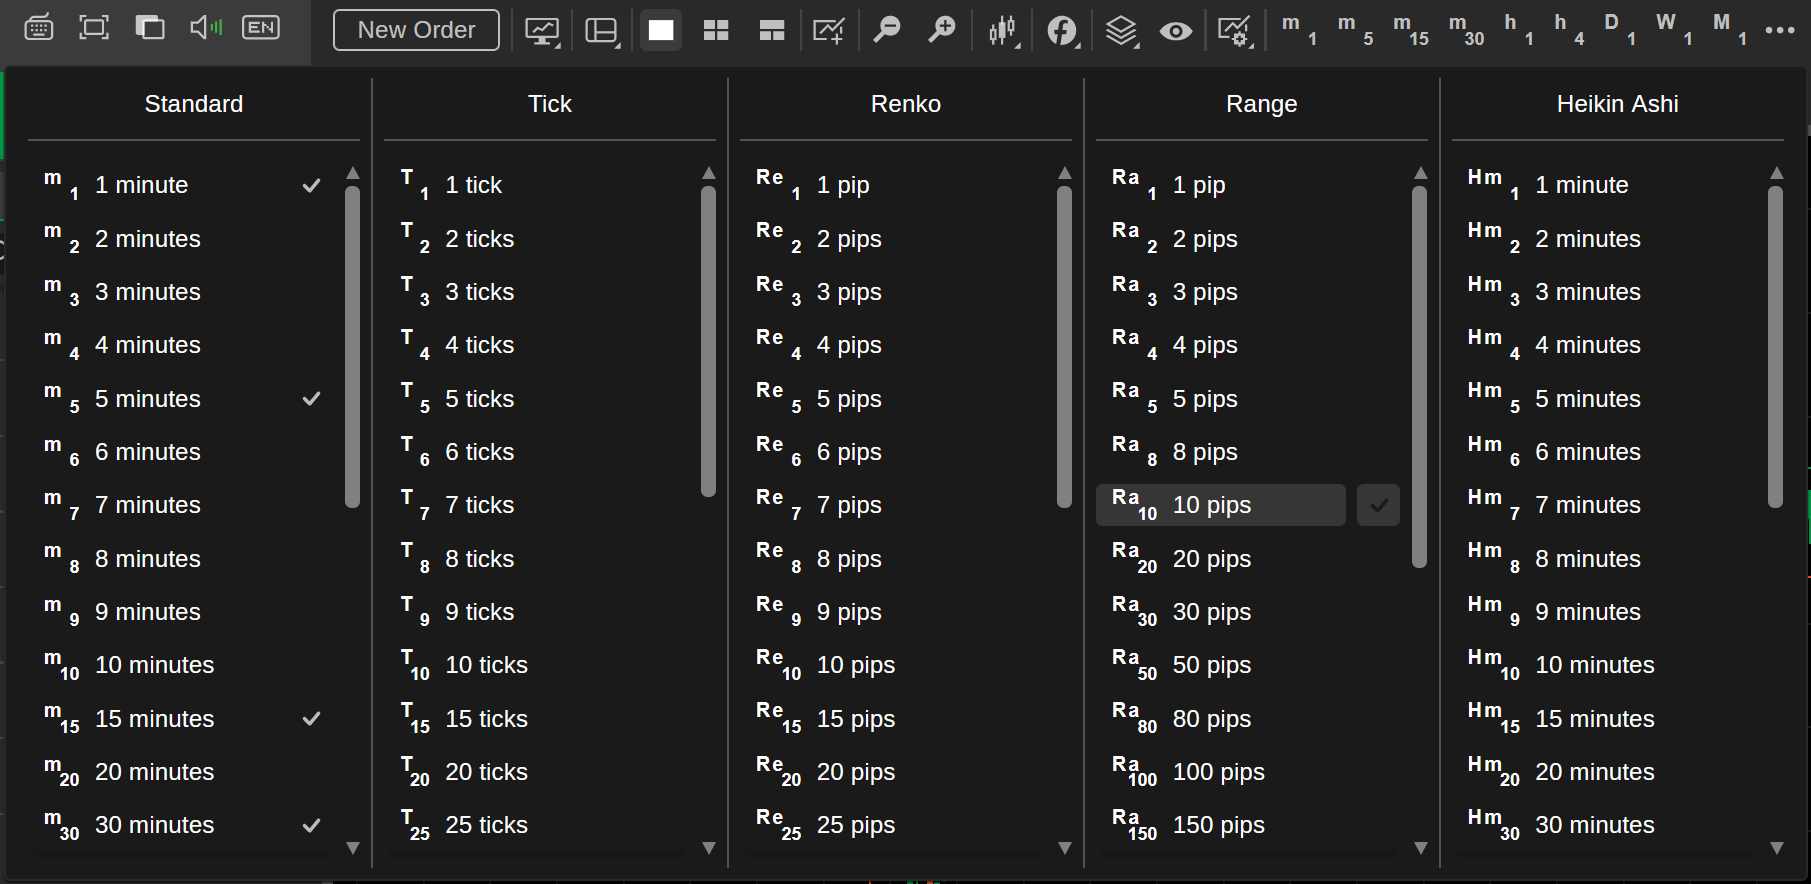
In the Range column, select the volume threshold that should be used for creating new range bars. The larger the volume threshold, the slower new range bars will appear on the trading chart for the currently selected symbol.
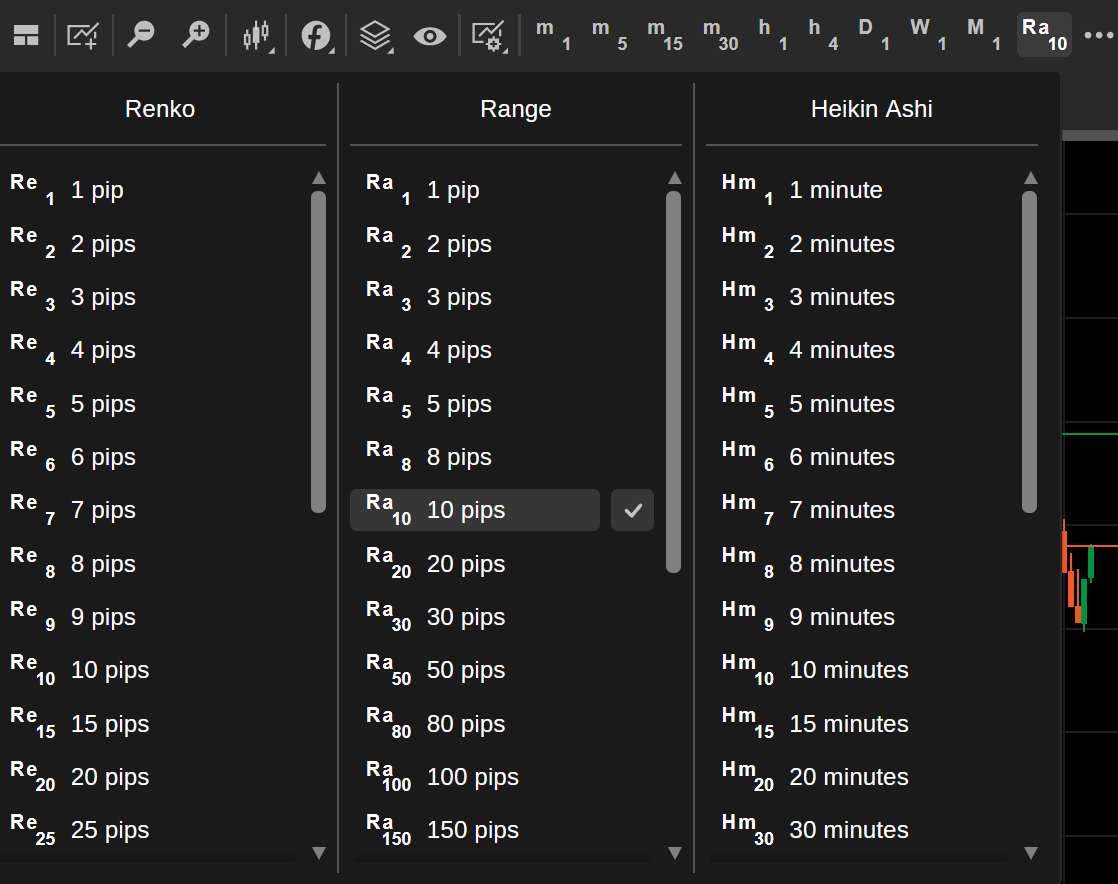
Hover over a particular volume threshold option and check the Tick icon to its right to add it to your favourites. Afterwards, it will always appear in the Period selector.
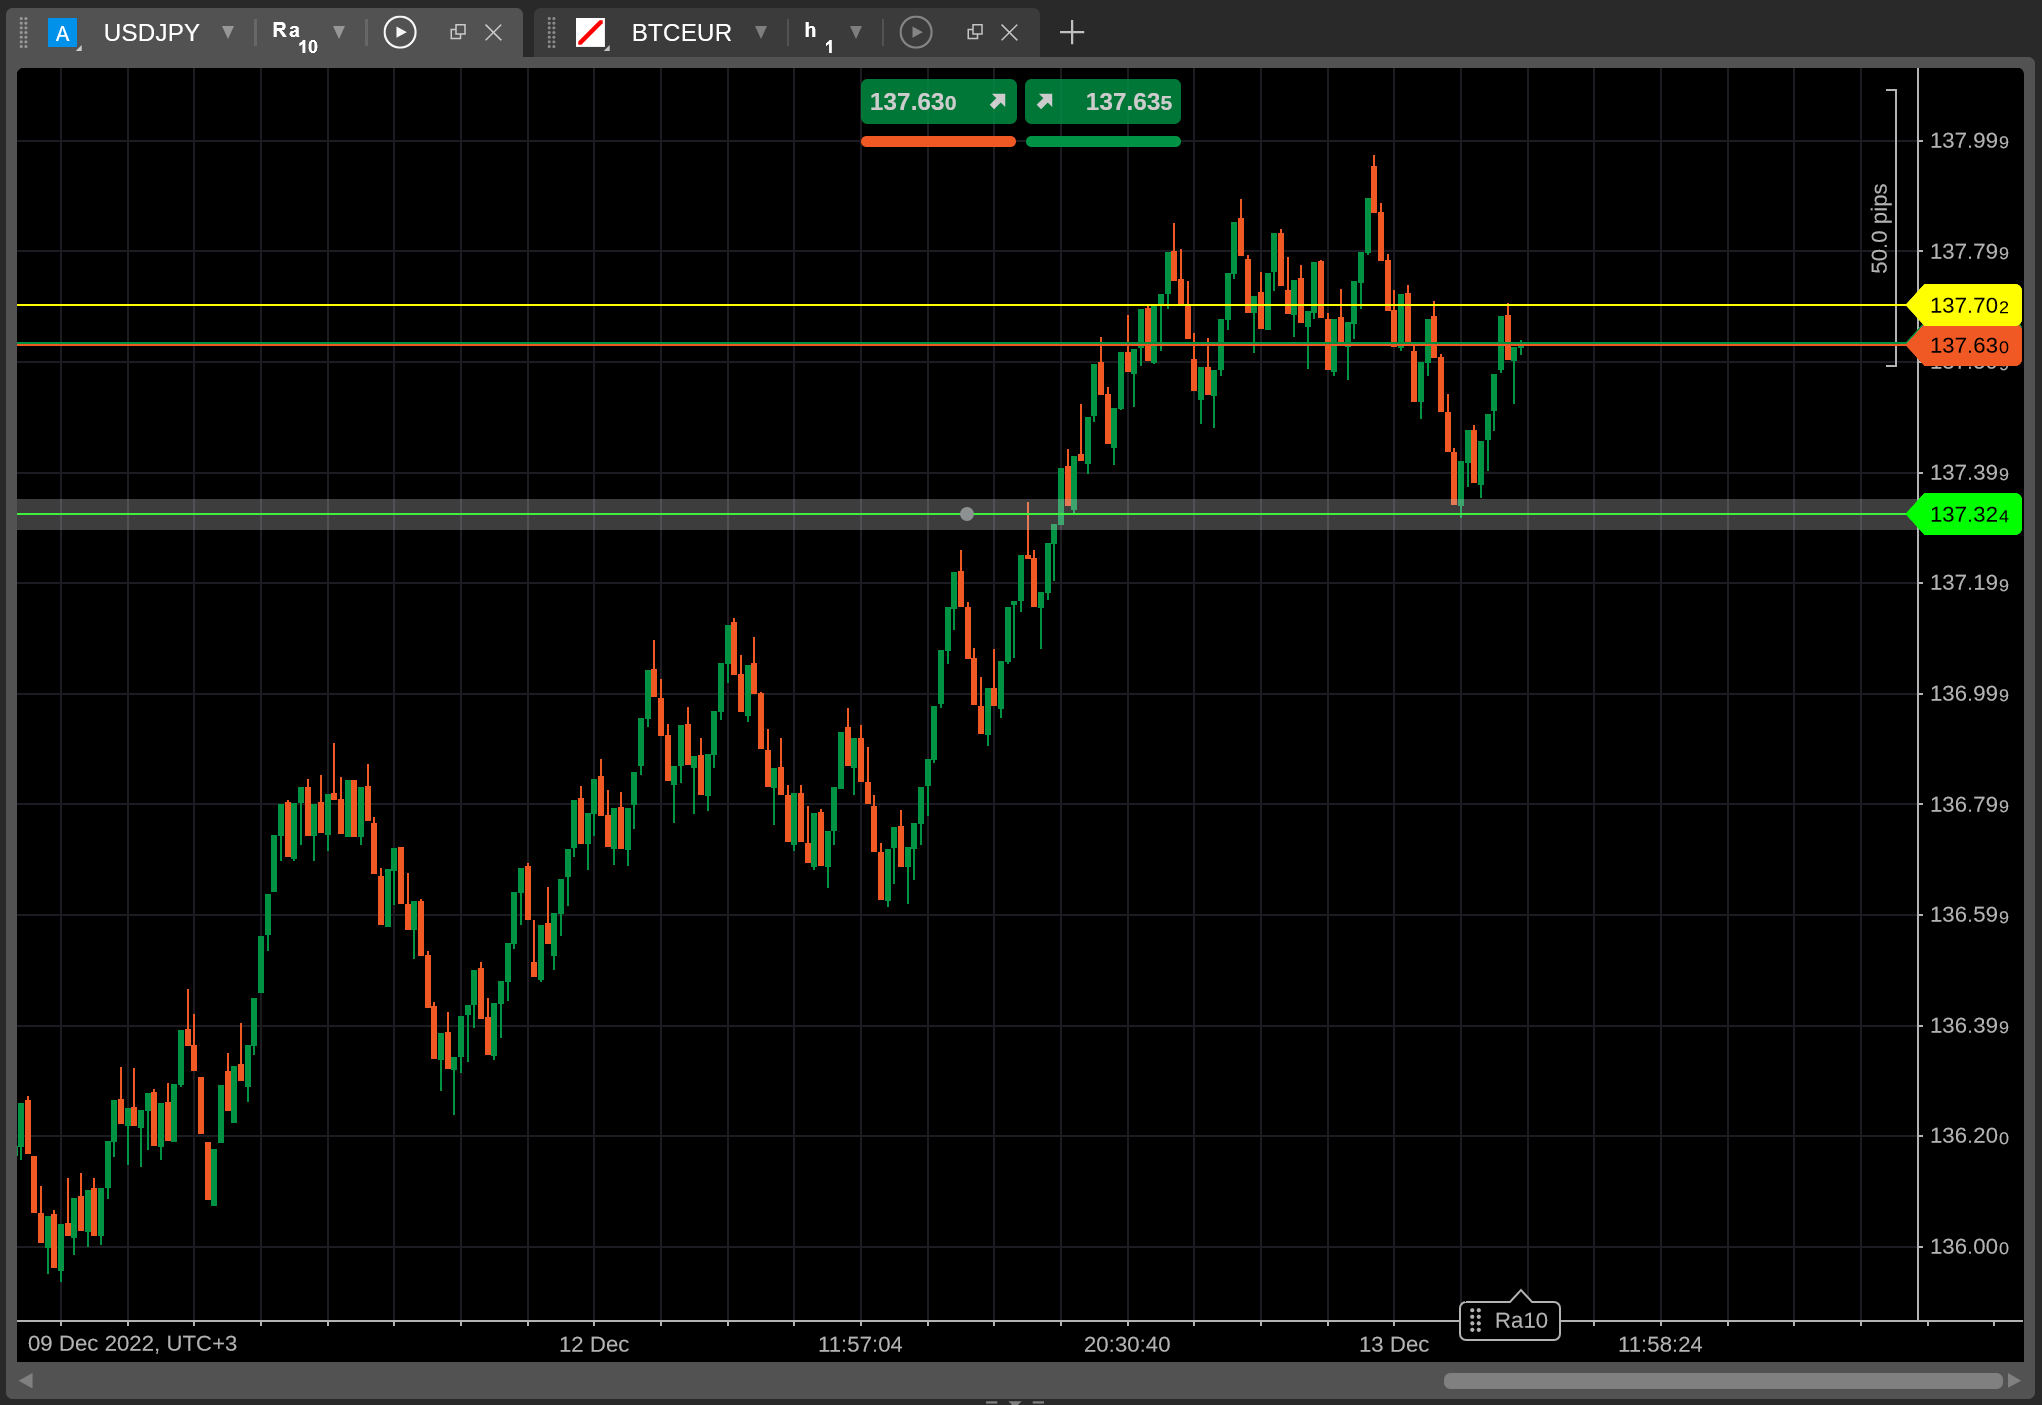
After choosing a volume threshold, cTrader Web will generate a range bar chart for the currently active symbol.
You will then be able to interact with this chart using all toolbox controls offered by cTrader Web. In the screenshot below, we have placed two new horizontal lines on the 10-pip range bar chart for USDJPY.
How range bars benefit traders
While different from traditional candlestick charts, range bar charts offer several advantages to all types of traders.
- Range bars are effective at demonstrating price trends and the general level of market volatility completely independent of the time component.
- Range bars provide more information than Renko charts by showcasing low and high prices in addition to open and close prices.
- Range bars simplify drawing on charts by providing easy-to-interpret points of reference for price reversals and support and resistance levels.
Having said that, range bar charts may not be all that useful when attempting to plot time-dependent price trends.
To summarise, range bar charts should be of use to anyone wanting to receive accurate and noise-free information about any currently ongoing price trends and market movements. You can use them in combination with chart drawings to create a powerful visual aid for improving the effectiveness of your manual trading strategies.