Chart trading
cTrader allows you to perform various trade actions from a chart. Use on-chart buttons and controls to create and modify orders, positions, stop loss, take profit and price alerts.
Quick Trade
-
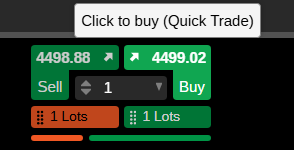
Hover over a price at the top of a chart to display the Quick Trade Buy and Sell buttons, the trade volume field and other chart controls.
-
Set your desired trade volume by clicking the up/down arrowheads for small adjustments, typing a value or selecting a preset number from the dropdown.
-
Do one of the following:
-
Click the Buy or Sell button to place a market order, and cTrader creates the order immediately, and a corresponding notification appears in the top-right corner.
Note
Depending on your Quick Trade configuration in the application settings, you might have to double-click the Buy or Sell button instead, and cTrader may display the new order window rather than send the order.
-
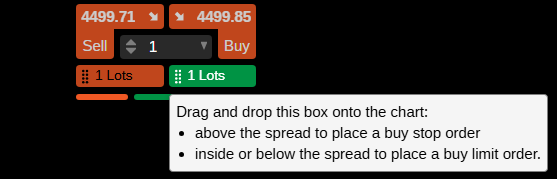
Drag and drop the control onto the chart to place a limit or stop order.
Note
Placing the buy control above the spread creates a stop order, while dropping it inside or below opens a limit order. Putting the sell control below the spread creates a stop order, while setting it inside or above opens a limit order.
-
Context menu
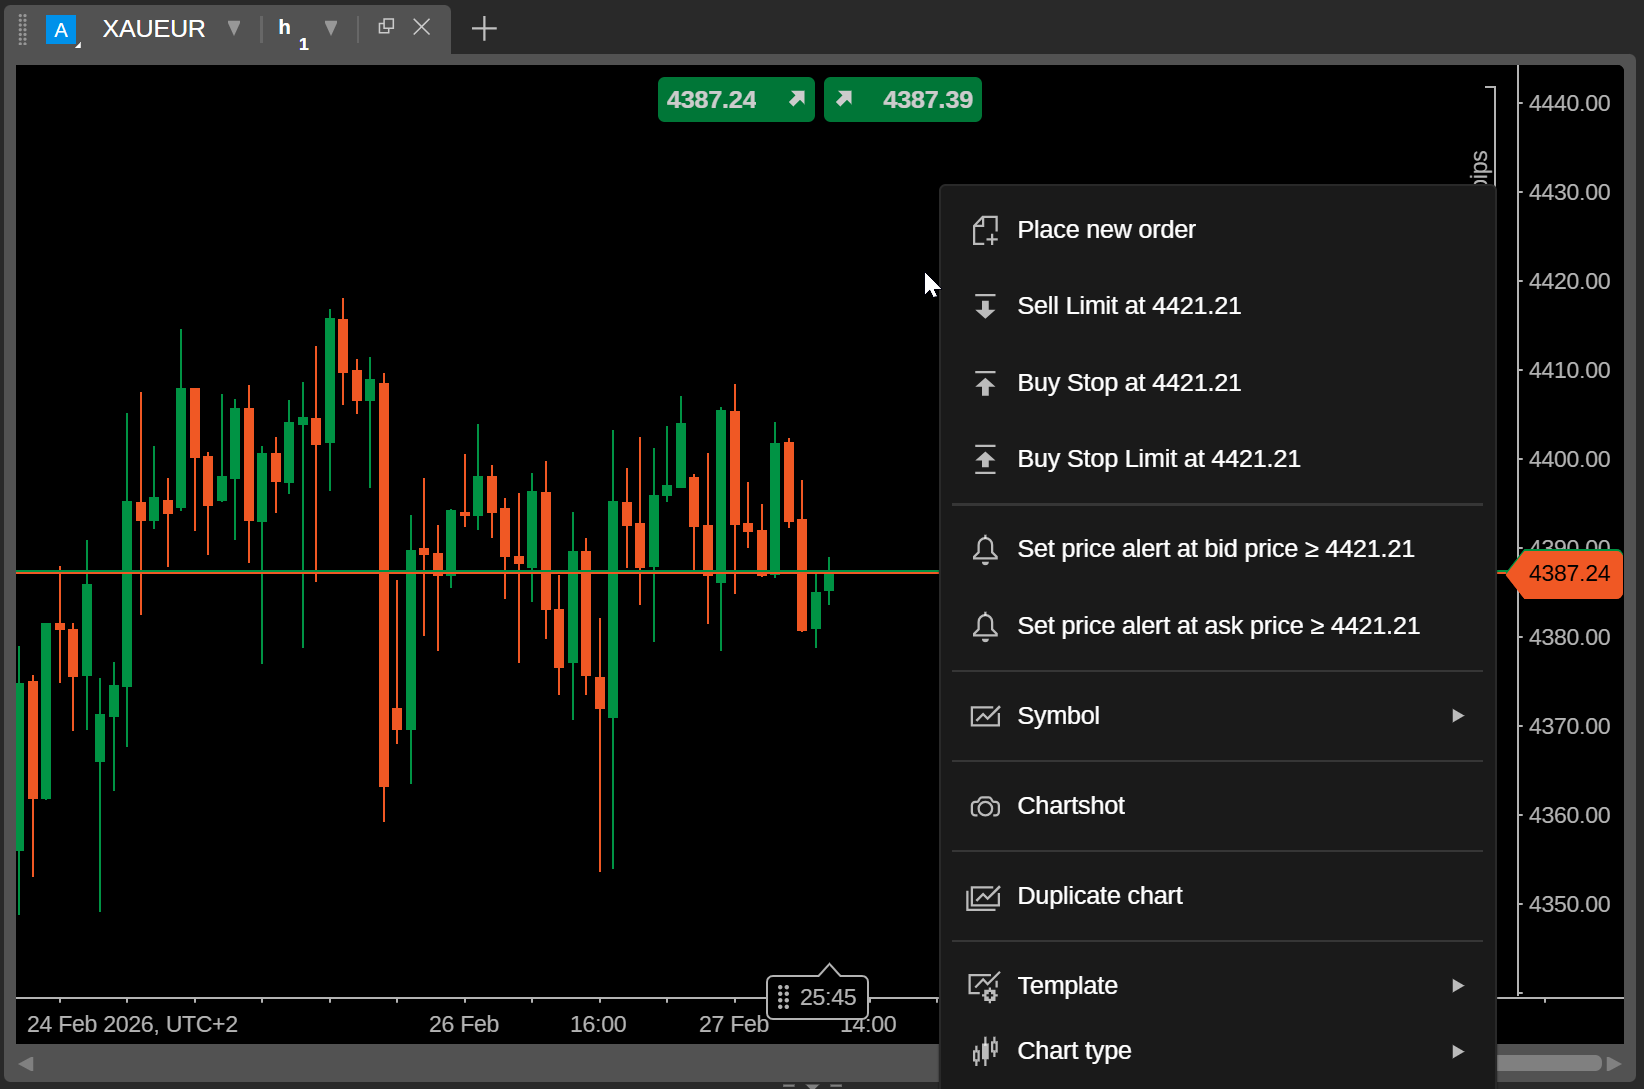
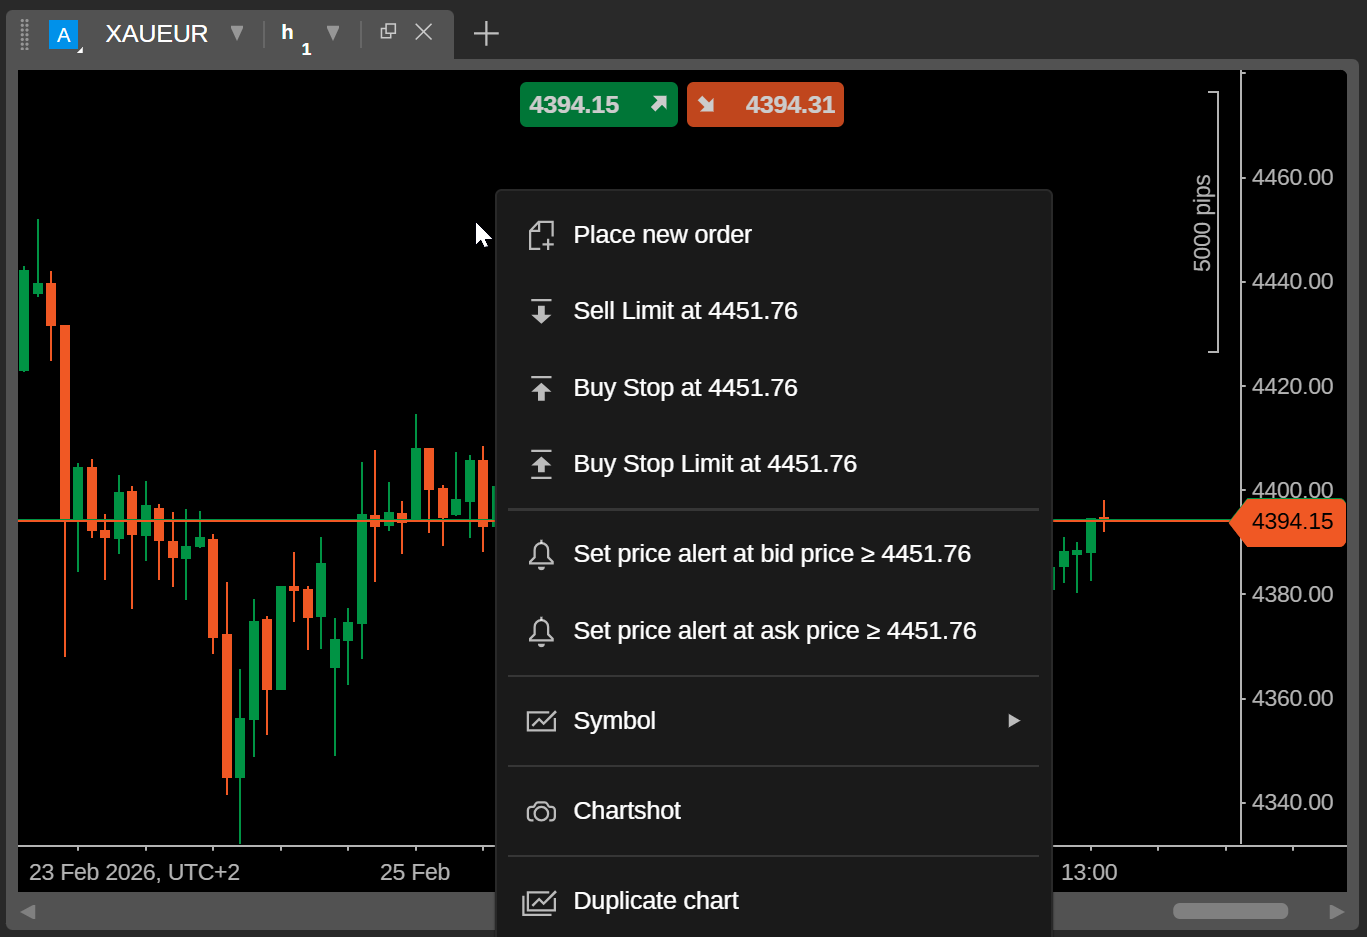
Alternatively, to create orders directly from a chart, right-click the desired price level.
A point above the ask price provides:
- Sell limit at price
- Buy stop at price
- Buy stop limit at price
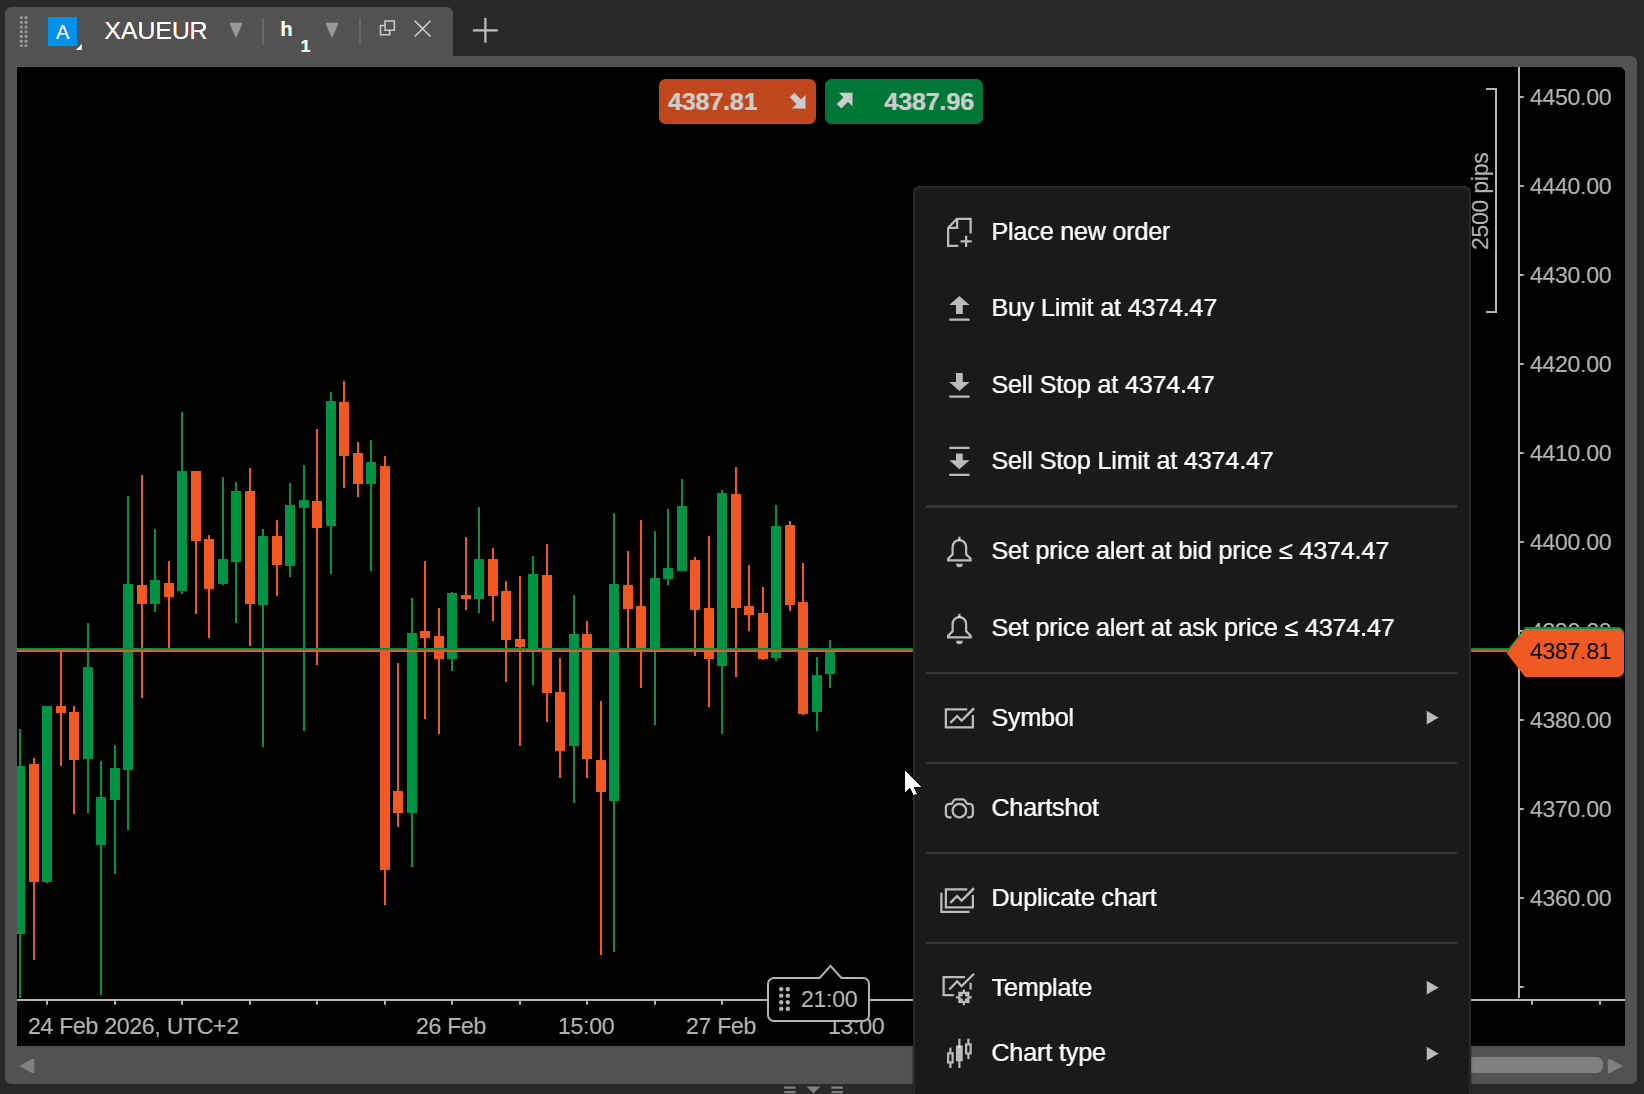
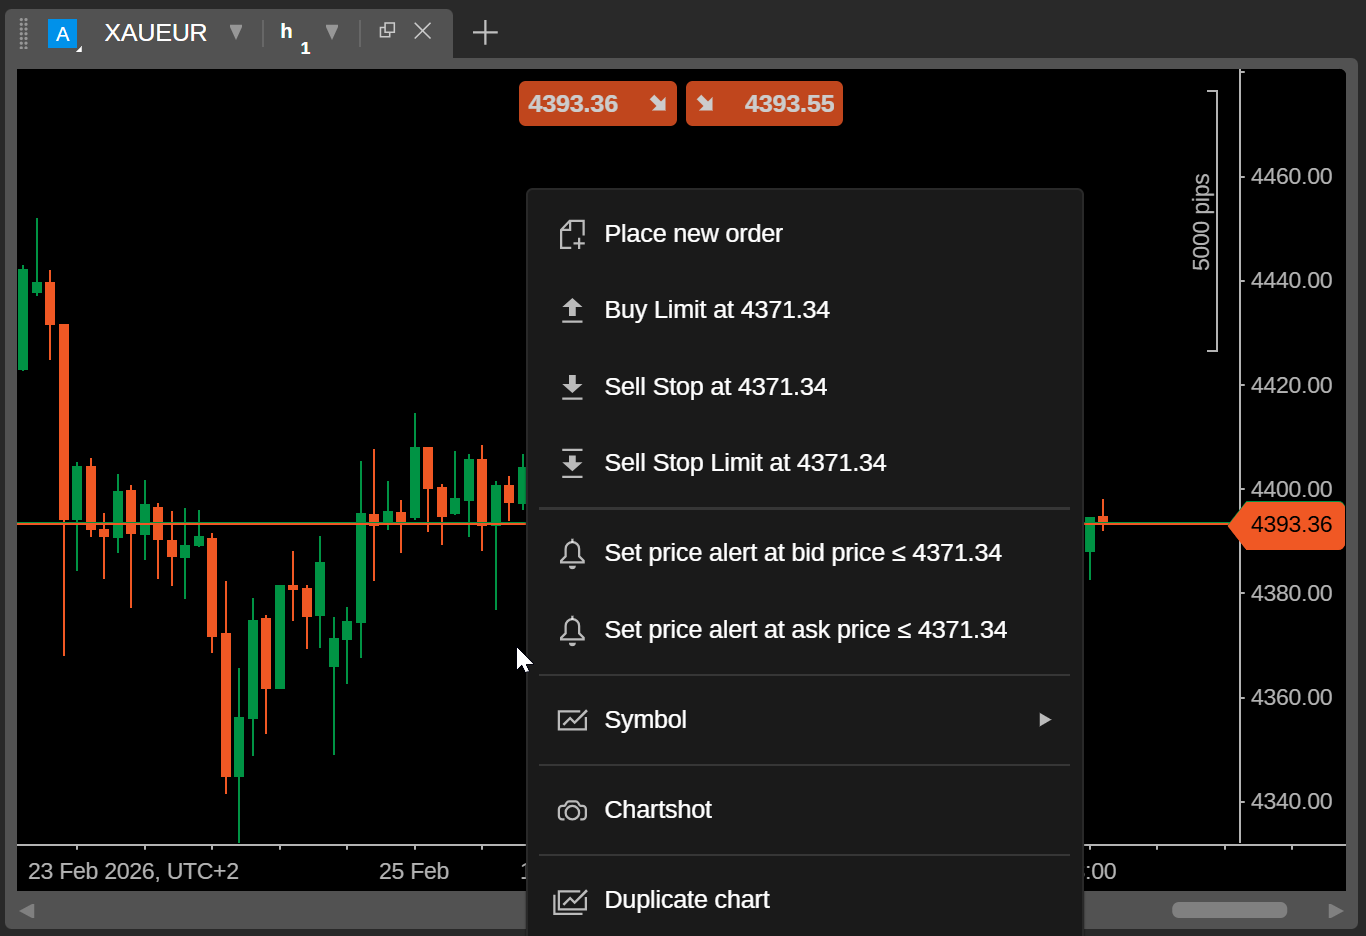
A point below the bid price provides:
- Buy limit at price
- Sell stop at price
- Sell stop limit at price
Choose an order option, and cTrader will place a pending order according to the trade volume in Quick Trade.
Orders
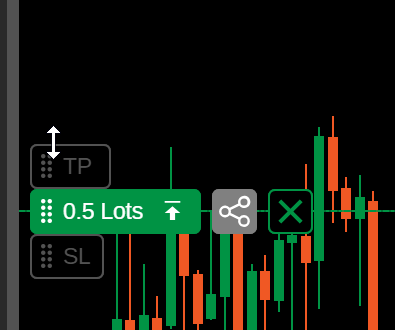
When you place a pending order for a symbol, a badge for the order becomes visible on the corresponding chart. You can drag this badge up or down to set a new price level for the order.
![]()
Clicking the Share button to the right copies a link for sharing the signal to your clipboard, while clicking the X button cancels the order.
A dot represents the creation time of a pending order.
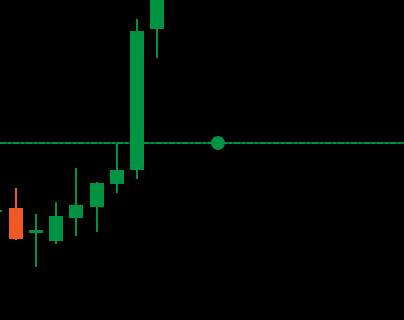
Hovering over the dot reveals the creation time and date along with a new icon. You can drag the new icon along the time axis to set an expiry time for the order.
![]()
Protections
Chart trading supports server-side protections directly from the chart, including stop loss and multiple take-profit levels for server-side scaling out.
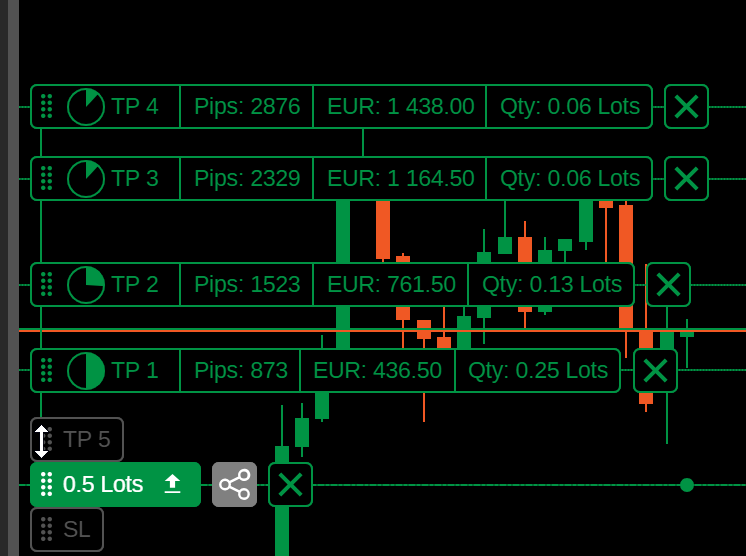
Take profit
Drag the TP control along the price axis to set a take profit for an order.
After adding one take profit, you can drag the TP control again to set another level, with support for up to five take profits in total.
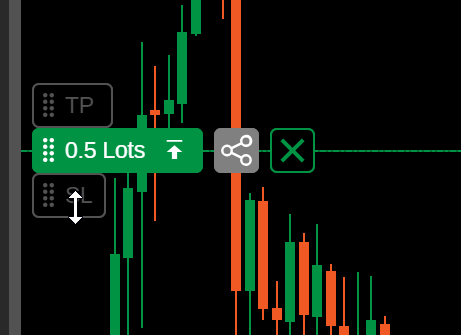
Stop loss
Drag the SL control along the price axis to set a stop loss for an order.
Note
Trailing stop loss and break-even are available only in order windows.
Positions
Similar to pending orders, badges represent open positions on charts. Hovering over a position badge reveals four buttons to the right:
- Share – copy a link to share the signal.
- Reverse – reverse the position.
- Double – double the trade volume of the position.
- Close – close the position.
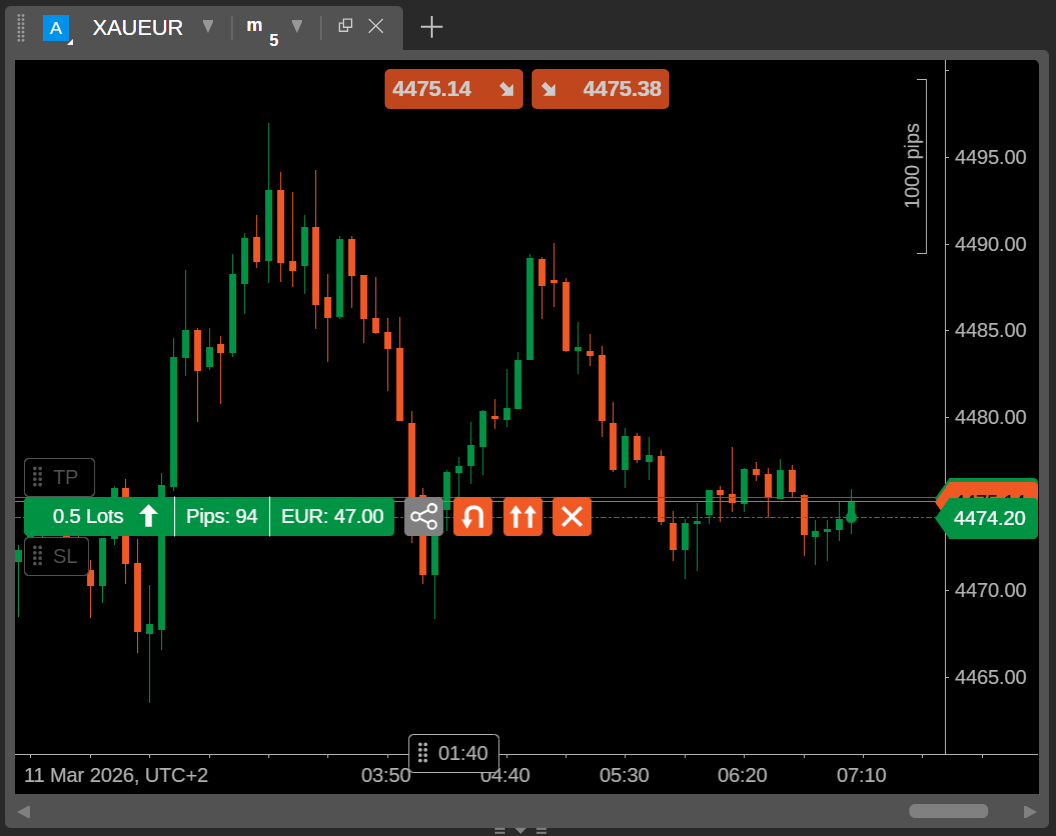
Similar to orders, dragging SL along the price axis sets a stop loss for the position, while dragging TP creates one or multiple take profits.
Price alerts
To set a price alert, right-click the desired price level on a chart
A point above the ask price provides:
- Set price alert at bid price greater than or equal to current price
- Set price alert at ask price greater than or equal to current price
A point below the bid price provides:
- Set price alert at bid price less than or equal to current price
- Set price alert at ask price less than or equal to current price
Select an option, and the price alert should appear as a yellow line on the chart by default. You can drag the alert control up or down along the price axis to modify the alert.
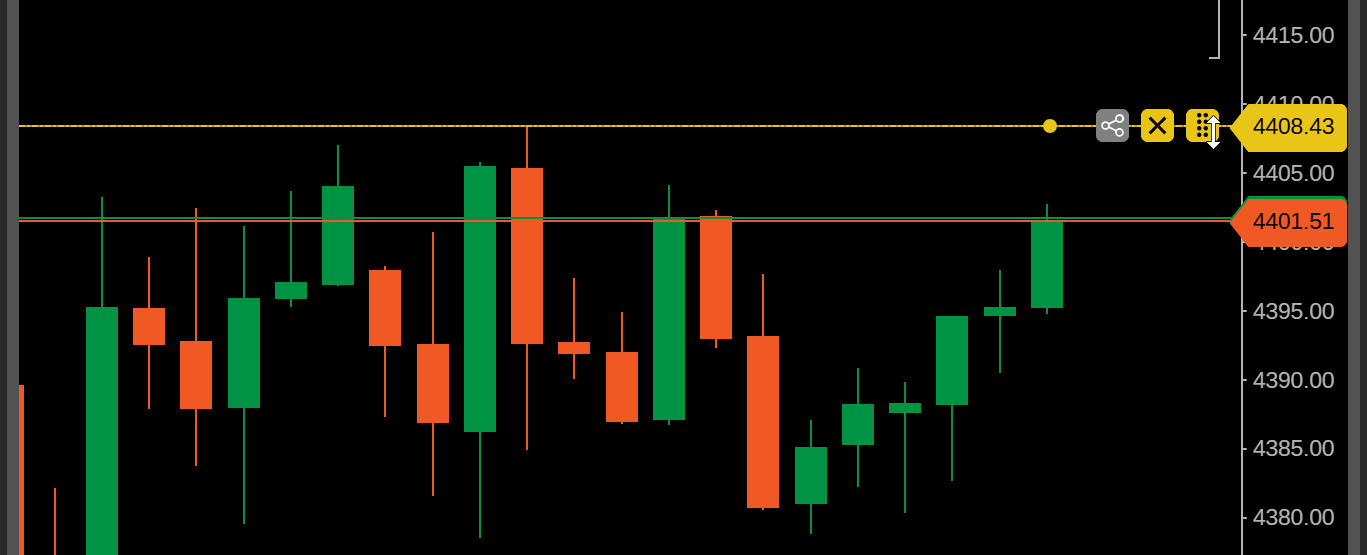
Clicking the Share button copies a link for sharing the alert to your clipboard, while clicking the X button deletes the alert.