Chart modes
cTrader offers three modes of the chart layout: Multi-chart, Single-chart and Free-chart modes. These modes change the layout of the charts on the screen.
You can switch the chart modes from the Instruments toolbar above the chart.
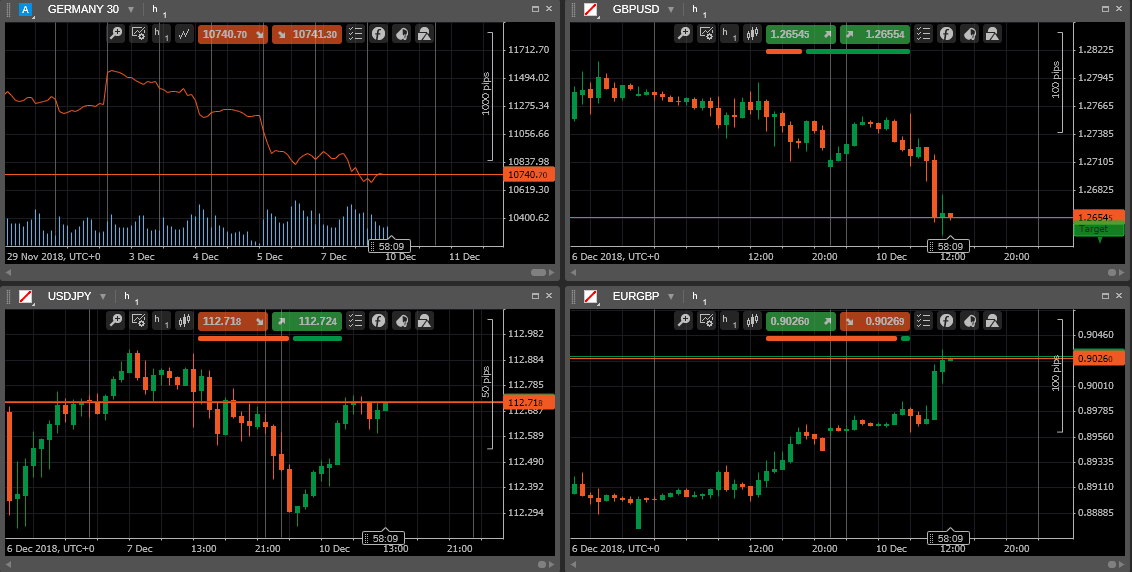
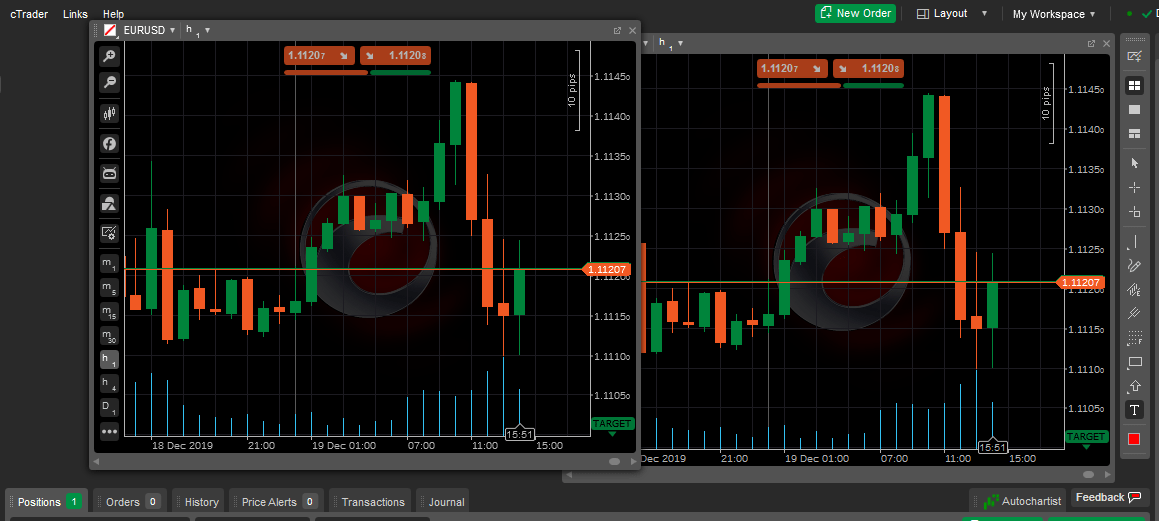
Click Multi-chart mode on the Instruments toolbar to enable Multi-chart mode. This mode is active by default.

You can add more charts and drag them around in the charts area. Learn how to add new charts from the Open charts section.
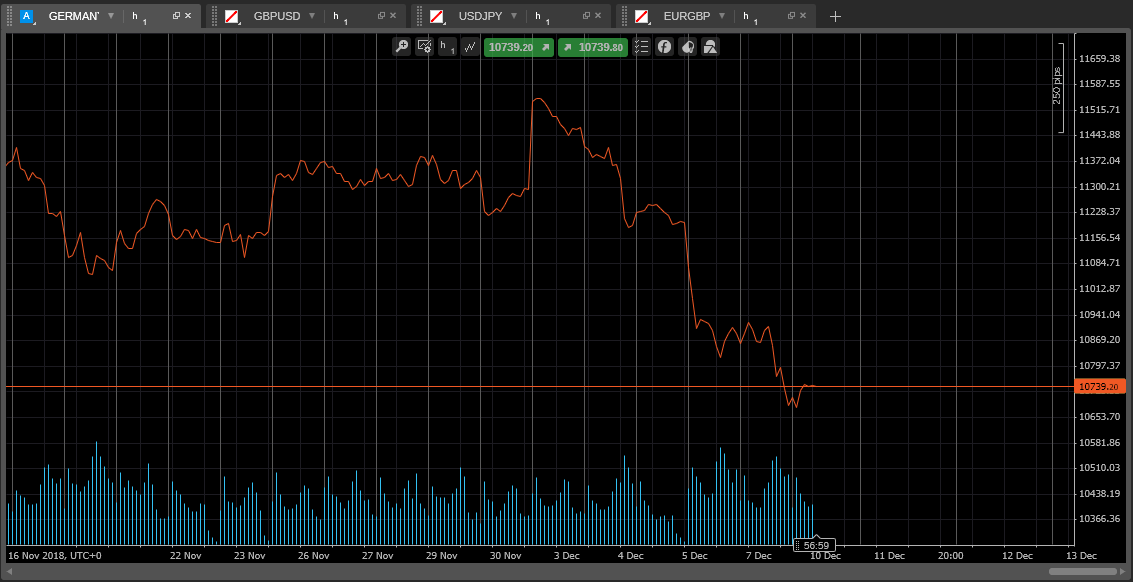
Click Single-chart mode on the Instruments toolbar to enable Single-chart mode.

In this mode, one chart fills the entire charts area, and the other charts are displayed as tabs at the top of the chart area.
You can switch between the charts by selecting the tabs above. To add a new chart, click the Plus icon next to the tabs.
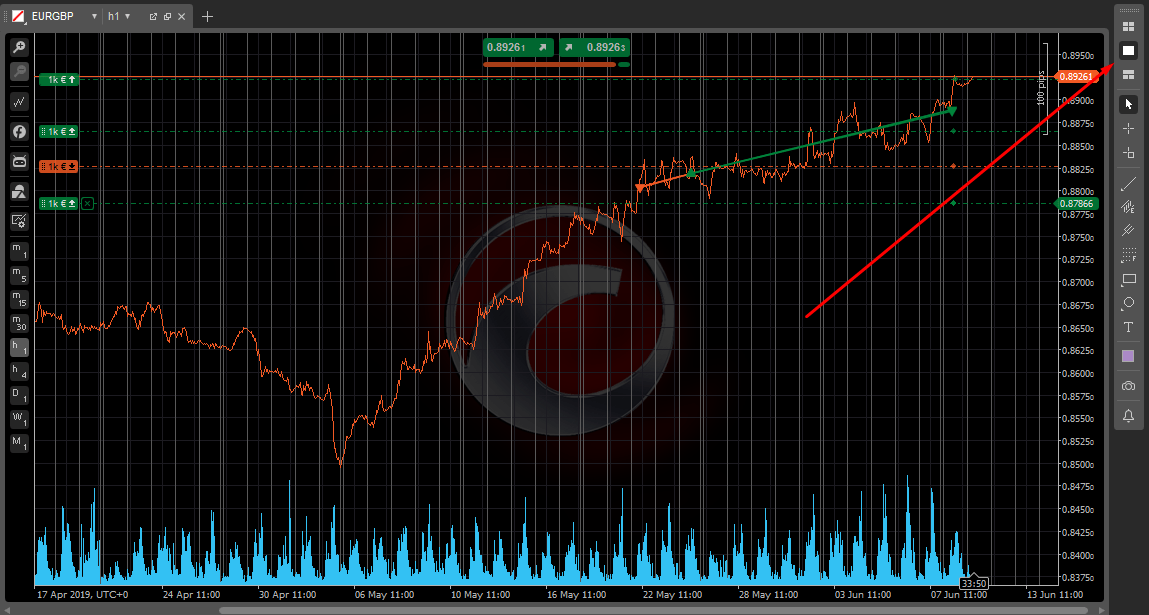
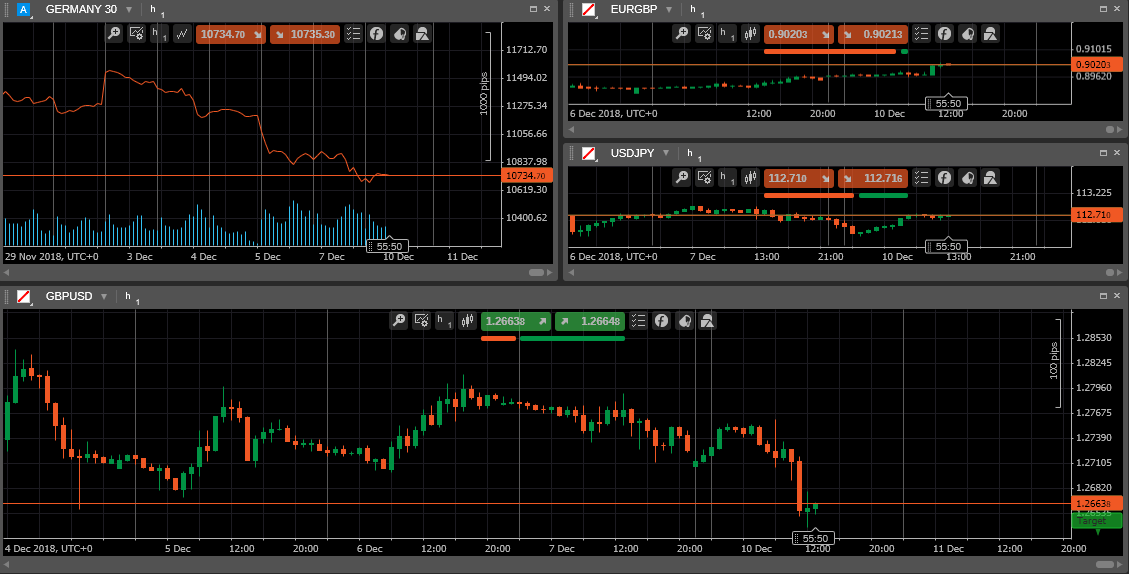
Click the Free-chart mode on the Instruments toolbar to enable Free-chart mode. It is similar to Multi-chart but also allows resizing each chart individually.

Detached charts
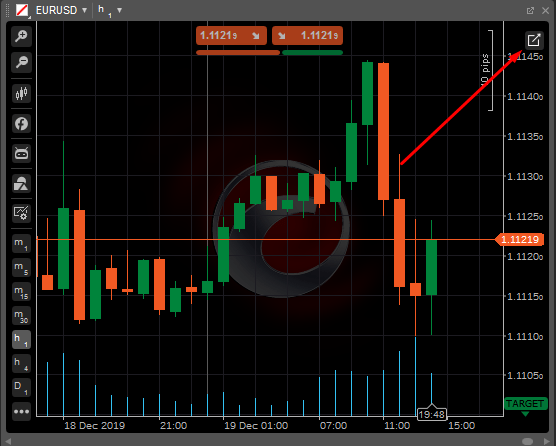
When you have several charts opened in any of the three modes, you can detach charts opening them in new windows along with the toolbar. To detach a chart, click the Detach chart button in the upper right of the chart.
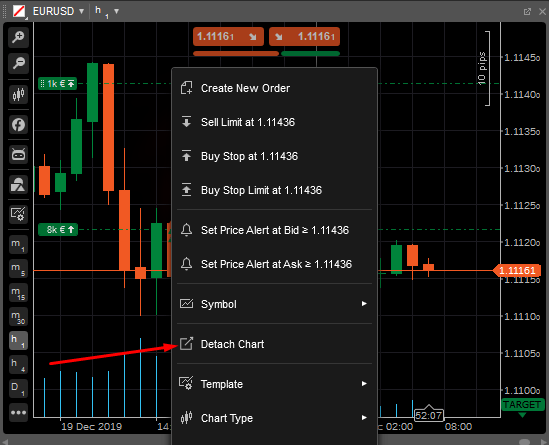
Alternatively, right-click anywhere on the chart and select Detach chart from the drop-down.
The chart will open in a new window along with its separate toolbar.
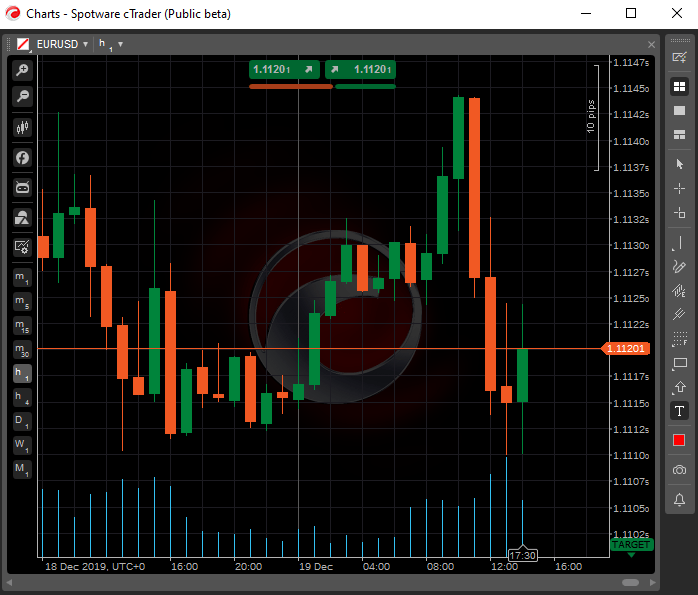
Click Reattach chart to return the chart to the cTrader charts area.
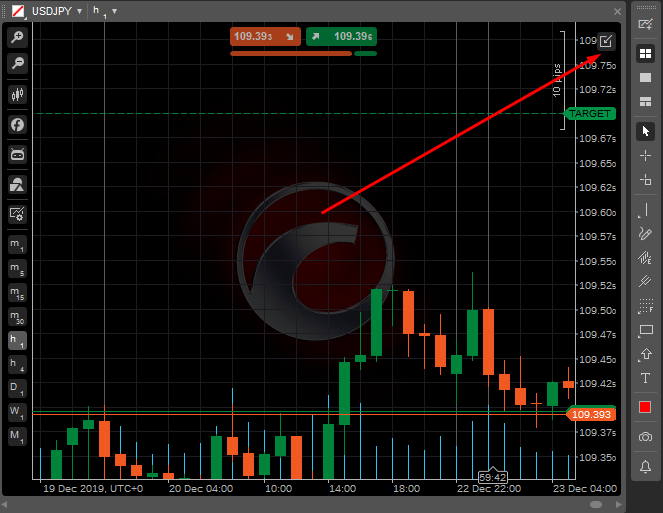
Also, you can drag charts between detached containers or drag them back to the cTrader charts main window. Just drag the detached charts holding them by the tabs.
Hotkeys
Use the following Hotkeys for the chart settings:
- F2 – Switch chart mode
- F3 – Switch layout
- Ctrl + 1 – Bar chart
- Ctrl + 2 – Candlestick chart
- Ctrl + 3 – Line chart
- Ctrl + G – Show or hide grid
- Ctrl + B – Bid
- Ctrl + A – Show ask