Chart toolbar
The Chart toolbar is located at the top of the currently opened chart. It contains the following options:
- Workspace
- Layouts
- Chart modes
- Zoom in/out
- Chart type
- Indicators
- cBots (trading robots)
- Chart objects
- Hide all drawings
- Chart templates
- Bar periods
Workspace

Workspace is a cTrader cloud feature that allows users to set up and save different cTrader settings that can be used from multiple accounts, with different brokers, and on different devices.
You can create as many workspaces as you need and use them across different brokers and different computers, by logging in with your cTrader ID.
Workspaces organise various software settings:
- Charts and chart configuration
- Quick Trade parameters
- Colour theme, layout, language and sound settings
- Asset display settings
- Symbols list settings
- In-app notification settings
Note
Workspaces created in cTrader Web do not work in the desktop versions of cTrader and vice versa.
Manage workspaces
After the first login, cTrader automatically creates a new workspace (My workspace) for you. All changes are automatically saved in My workspace.
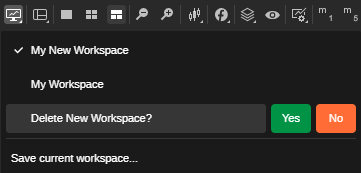
To create a new workspace, hover over the Workspace icon in the Chart toolbar, click Save current workspace, type in the desired name and click Save.
To delete a workspace, hover the Workspace icon in the Chart toolbar, click the x button next to the workspace that you want to delete and confirm your action.
All changes are automatically saved when you switch to another workspace or close the cTrader app.
Layouts

The layouts settings let you show or hide the Active Symbol Panel on the right and the Trade Watch panel at the bottom. Hover over the layouts icon and select the desired options from the drop-down.
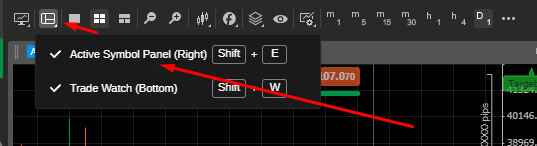
Chart modes

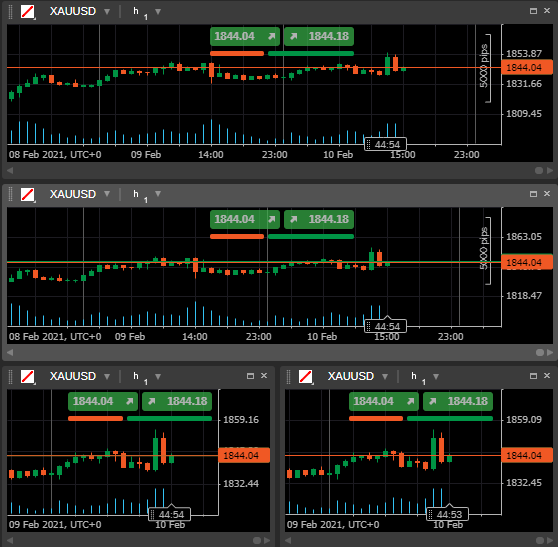
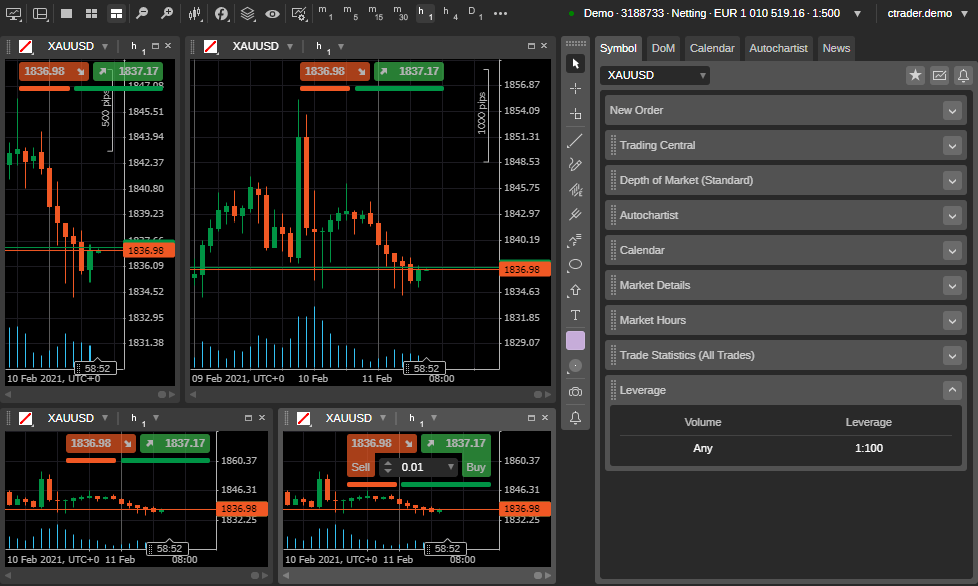
cTrader offers three chart layout modes: Multi-chart, Single-chart and Free-chart. These modes change how charts are arranged on the screen.
You can switch chart modes from the Chart toolbar above the chart. Click Multi-chart to enable it (this is the default setting). Add more charts and drag them around in the charts area.
Learn how to add new charts in the Open charts section.
Click Single-chart in the Chart toolbar to enable Single-chart mode.
In this mode, a single chart fills the entire charts area, while other open charts are shown as tabs above the chart area. Switch between charts by selecting the tabs. To add a new chart, click the Plus icon next to the tabs.
Click Free-chart mode on the Chart toolbar to enable it. This mode is similar to Multi-chart, but it also allows you to resize each chart individually.
Zoom in/out

Hover over the Zoom in or Zoom out button on the chart, then use the corresponding buttons or Zoom slider to adjust the chart scale. The price axis (vertical) and time axis (horizontal) scale automatically when you change the zoom level.
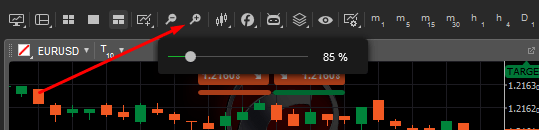
Alternatively, use the hotkeys + and - for zoom in and zoom out respectively.
Chart type

There are four standard chart types available in cTrader Windows:
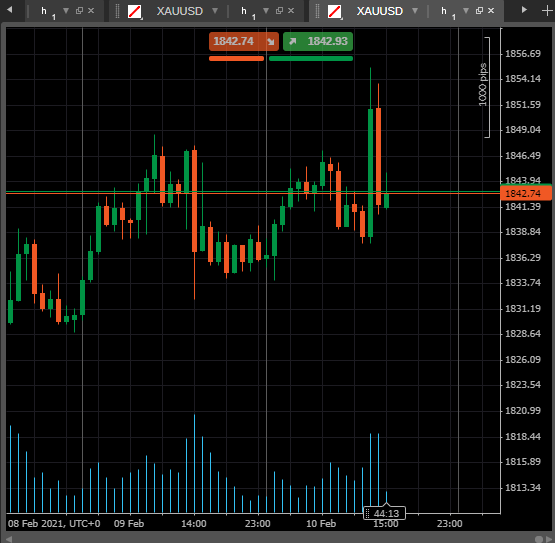
Bar chart (OHLC)

Displays the open, close, high and low prices for the selected period using bars.
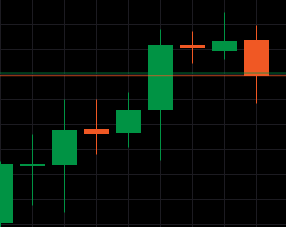
Candlestick chart

Consists of a series of open-high-low-close (OHLC) candles arranged by period. The candlesticks chart is the most widely used chart type, but you can explore other types to see which one best suits your needs in a given situation.
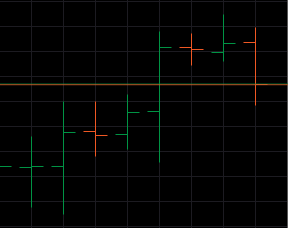
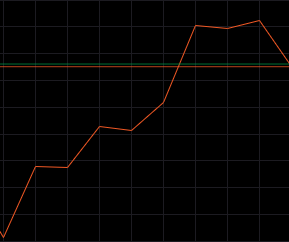
Line chart

Draws an unbroken line connecting the closing prices for the selected period.
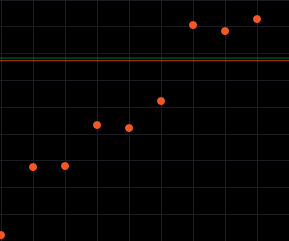
Dot chart

Displays only the closing prices for the selected period as dots.
To change the chart type, hover over the Chart type icon in the Chart toolbar (candlestick, by default) and select the desired type from the drop-down. Alternatively, right-click anywhere on the chart and select Chart type from the drop-down.
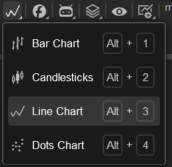
Alternatively, use the shortcuts Alt+1, Alt+2, Alt+3 or Alt+4 to switch between the bar, candlestick, line and dot charts respectively.
Indicators

Indicators are tools used to detect specific technical patterns and, optionally, respond to them. An indicator performs mathematical calculations based on the price and volume of the symbol over a given period.
Add an indicator
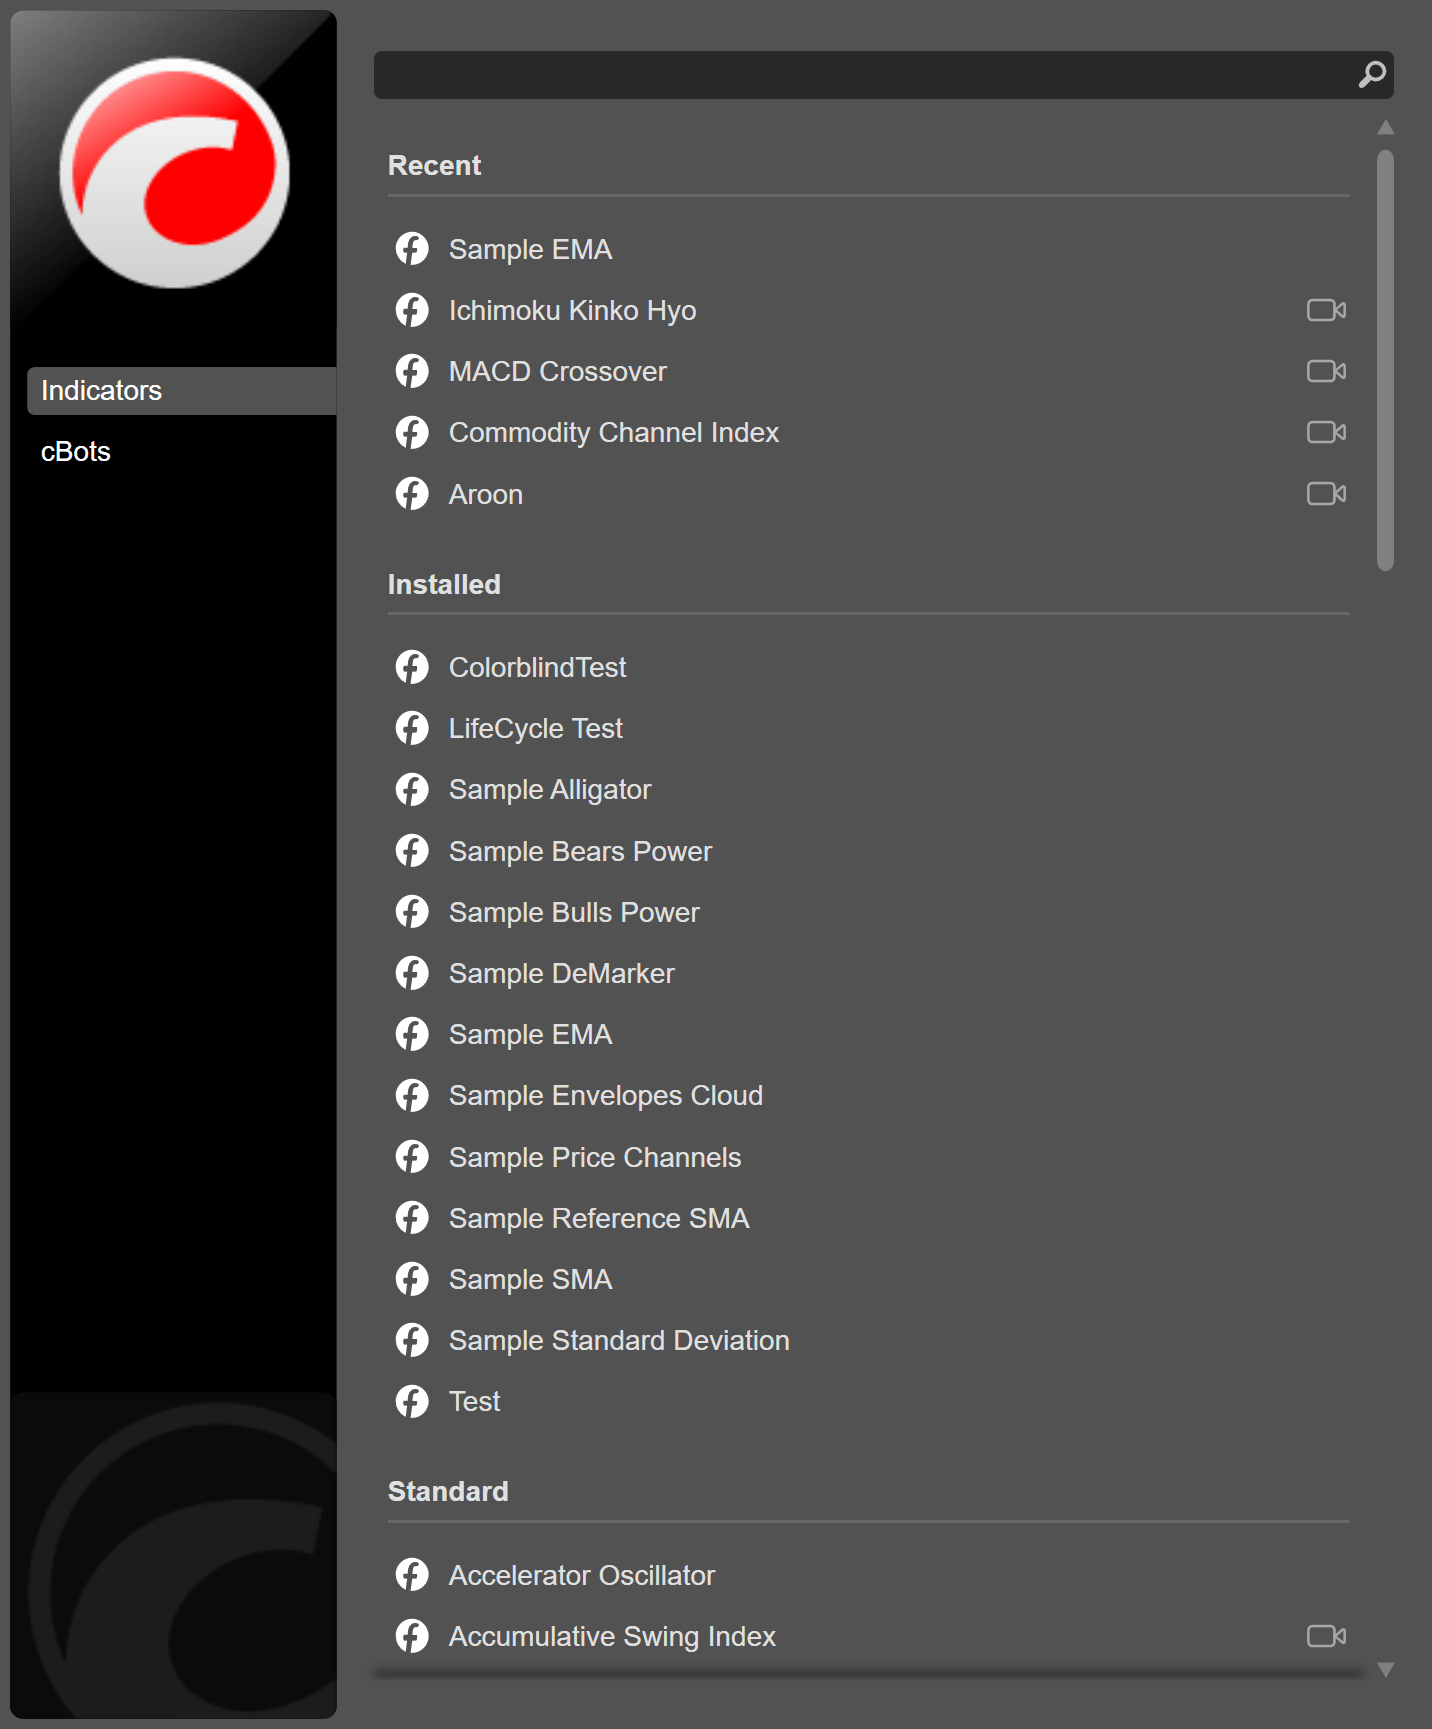
Click the Indicators icon in the Chart toolbar or right-click in the chart area and select Indicators from the context menu.

The Indicator & cBots window will appear where you can select from the full list of available indicators.
When selecting an indicator of your choice, you can customise the parameters, lines, levels and additional settings of each indicator in the Add indicator window. There are Open and Save as buttons for each indicator in the top-right corner.
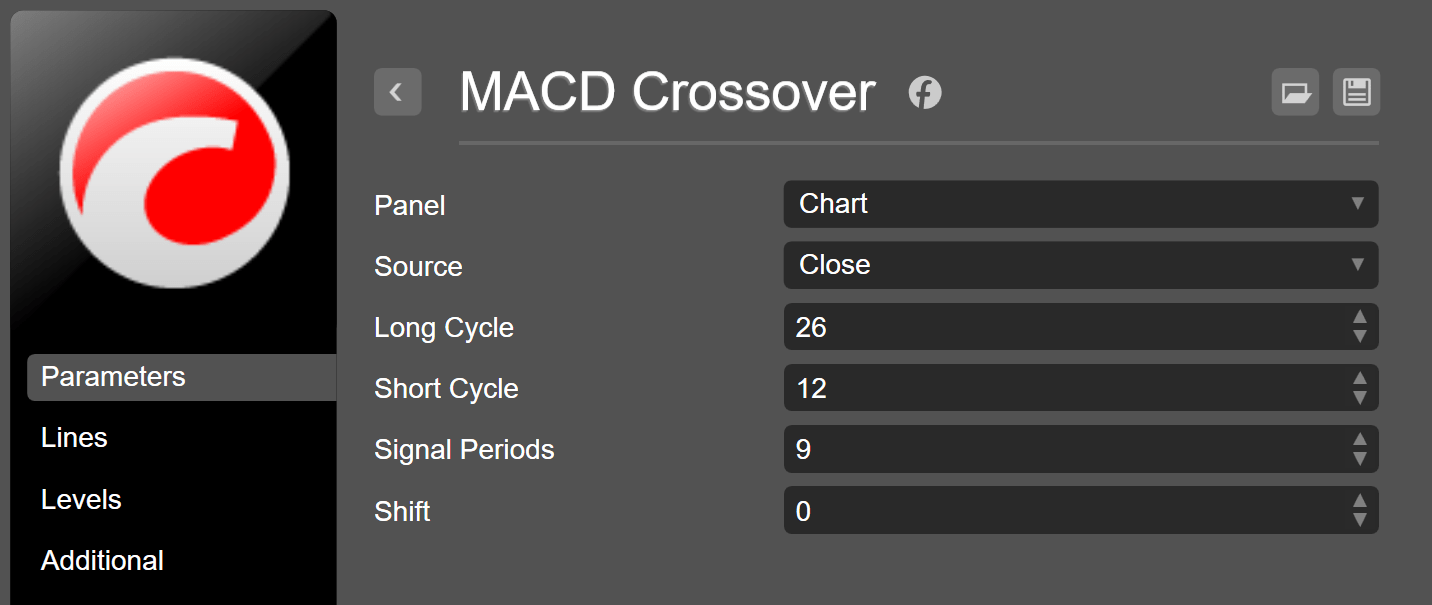
In addition to the key indicator parameters listed in the Parameters tab, you can select a panel to which the indicator will be added. Indicators can be added directly on the main chart, the existing separate panel under the chart or a new separate panel. In the Lines tab, you can adjust the colour, thickness and type of the indicator lines.
Click Add to chart at the bottom of the window to add your desired indicator.
Manage indicators
Hover over the indicator bar with its parameters in the chart area or the separate panel to manage your added indicator. Using this functionality, you can either make the indicator invisible or call the Modify indicator window by clicking the relevant icons.
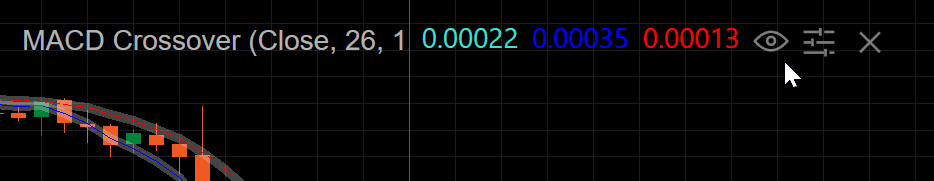
Alternatively, the Modify indicator window can be opened by right-clicking one of the indicator lines.
The Object manager is another convenient method to manage all your indicators in one place. Click or hover over the Object manager button in the main menu or use the Ctrl+I hotkeys.
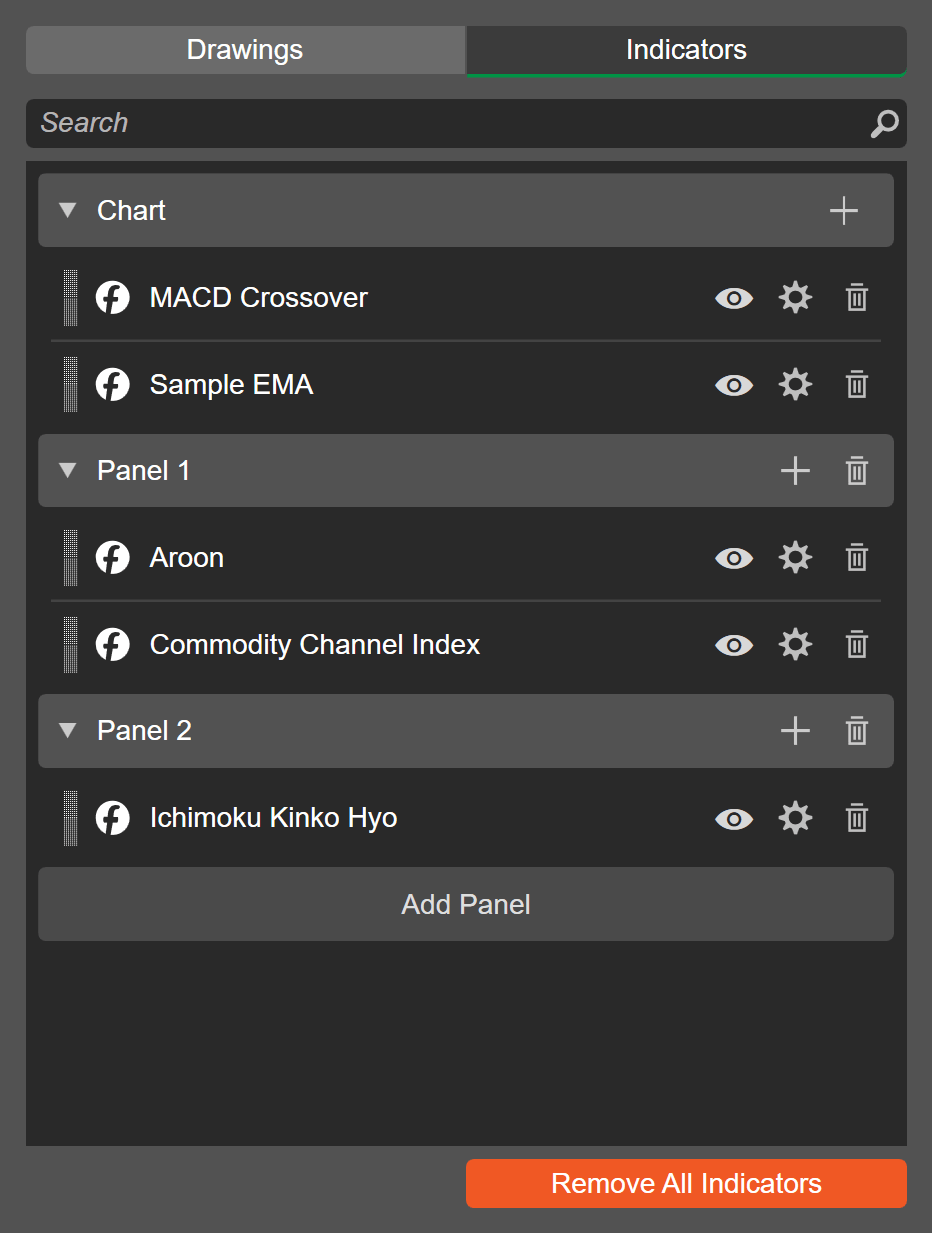
Apart from hiding indicators and adjusting parameters, you can manage how they are overlaid. Drag and drop your indicators from panel to panel or let them be shown in the main chart. You can also add new indicators by clicking the Plus button to the right of the chart/panel, add new panels and delete them.
The indicator overlay displayed in the Object manager window above would correspond to the following chart and panels area in cTrader.
Delete indicators
Use one of the following methods to delete an indicator:
- Click the x icon after hovering over the indicator bar.
- Click the Bin icon in the top-right corner of the Modify indicator window.
- Choose Remove all indicators after hovering over the Object manager button in the main menu.
- Remove indicators one by one, all indicators at once or entire panels in the Object manager window.
- Close the separate panel under the chart to remove the indicators displayed in it.
cBots (trading robots)

cBots are algo trading solutions that trade automatically based on the technical analysis signals. You can add and manage cBots directly from the Chart toolbar.
Learn more about cBots here.
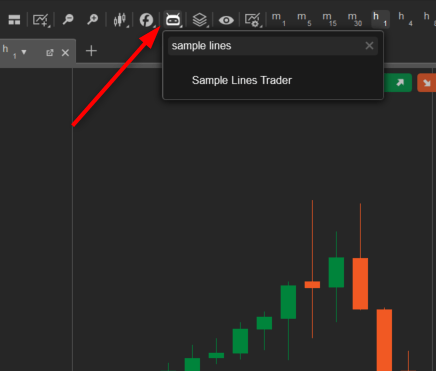
Hover over the cBots icon in the Chart toolbar to expand the cBots section. Here you can find the desired cBot by typing in its name or part of it in the search box.
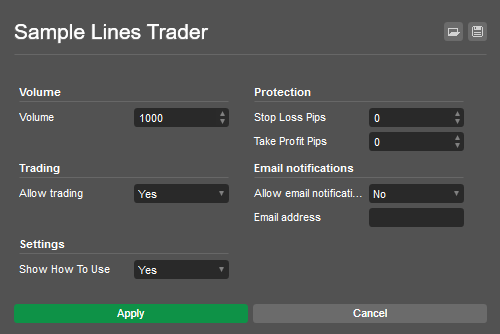
Select the desired cBot from the list to open its menu. Enter the required values to complete the cBot settings and click Apply.
Note
Settings may vary depending on the cBot.
When done, the new instance of the cBot appears on the chart. Double click it to open its settings again. Click Play to start the cBot. Click the x icon to remove a cBot from the chart.
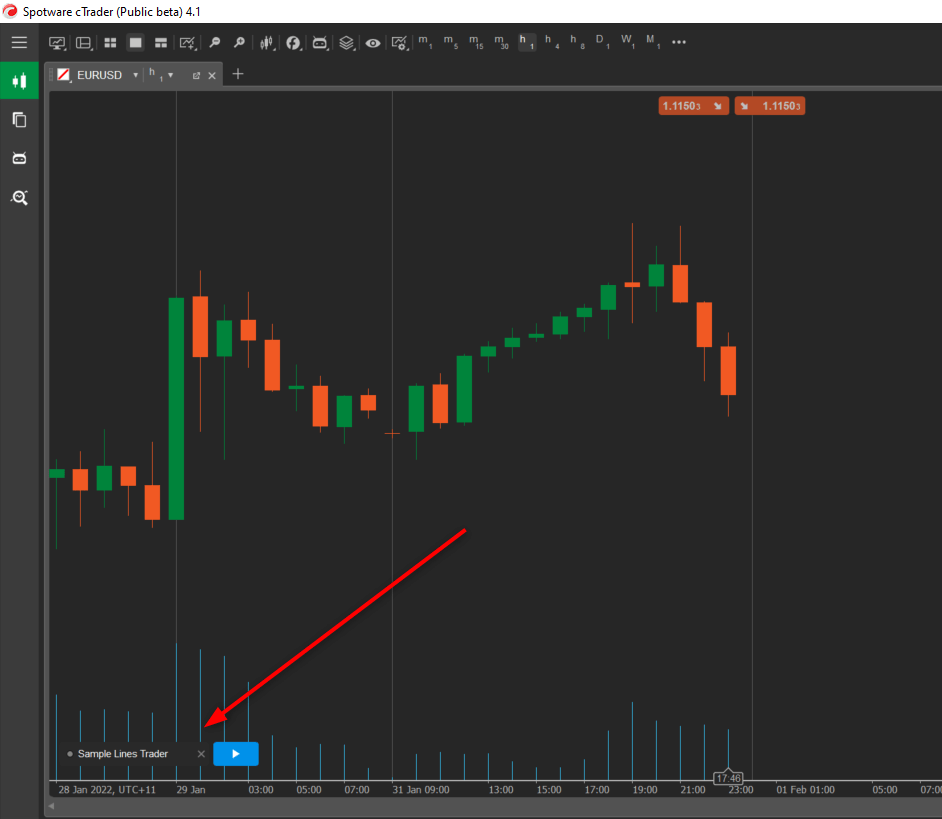
Chart objects
cTrader provides a range of chart objects to support trading and analysis, and you can learn to use these objects.
Hover over the Objects icon to open the chart object menu. Here, the number of drawings and indicators on the chart is displayed. Clicking Drawings or Indicators opens the object manager, and clicking Remove all drawings or Remove all indicators deletes all the corresponding objects from the chart.
![]()
In the object manager, the Drawings tab displays all objects, excluding indicators, on the active chart. Here, you can drag an object up or down the list to control its layering or intersection with other objects. The Indicators tab displays all indicators on the active chart or in panels below it. Learn how to manage indicators.
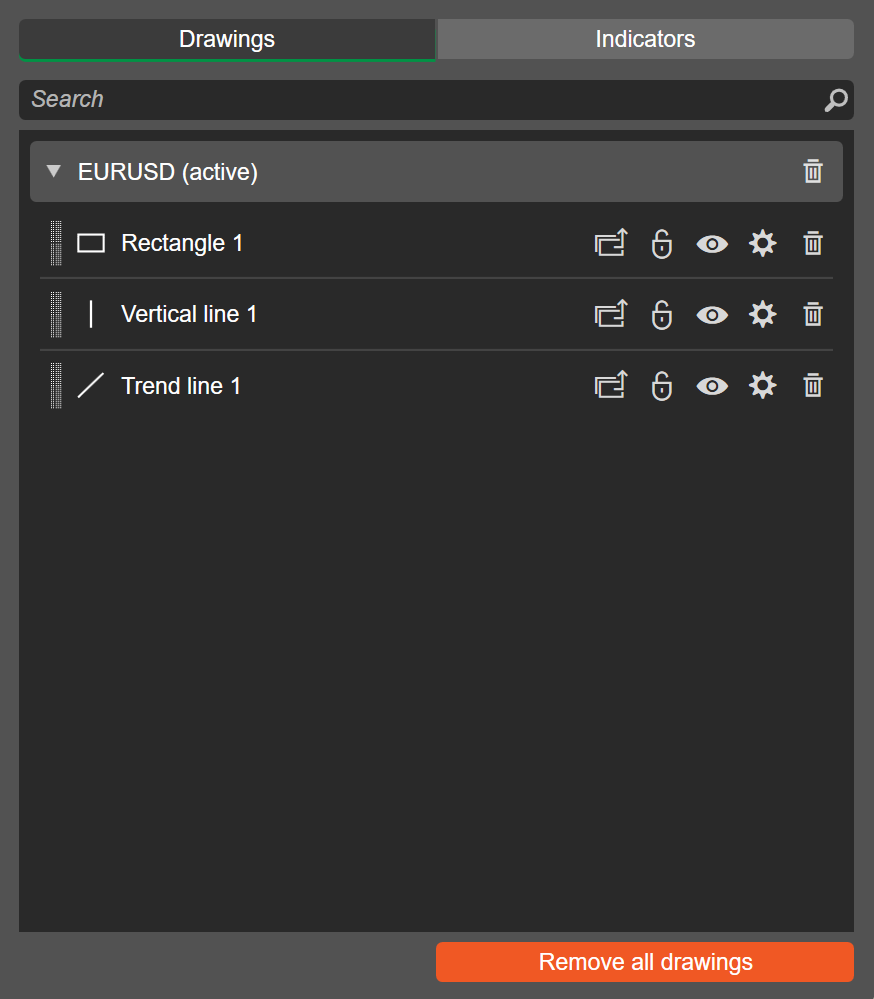
The following options are available for the chart objects:
- Move to current/Move to cross-symbol (for drawings only) – click to move the chart object to the cross-symbol chart (which means the object will be placed by default on every symbol chart you open), or move it back to the current chart only.
- Lock/unlock object (for drawings only) – when an object is locked, you cannot move it on the chart. Use this option to avoid accdental movement of objects.
- Hide/unhide object (for drawings only) – click to hide or show the object on the chart.
- Settings – click to open chart object settings.
- Remove – click to remove the chart object completely. Alternatively, use the Bin icon in the symbol drop-down tab to remove all chart objects for the symbol (or cross-symbol), or click Remove all drawings/Remove all indicators.
Hide all drawings

Click the Hide all drawings icon to hide or unhide all drawings currently placed on the chart. When unhidden, drawings appear in the same position with the previously set parameters.
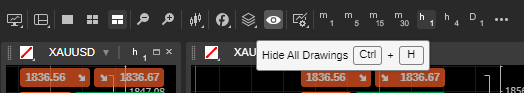
Chart templates

Chart templates let you quickly apply different chart settings and viewing options by changing the template. There are three default chart templates available:
- Range – optimised for analysing the price range (Candlestick, medium scale, Relative Strength Index indicator, Stochastic indicator and tick volume enabled);
- Trend – optimised for analysing the trend (line chart, small scale);
- Volatility – optimised for analysing the volatility (Candlestick, medium scale, Bollinger Bands, and Standard Deviation indicators enabled).
The default template is Candlestick, medium scale and no indicators.
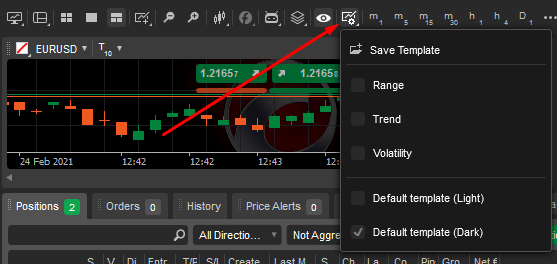
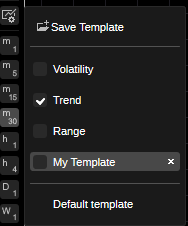
To change the chart template, hover over the Chart template icon and check the desired template. The selected template will be applied to all new charts being opened.
Custom chart templates
cTrader allows creating as many custom chart templates as you need.
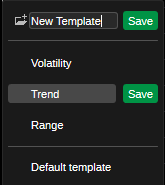
To save all the various chart settings as a new template, hover over the Chart template icon, click Save template, then type in the template name and click Save.
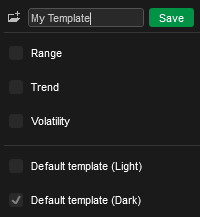
To save changes to an existing template, hover over the Chart template icon, click Save template, then click the existing template, click Save and confirm the overwrite.
Note
You cannot edit the default template.
To delete a template, hover over the Chart template icon and click the x next to the template you would like to delete.
Bar periods

cTrader Windows charts can be displayed based on a large number of predefined bar periods. Bar periods include standard time-based bars, tick-based bars, renko bars and range bars.
Tick-based bars
Tick-based bars use a predefined number of pips to create a bar. For example a 50-ticks bar includes price information for 50 ticks. Every 50 ticks, a new bar is added to the chart.
Standard time-based bars
Standard time-based bars display the price information within a given period. For example, a one-hour bar includes price information for one hour. Every hour, a new bar is added to the chart.
Renko bars
Renko bars display a new bar as soon as the price has moved a certain distance in pips from the previous renko bar open or close price.
For example a 5-pips renko bar is added to the chart every time the price moves 5 pips from the opening or closing price of the previous renko bar. You can read more about renko bars here.
Range bars
Range bars display a new bar as soon as the price has moved within a certain range of pips.
For example a 5-pips range bar is added to the chart every time the price moves within a range of 5 pips. Learn more about range bars here.
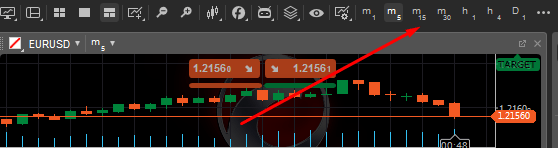
By default, the chart is built based on the 1-hour period and several period options are available in the Chart toolbar. Click any of them to apply it to the chart immediately.
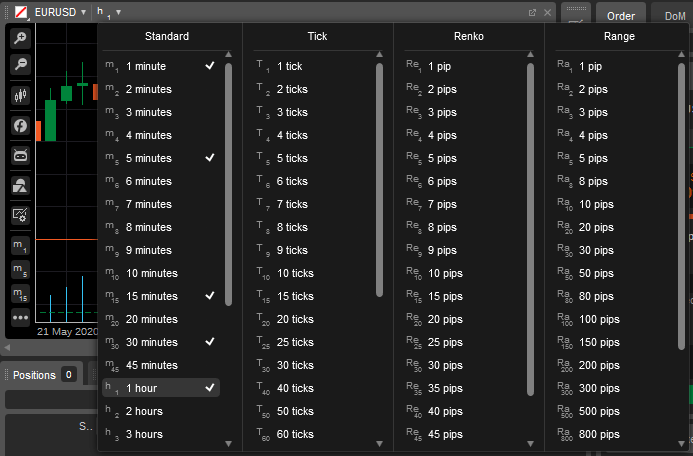
Click the Period button at the top of the chart to view all available periods: standard, ticks, range and renko.
The standard period lets you select a period from 1 minute to 1 month to apply for the chart. With the ticks period, you can set the number of ticks from 1 to 1,000.
In range bars, all price bars are equal in length. For example, a 10-pip range bar creates bars with a 10-pip high-to-low range. The close of each bar always matches the open of the next, and the range is based on high and low values, not close prices.
In the renko bars, every bar is of the same length (including reversals, but price must travel two times the renko bar in the opposite direction).
Mark the desired periods to enable their quick-access buttons in the Chart toolbar.
Each button displays the current period or tick count in its title. For example, T10 indicates a tick chart with 10 ticks.
Tip
Use the Up and Down arrow keys on your keyboard to switch the periods.
Countdown box
cTrader displays a live countdown to the next bar, line, point or candlestick in time units or ticks. The Countdown box appears on the time axis at the bottom of the chart.