Open charts
cTrader charts represent the price movements of a symbol over time. The chart is the most basic tool for trading technical analysis, and cTrader offers a comprehensive customisation system to help you get the most out of it.
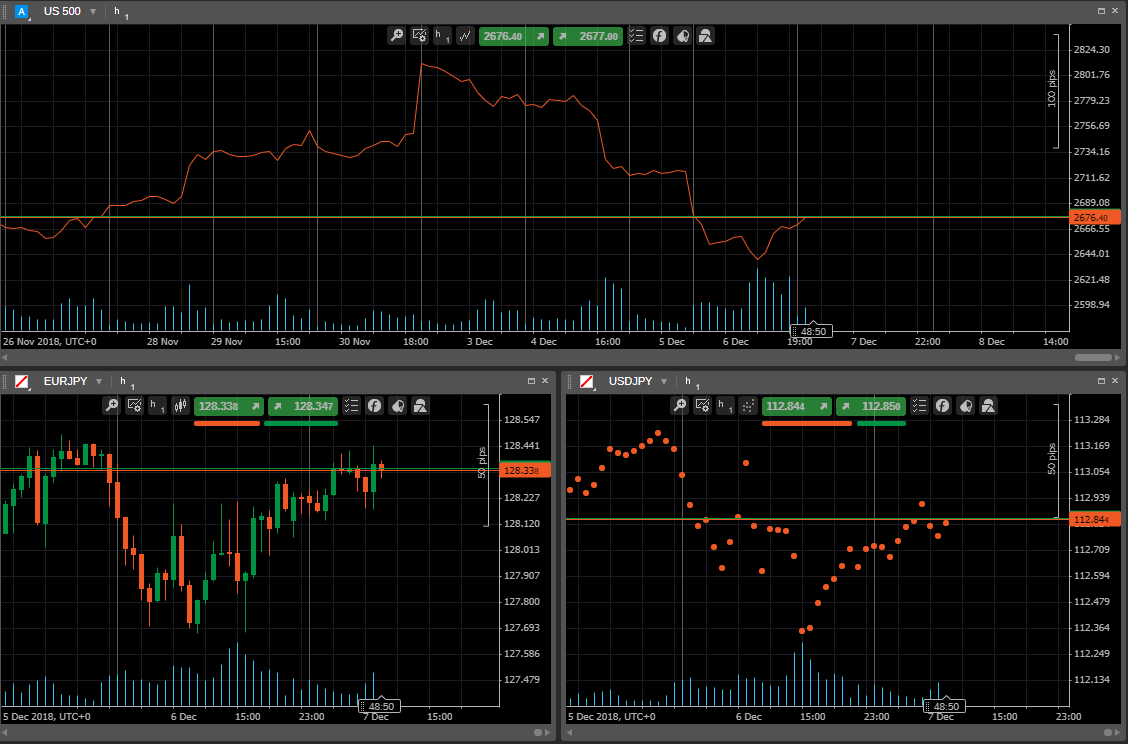
The Quick Trade mode and in-chart trading tools allow you to open all types of orders, close positions, set protections and price alerts directly in the charts. You can also display as many charts on the screen as needed, add new charts, move them around the charts area and change the chart modes to adjust the layout.
Use the following shortcuts for navigation:
- Ctrl + A – enable or disable the ask price line.
- Ctrl + B – enable or disable the bid price line.
- Ctrl + G – enable or disable the chart background grid.
- Left – scroll 2 trend bars left.
- Right – scroll 2 trend bars right.
- Up – previous period.
- Down – next period.
- Ctrl +
scroll- zoom in or out.
Drag the chart up and down, left and right to view the desired area on the chart.
Open a chart
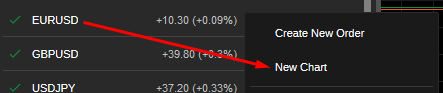
When you have selected a symbol in Active Symbol Panel, click the Chart icon to open the corresponding chart or right-click the symbol in the panel, and select New chart from the submenu.
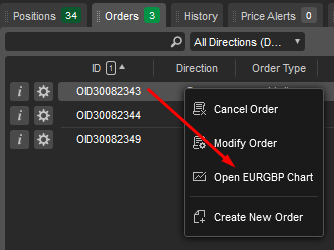
Alternatively, right-click on the open position or pending order, and select Open chart and the new chart will be added.
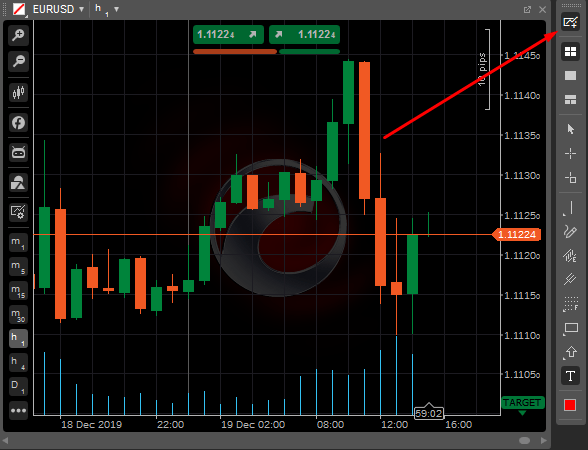
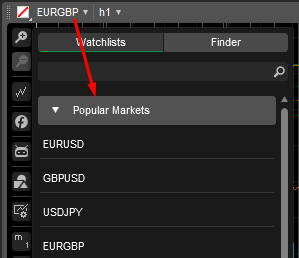
If you do not want to add new charts, you can change the symbol of the currently opened chart. Click the symbol in the upper left of the currently opened chart and select the desired symbol from the dropdown.
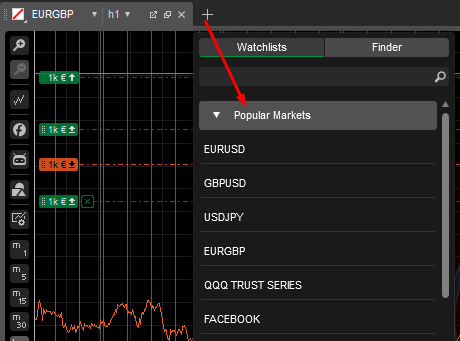
If you use the Single-chart mode, then you can open a new chart by clicking the Plus icon next to the opened chart tab. Click the Plus icon and select the desired symbol to open a new chart.
Also, when using the Multi-chart or Free-chart mode, you can open new charts with the New chart button directly from the toolbar.