Active Symbol Panel
Symbol – a financial instrument, any tradable asset purchased by an investor.
cTrader is a multi-asset-class CFD trading app that allows investors to profit from stocks, indices, commodities, forex, ETFs and cryptocurrencies.
Active Symbol Panel (to the right) provides access to all details about the selected symbol and allows entering trades directly from the panel. The panel is displayed by default but if it is hidden, proceed to Layout settings and select Show Active Symbol Panel. Alternatively, use the shortcut Ctrl + S to toggle Active Symbol Panel.
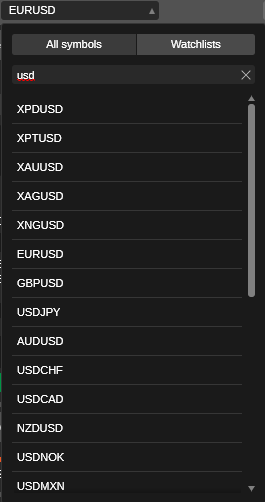
Click the Symbol tab in the upper left to select an active symbol from the suggested lists in the drop-down. To view all symbols available for trading, select All symbols, then click the market to expand it and choose your symbol.
You can also filter symbols by typing the name in the Search bar above, or click Watchlists to select from one of your watchlists.
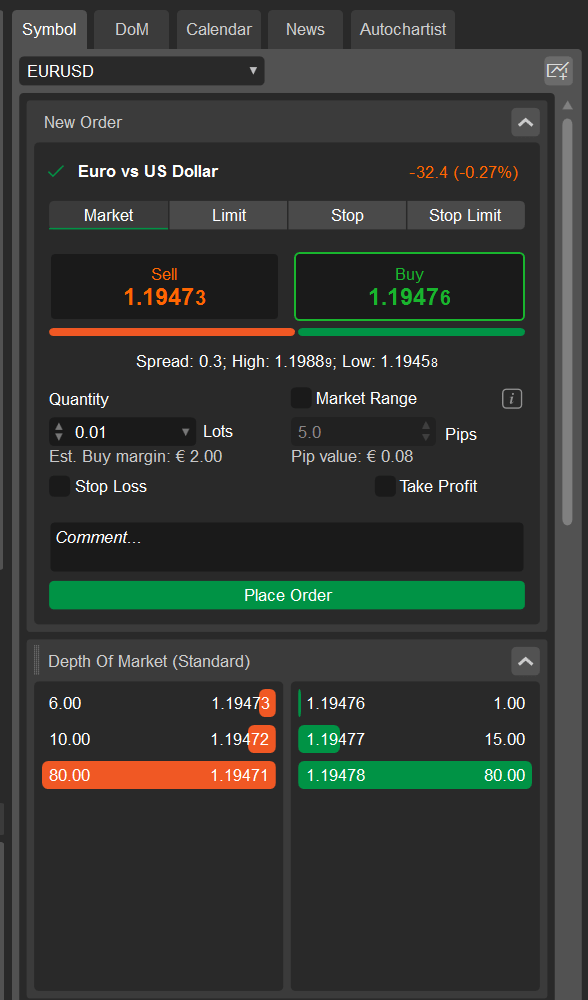
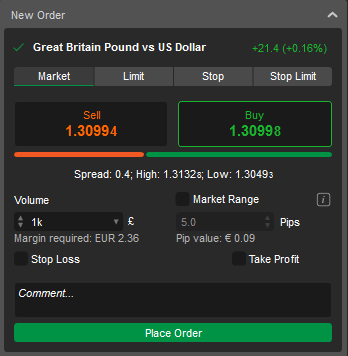
New order section
The New order tab is located right under the symbol title and allows placing orders of all four types: market, limit, stop and stop-limit orders.
To place an order, select the order type and direction, specify the volume, set stop-loss and take-profit levels if prompted, and click Place order.
Symbol information
The Active Symbol Panel contains comprehensive symbol information right below the New order tab. Click the drop-down Toggle next to a section to expand it, and drag the tabs to arrange them in the desired order.

The following information on the selected symbol is displayed here:
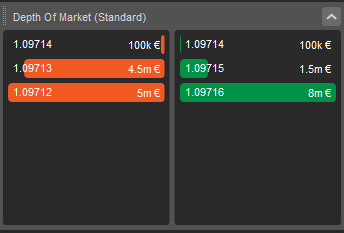
Depth of Market (standard)
The total amount of the open buy and sell orders for a symbol at different prices. Find more details here.
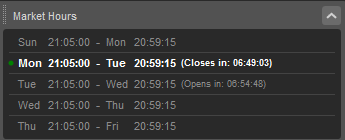
Market hours
The market schedule shows the open times for the symbol, with the current date marked by a green dot. The time remaining until the market closes or opens is displayed in real time next to the relevant date.
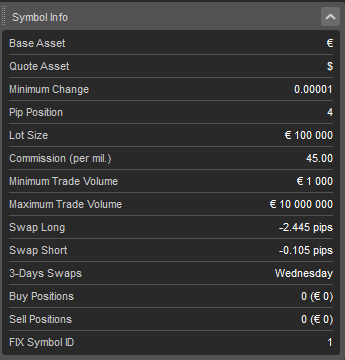
Symbol info
Detailed symbol information includes the Base and Quote asset, Minimum change, Pip position, Lot size, Commission, Minimum and Maximum trade volume, Swap long and short, 3-days swaps, Buy and Sell positions, and FIX symbol ID.
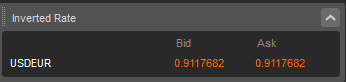
Inverted rate (for the forex symbols only)
Bid and ask exchange rates for the symbol.
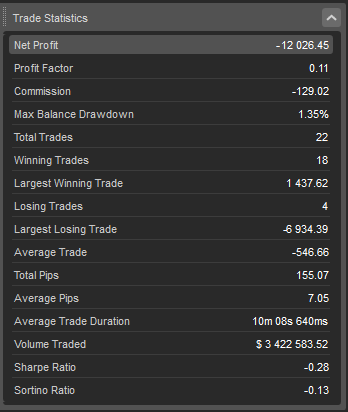
Trade statistics
Full statistics for trading the symbol in the current trading account include Net profit, Profit factor, Commission, Max balance drawdown, Total trades, Largest winning and losing trades, Winning and Losing trades, Average trade, Total and Average pips, Average trade duration, Volume traded, and Sharpe and Sortino ratio.
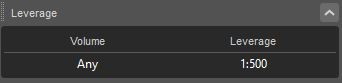
Leverage
The required leverage for trading the symbol.
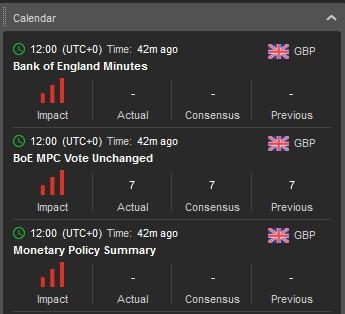
Calendar
The calendar automatically displays the most significant events of the main markets in chronological order, divided by day. Click See more to view the full calendar.
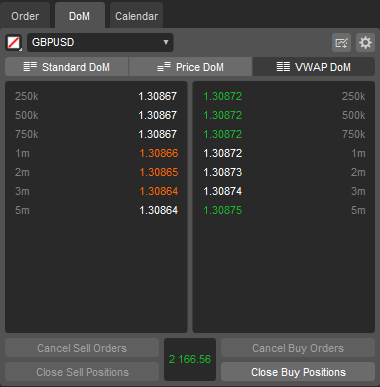
Depth of Market (DoM)
The DoM tab allows tracking the depth of market for a selected symbol in real time and placing orders using specific DoM settings. See the DoM section for detailed information on how to use it.
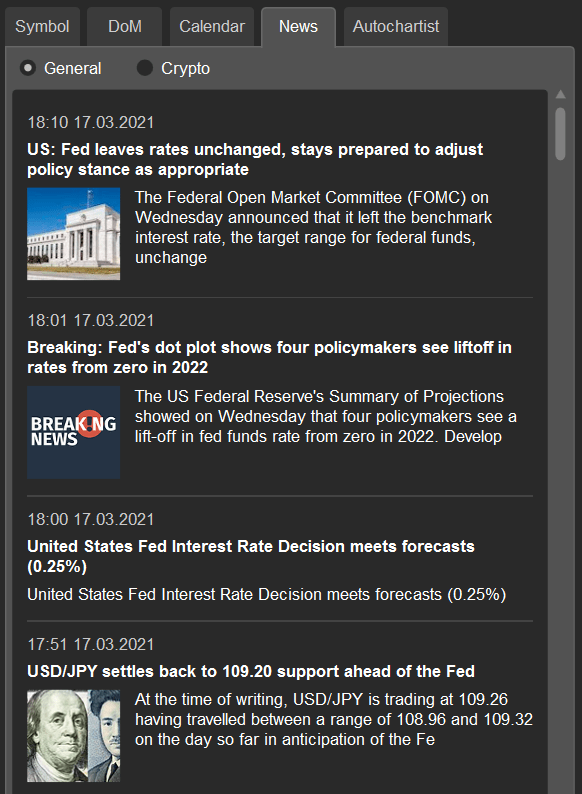
News
The News tab displays a news feed directly from FxStreet, allowing you to read relevant news without leaving the platform.
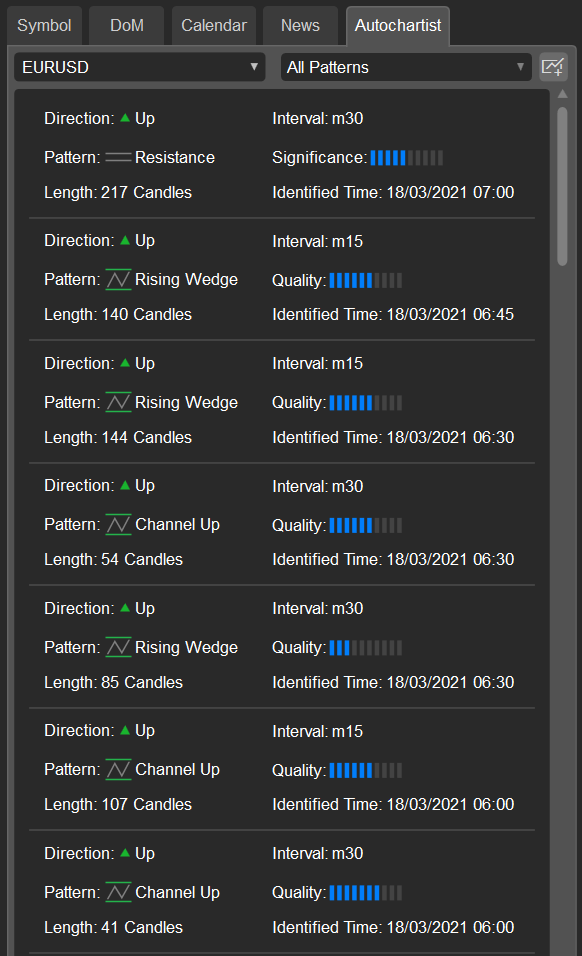
Autochartist
The Autochartist market analysis tool displays potential trading opportunities based on pattern recognition for the selected symbol.
Note
The analysis is provided by Autochartist and is available only for brokers that have subscribed to the service.