Market Replay
Market Replay is a feature that allows you to test your manual trading skills on historical market data. Think of it as a chance to relive certain market conditions and test various approaches to trading without risking any real funds.
Market Replay in one minute!
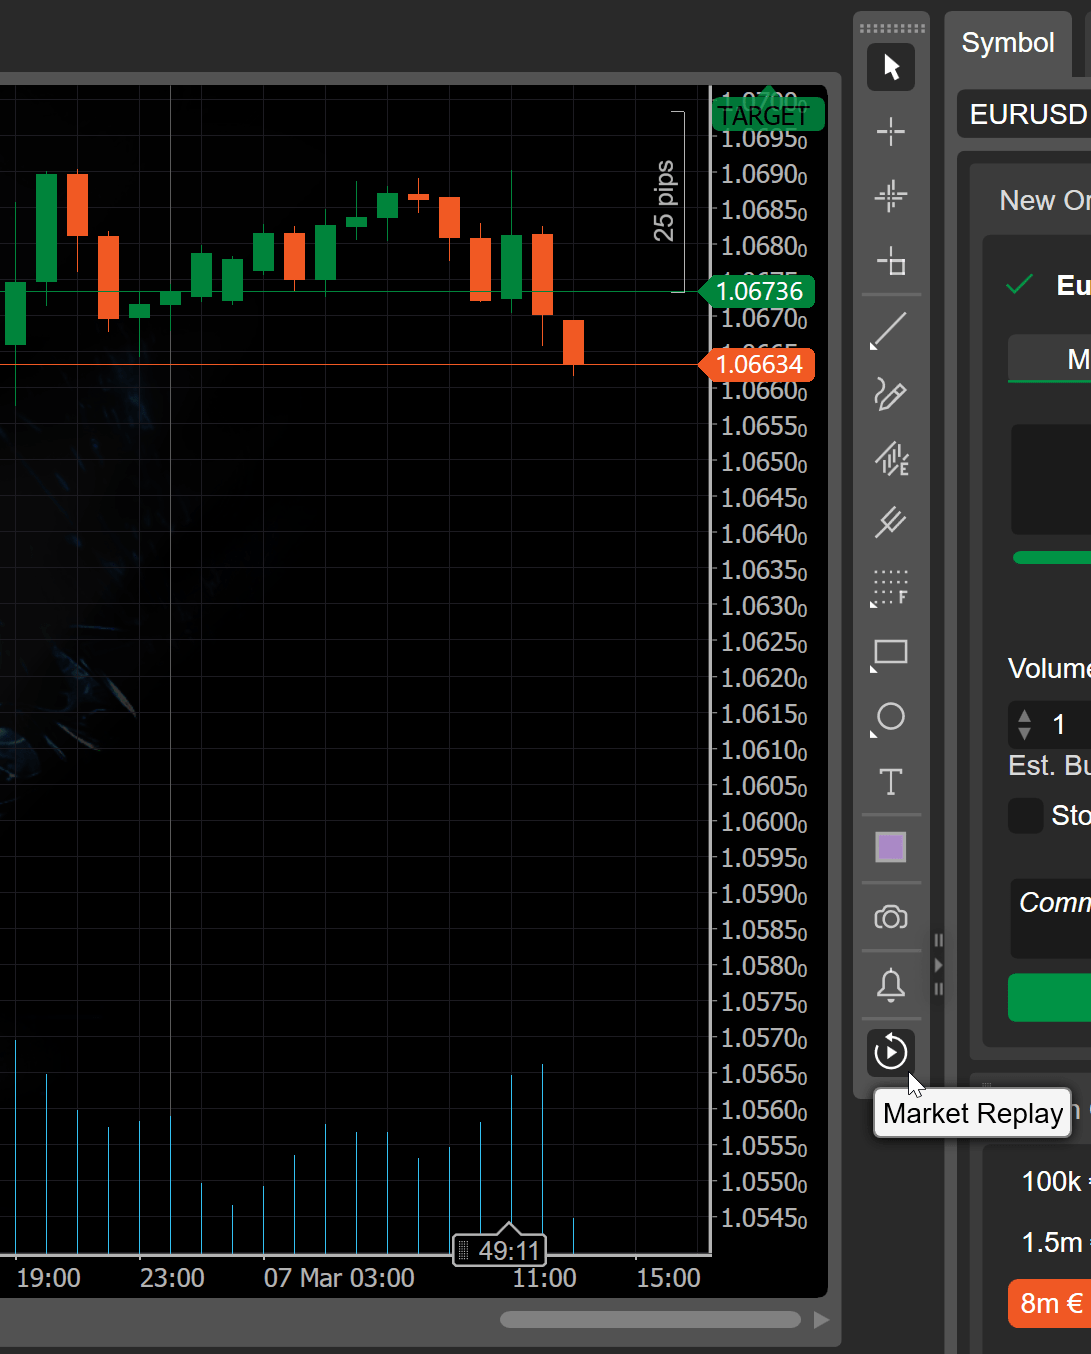
- To use Market Replay, click the Market Replay icon in the toolbar to the right of the traded chart.
- On the chart itself, choose a start date, adjust other settings and click Play. When the historical trading chart loads, freely place orders and analyse your reactions to certain market movements!
- Dynamically adjust the playback speed to fast forward to specific events and evaluate the long-term performance of your open positions.
- Analyse your trading strategies by using the equity chart and detailed trade statistics. Use this information on subsequent replays to grow your trading skills.
This extended guide explains where Market Replay can be accessed from, how it can be configured and why it constitutes a great tool for designing and improving trading strategies.
How to start Market Replay
In cTrader Windows, you can find the Market Replay icon at the bottom of the toolbar which is to the right of the traded chart.
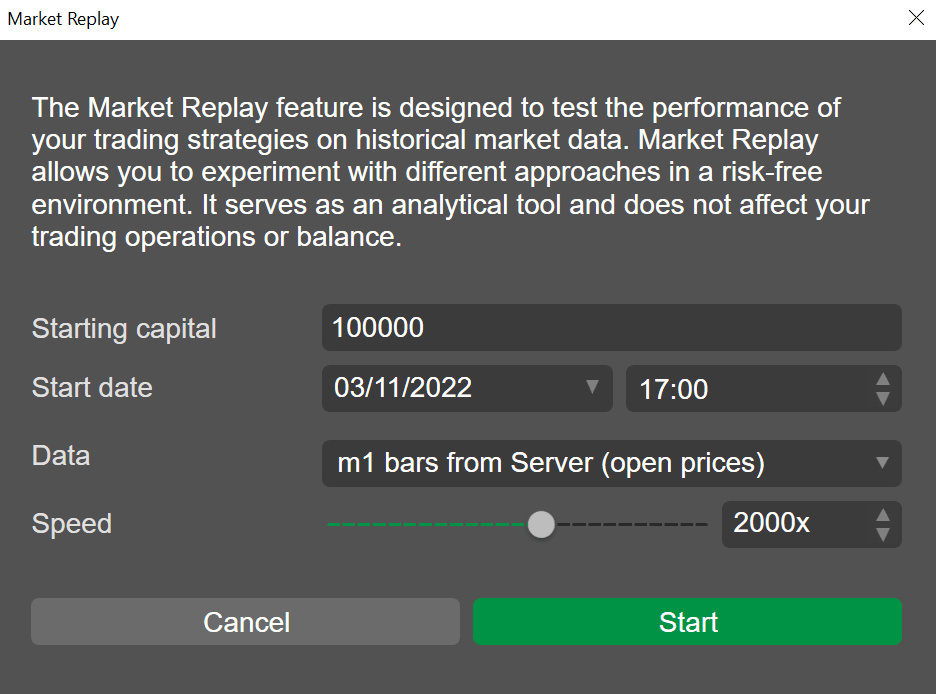
After clicking the Market Replay icon, move the pointer back along the chart period and choose a moment from which the playback will start. The settings window will offer to specify the following initial parameters of Market Replay.
-
Starting capital – enter your starting capital. Since you simulate trading on historical data, any amount may be added here.
-
Start date and time – you can adjust the start date and time if your initial choice was inaccurate.
-
Data – choose between m1 open prices and the most precise real historical tick data.
-
Speed – set the playback speed.
Click Start to open the Market Replay interface in a new window.
Note
cTrader will need time to load data, and the loading speed will depend on the selected data type.
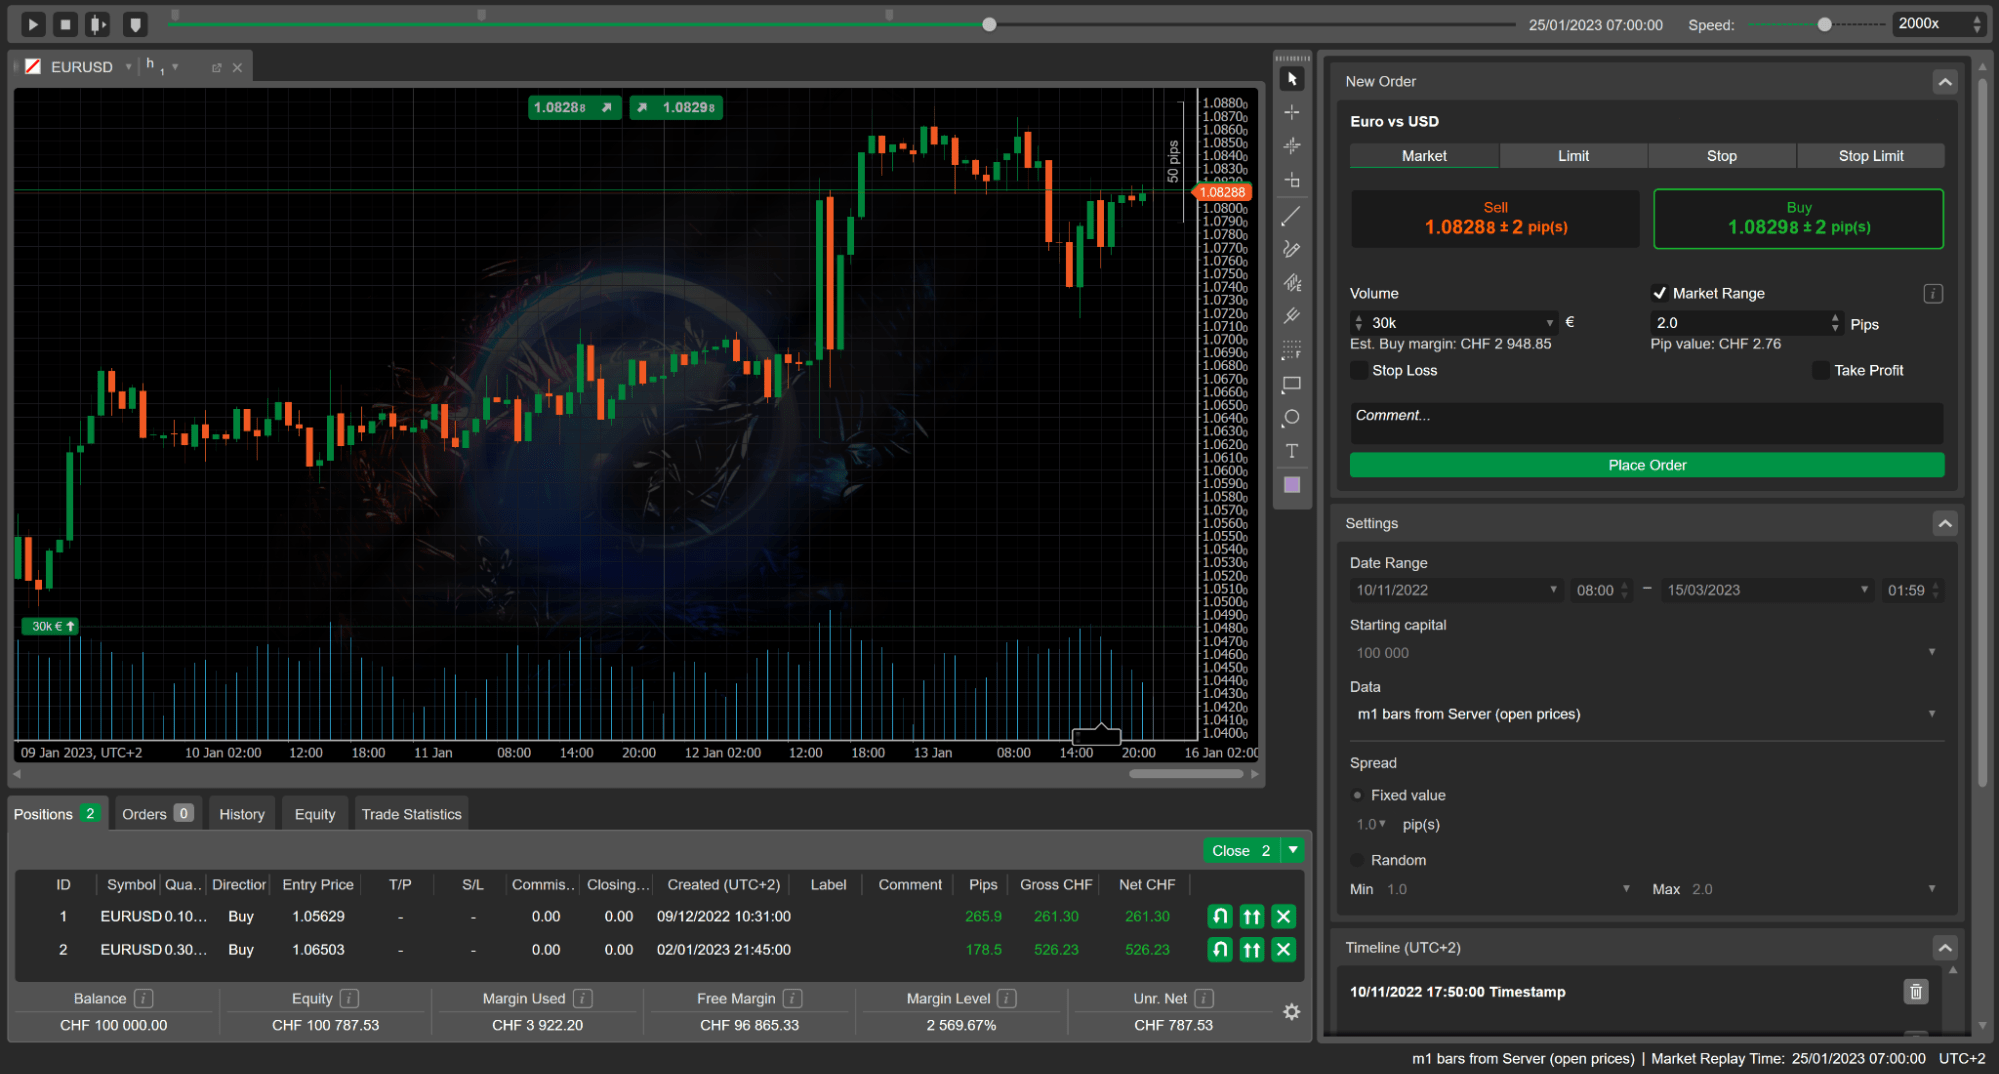
Market Replay UI consists of six key elements:
-
Market Replay controls including the Play/pause and Stop buttons, the Fast forward 1 bar button, the Add timestamp button, the Calendar progress bar and the Playback speed slider.
-
Trading chart for the currently selected symbol.
-
Trade Watch with five tabs, such as Positions, Orders, History, Equity, and Trade statistics.
-
New order tab.
-
Market Replay Settings tab.
-
Timeline tab.
How to adjust Market Replay settings
When Market Replay is running, you can return to the Settings tab and adjust your initial parameters. To do so, first, click the Stop button in the upper-left corner of the Market Replay window.

The Settings tab is now active and you can configure the parameters.
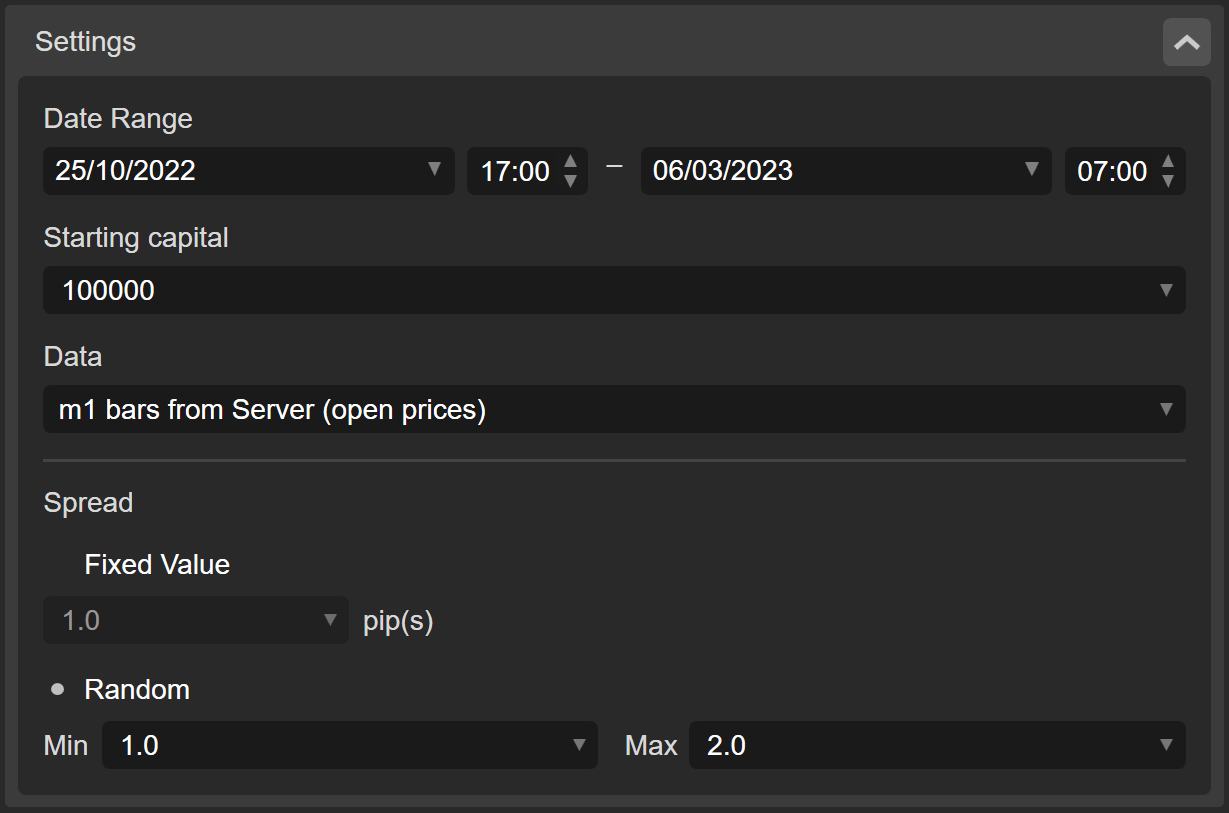
Date range – use the left and right date/time menus to specify the start and end times for which Market Replay should load historical data. For your convenience, a calendar grid will appear after you click the Arrow to the right of the date.
Starting capital – increase or decrease the initial starting capital. Try different amounts of starting capital to better understand your risk tolerance levels.
Data – two types of data are available for Market Replay:
-
m1 bars from server – Market Replay will source m1 data using open prices only. The data you will trade on may be slightly inaccurate compared to tick data. Nonetheless, selecting this option is fully justified when you wish to quickly load historical data over a large period.
-
Tick data from server – Market Replay will source tick data directly from the trading server. Selecting this data type means that you will trade on data that is highly accurate. Although, this option may also become resource-intensive.
Note
If the m1 bars from server data is selected, you need to specify the spread manually. For the Tick data from server data, the spread is determined based on historical data.
Spread – either type in or select a certain fixed spread value. Alternatively, click Random to configure a random spread value ranging between the specified minimum and maximum boundaries.
How to trade on historical data
Make sure Market Replay with your adjusted parameters is launched again. Use the controls in the top-left corner of the Market Replay window.
The trading chart now displays price data, and you can use the standard functionality of cTrader for trading operations and technical analysis. For example, you can draw Fibonacci fans, place horizontal lines or take market snapshots using the toolbar located to the right of the chart. The trend lines below highlight certain market movements.
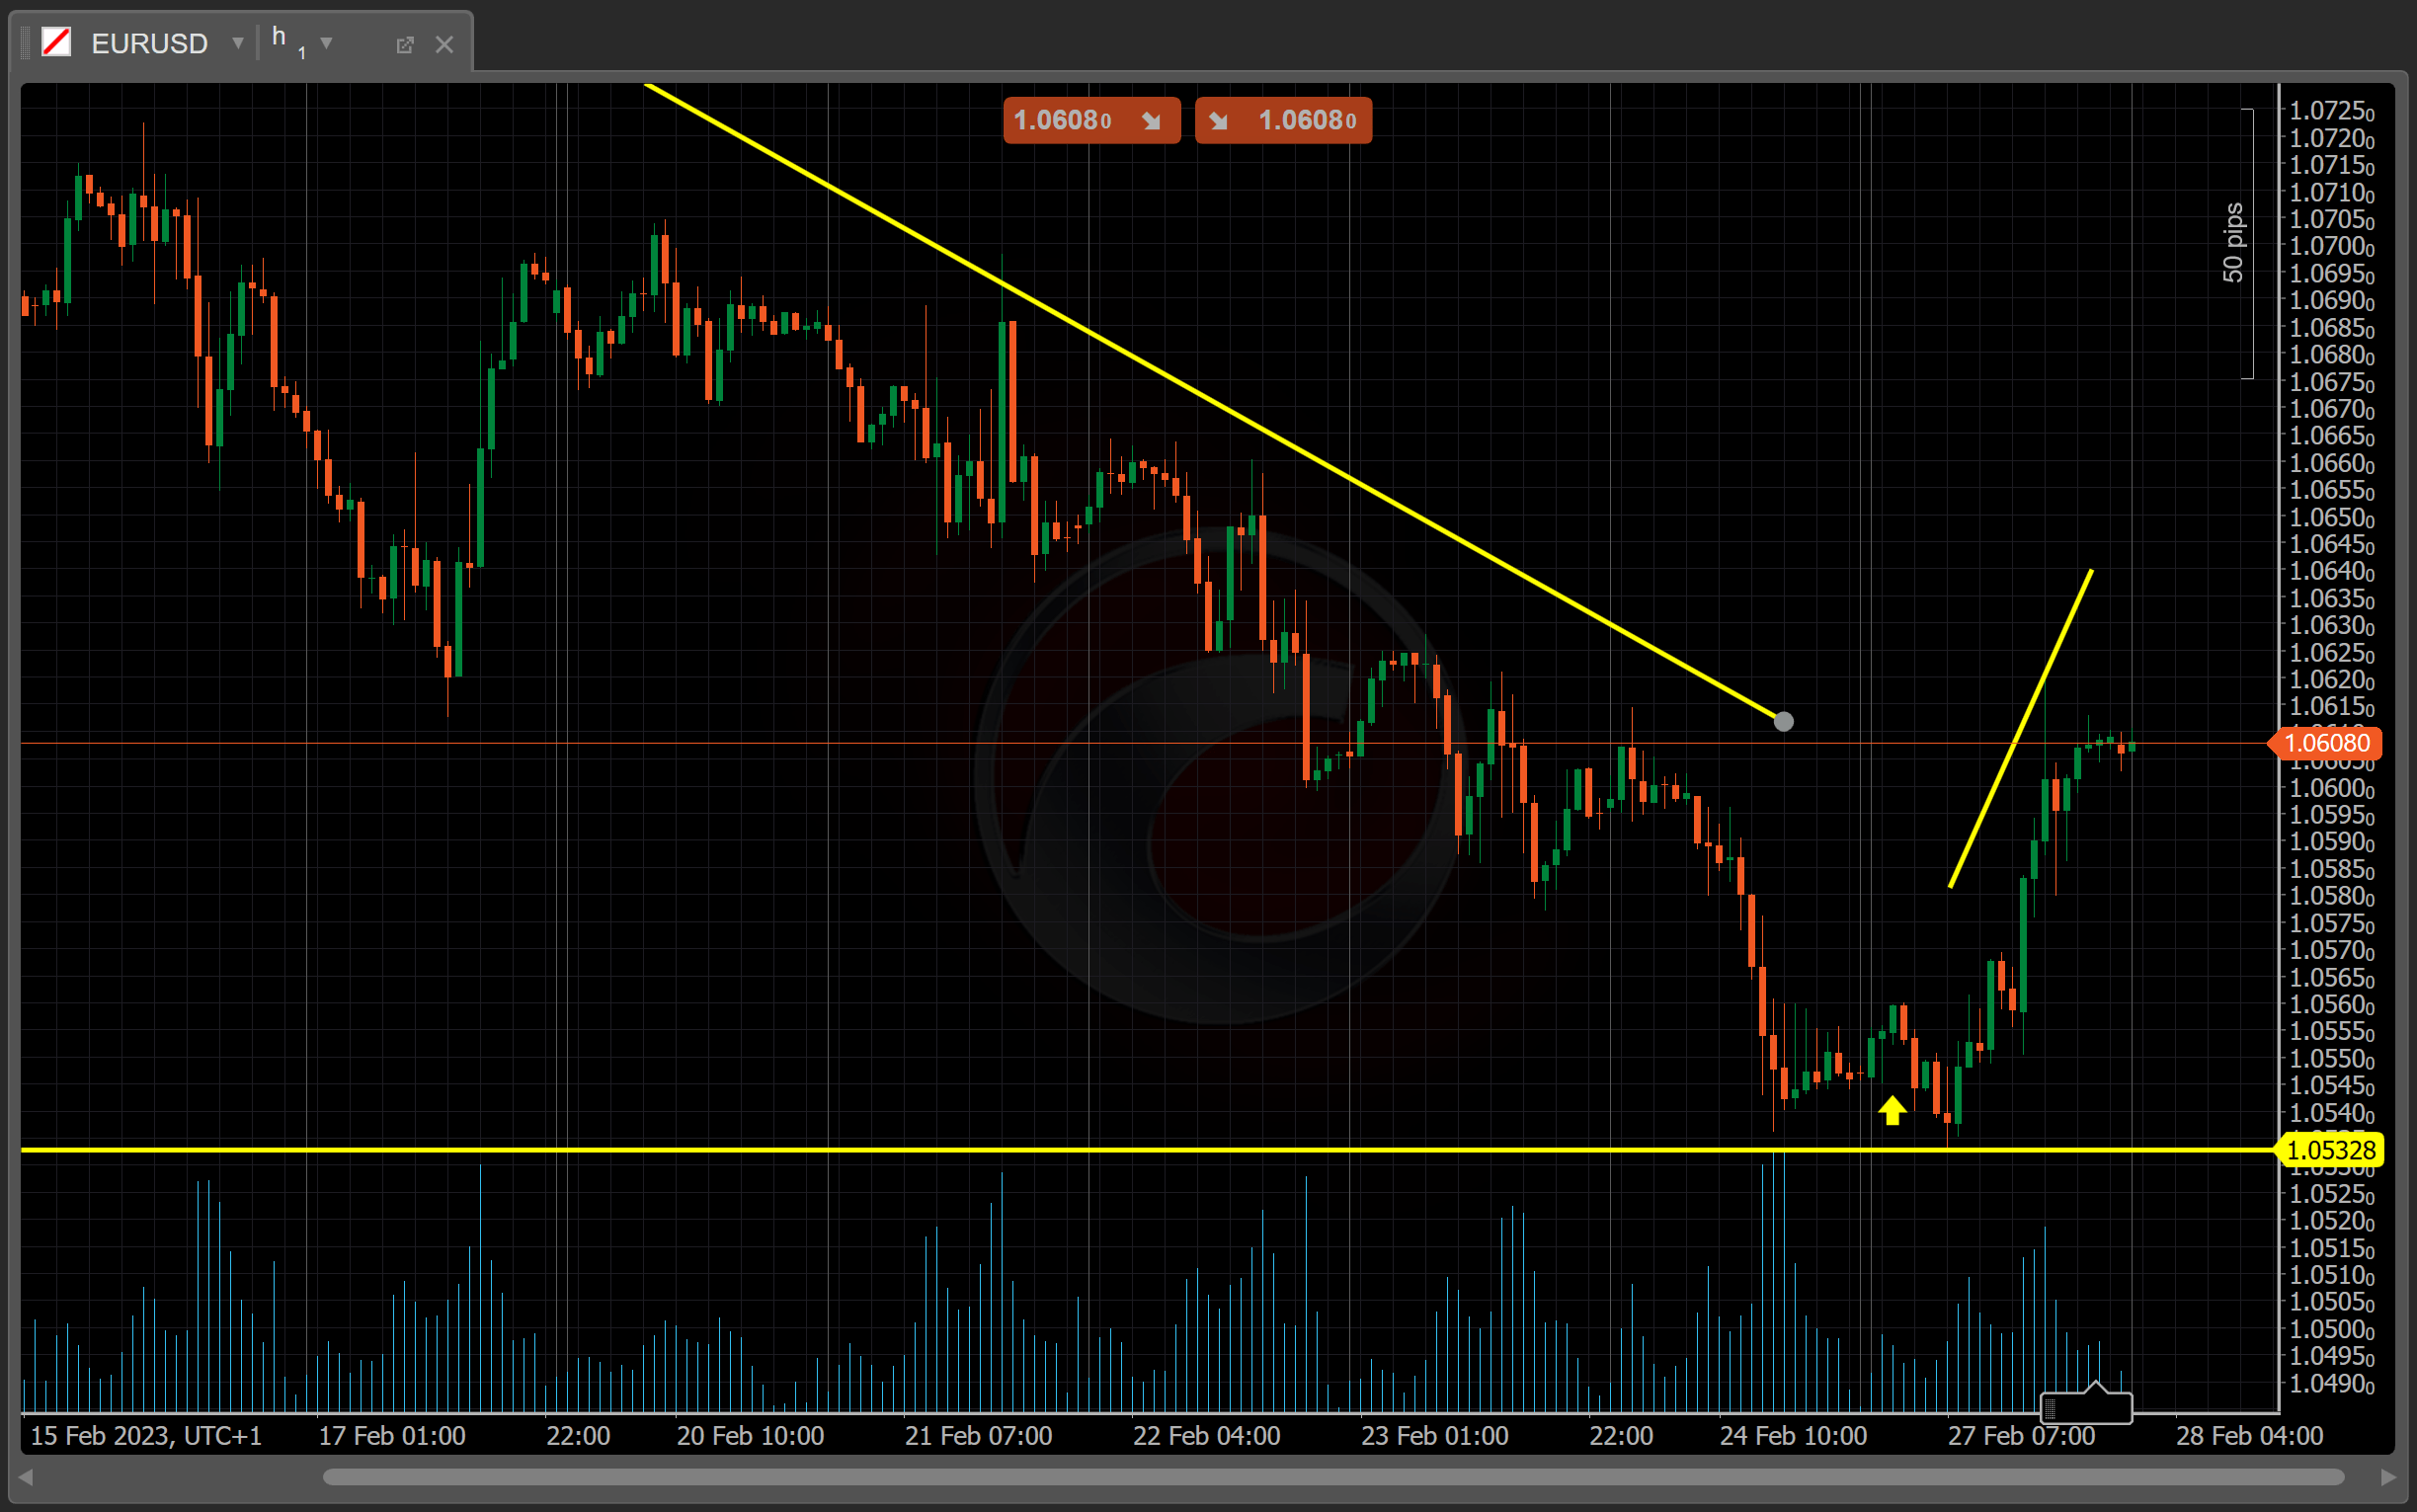
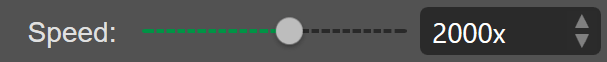
You can also adjust the playback speed dynamically by moving the Speed slider or using up and down arrows. This functionality allows you to fast forward to certain events or slow down the action to make an informed trading decision.
As with the standard UI of cTrader, you can place an order in three different ways:
-
Use the New order tab located to the right of the trading chart.
-
Use Quick Trade buttons available at the top of the trading chart.
-
Right-click within the chart area and place an order via the context menu.
Close your open positions individually or all at once from the Trade Watch tab below the trading chart.
The calendar slider at the top of the screen moves from left to right at the chosen playback speed. You cannot rewind Market Replay using the calendar slider, but you can jump ahead to any moment by dragging the slider to the right. In addition to the Play/pause and Stop buttons, use the Forward 1 bar button to display a single bar per click according to the chosen period.

How to add timestamps
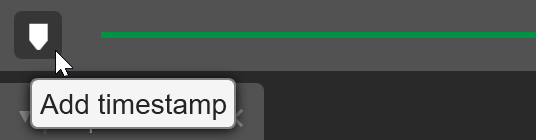
Timestamps act as bookmarks that you can place at specific points on the timeline to quickly fast forward to these events.
To add timestamps while using Market Replay, click the Add timestamp icon to the left of the calendar slider. You can also drag the slider right (not left) to any moment and click Add timestamp.
A new timestamp will appear just above the calendar slider. To place timestamps up or down the date range, right click on the calendar slider at an approximate place you would like to bookmark.
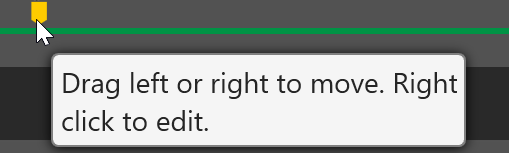
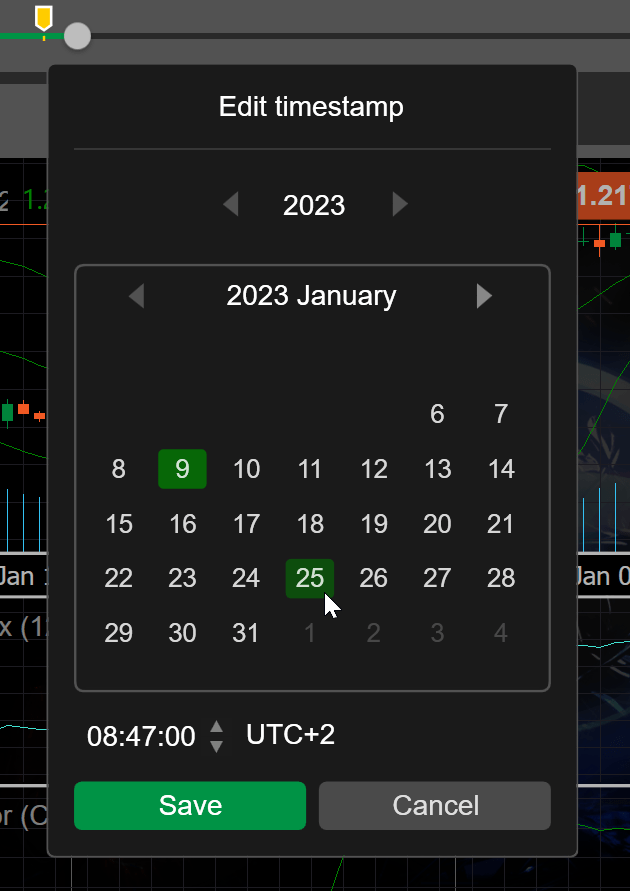
To edit the timestamp position, drag and drop a timestamp along the calendar slider. Alternatively, right-click on it to open the Edit timestamp menu. Here, you can edit the date and the exact time.
How to analyse replay performance
In addition to the Positions, Orders and History tabs, Trade Watch display in the Market Replay window also shows the Equity and Trade statistics tabs. The Equity tab offers a dynamic equity chart that acts as a great visual aid for evaluating trader performance.
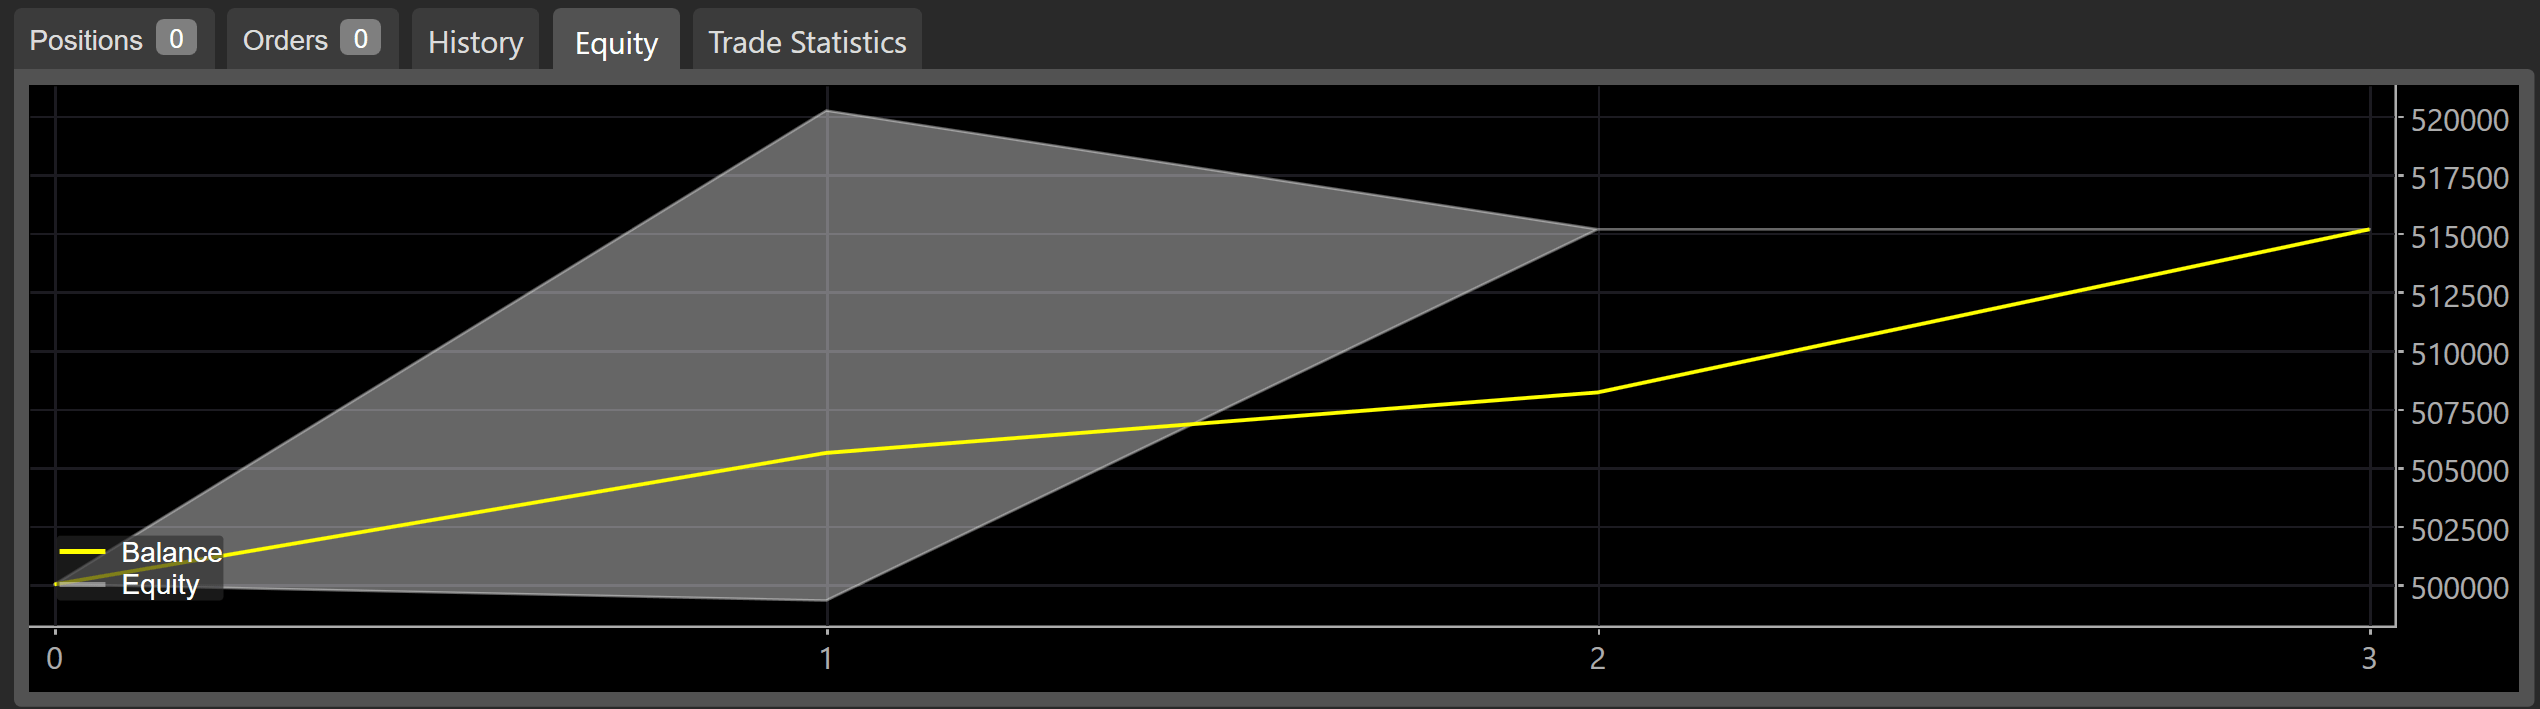
On the equity chart, the X axis illustrates the total number of trades you have made. The Y axis tracks funds.
Note
Market Replay does not affect any funds in your actual trading account (live or demo).
In turn, the Trade statistics tab provides the following summary.
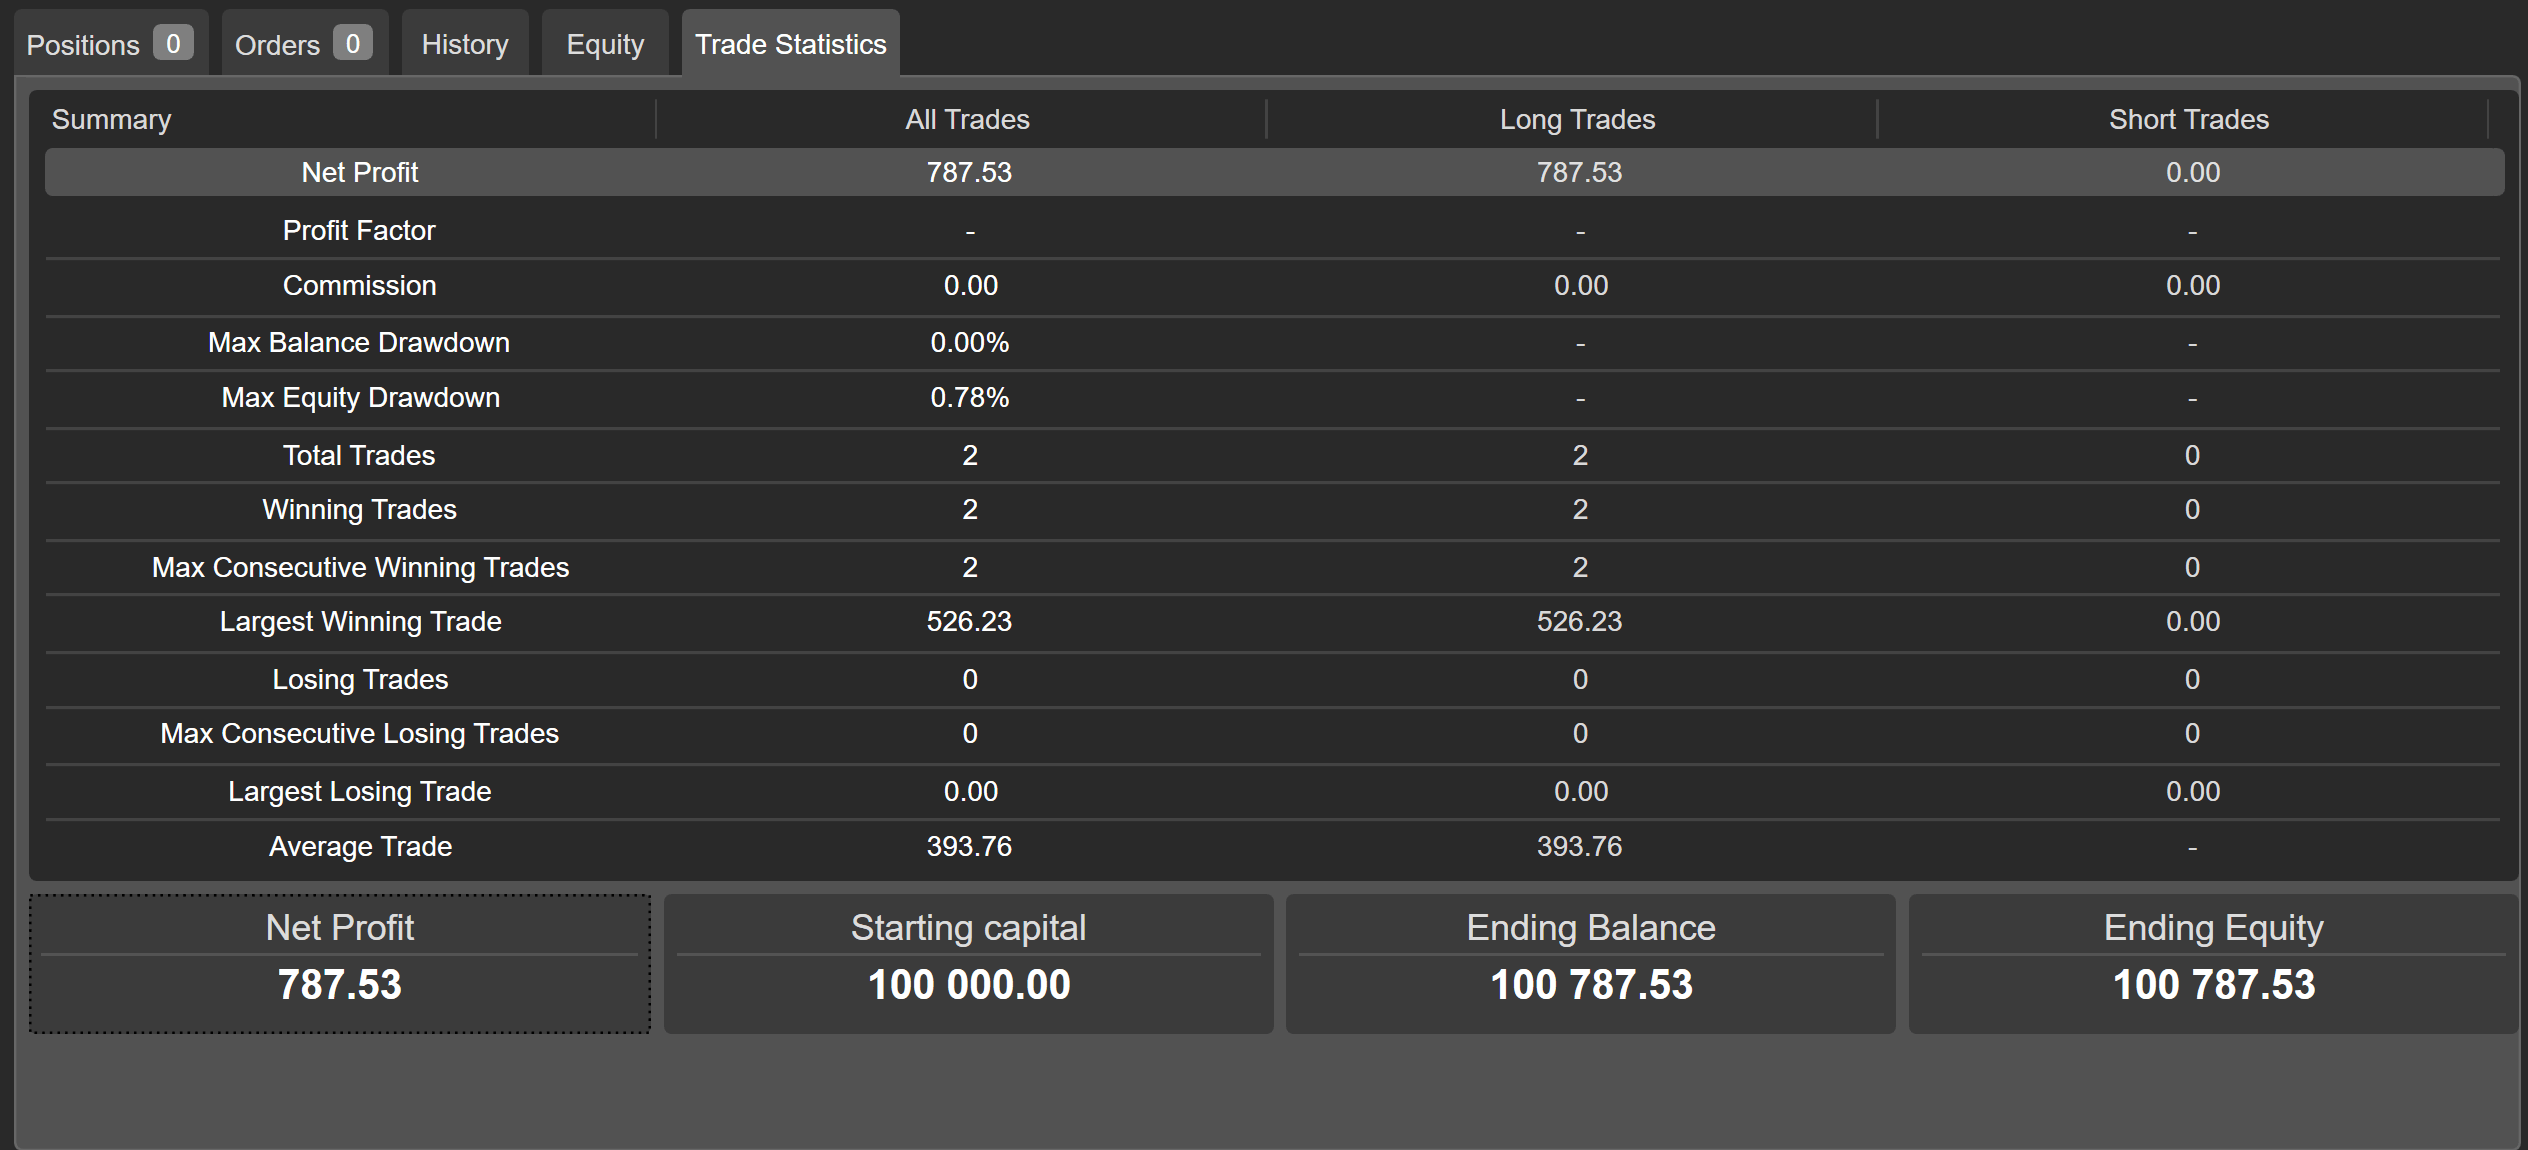
The chart highlights important statistics, such as the total number of winning trades you have made.
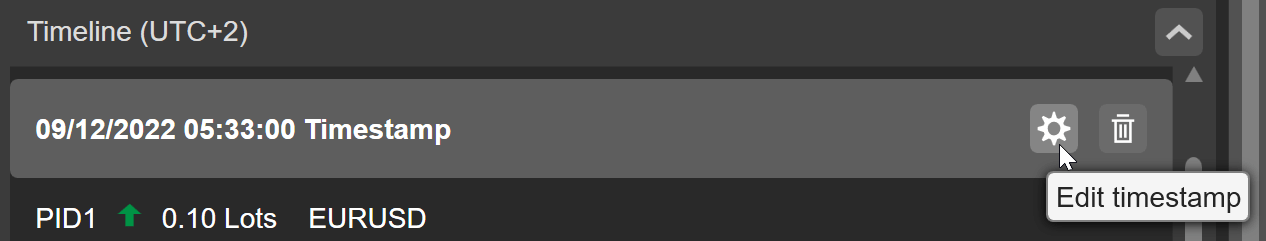
To associate your performance with certain events that have occurred throughout Market Replay, turn to the Timeline tab. It contains a dynamically updated record of all timestamps you have added and all orders you have placed during the currently active Market Replay.
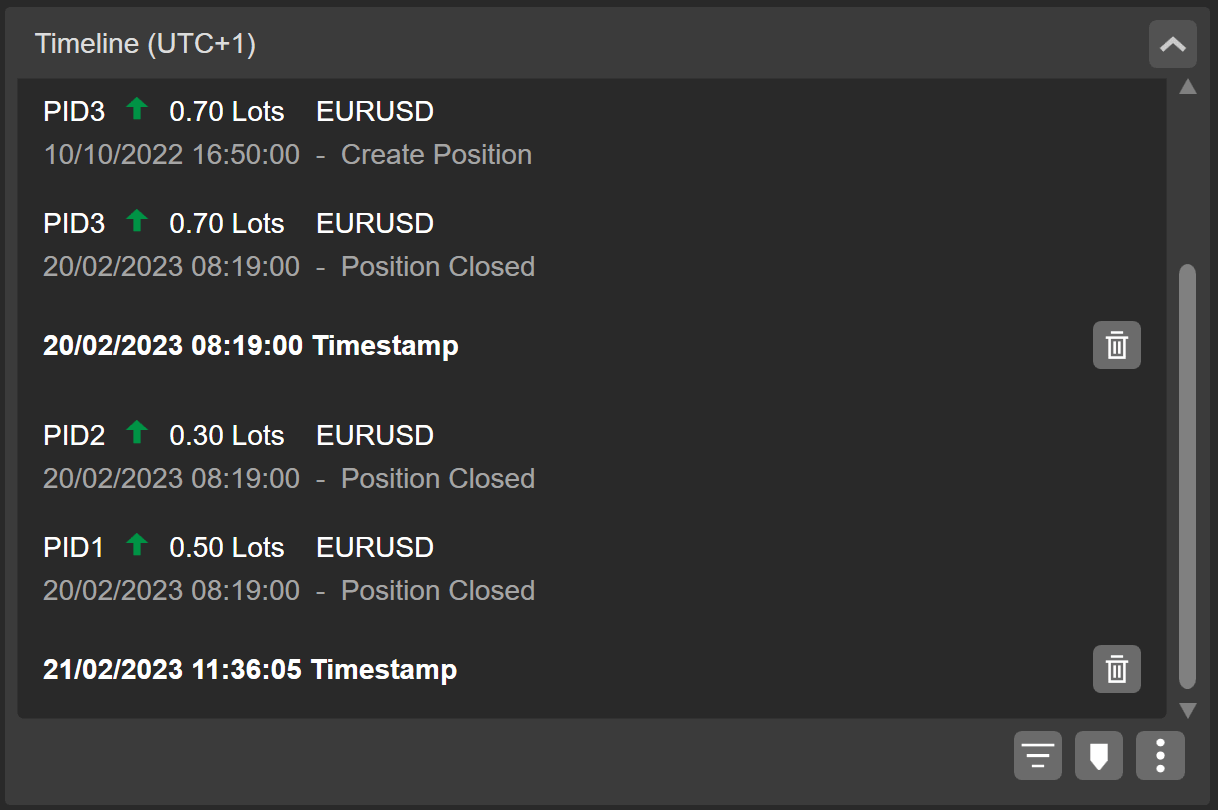
Additionally, you can edit timestamps directly from the Timeline tab. When hovering over a timestamp, a Cog icon will appear to the left of the Bin icon. You can set a new date and time after clicking it.
At the bottom of the Timeline tab, there are several controls that allow for customising the display filters, adding a timestamp right from this tab and exporting/importing timestamps.

This functionality is particularly useful when you want to retry certain Market Replays and would like to save time on timestamp management. Download and upload .rptm files for this purpose.
Key benefits of Market Replay
Market Replay is an invaluable tool for evaluating and refining your manual trading skills. Specifically, it provides the following benefits:
-
Safe environment – you can use the standard order functionality from cTrader to emulate trading without risking real funds in Market Replay.
-
Quick strategy testing – due to the playback speed feature, Market Replay allows for quickly testing your manual trading strategies in the short and long-term.
-
Easy navigation – traders do not waste time on repeated replays, as Market Replay allows for managing timestamps in just a few clicks.
-
Trackable statistics – Market Replay offers a detailed timeline and trading statistics, giving users accurate information for refining a trading strategy.
Summary
Market Replay is a customisable tool for testing and enhancing your fundamental trading skills. Even if you consider yourself an experienced trader, you can still refine your strategy trading on historical market data without the risk of losing real funds.