Candlestick chart
The candlestick chart is considered the most popular and one of the oldest chart types, developed in the 18th century.
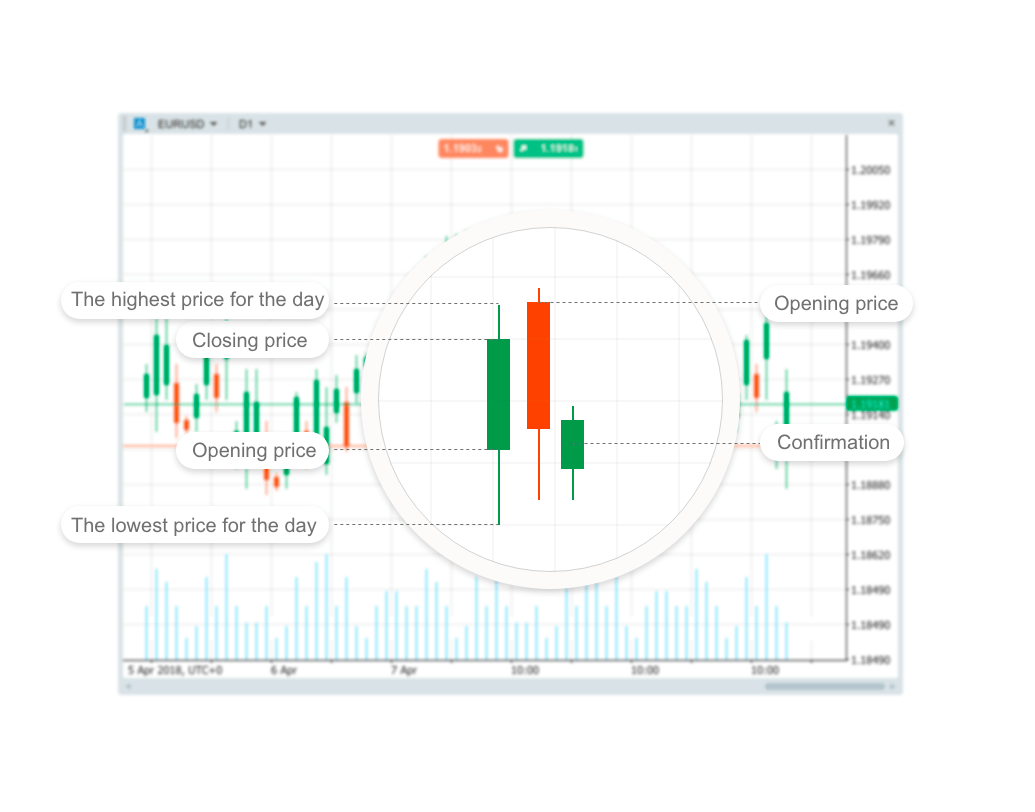
Like the bar chart, it represents all four prices of a security; open, high, low and close (OHLC), but with open and close represented by the thick body of the candle, while the high and low are represented by the wick.
Candlestick patterns are used to predict the future direction of price movement. It tends mostly to represent trading patterns over short periods, often a few days or a few trading sessions. By default, it is set to daily in the cTrader chart.
Candlestick is a type of price chart used in technical analysis that displays the high, low, open and close prices of a security for a specific period. It originated from Japanese rice merchants and traders to track market prices and daily momentum hundreds of years before becoming popularised in the United States.
The wide part of the candlestick is called the real body and tells investors whether the closing price was higher or lower than the opening price.
Principles of the candlestick chart
The candlestick's body (the area between the open and the close) displays the opening and closing prices and how they compare to high and low. The increasing (bullish) candles in cTrader are displayed in green, while the decreasing (bearish) are in red. A candlestick's shape varies based on the relationship between the day's high, low, open and close prices.
Candlesticks reflect the impact of investor sentiment on security prices and are used by technical analysts to determine when to enter and exit trades. As such, candlestick charts are a suitable technique for trading any liquid financial asset such as stocks, foreign exchange and futures.
Long green candlesticks indicate that there is strong buying pressure or that the price is bullish. Long red candlesticks indicate that there is significant selling pressure or the price is bearish.
A common bullish candlestick reversal pattern referred to as a hammer, forms when the price moves substantially lower after the open, then rallies to close near the high. The equivalent bearish candlestick is known as a hanging man. These candlesticks have a similar appearance to a square lollipop and are often used by traders attempting to pick a top or bottom in a market.
Candlestick trading patterns
There are many trading strategies based on the candlestick patterns, mostly short-term. The best way to learn to read candlestick patterns is to practise entering and exiting trades from the signals they give.
When using any candlestick pattern, it is important to remember that although they are great for quickly predicting trends, they should be used alongside other forms of technical analysis to confirm the overall trend.
Engulfing
The engulfing pattern suggests a potential trend reversal; the first candlestick has a small body that is completely engulfed by the second candlestick. The engulfing pattern is bullish when it appears at the end of a downtrend.
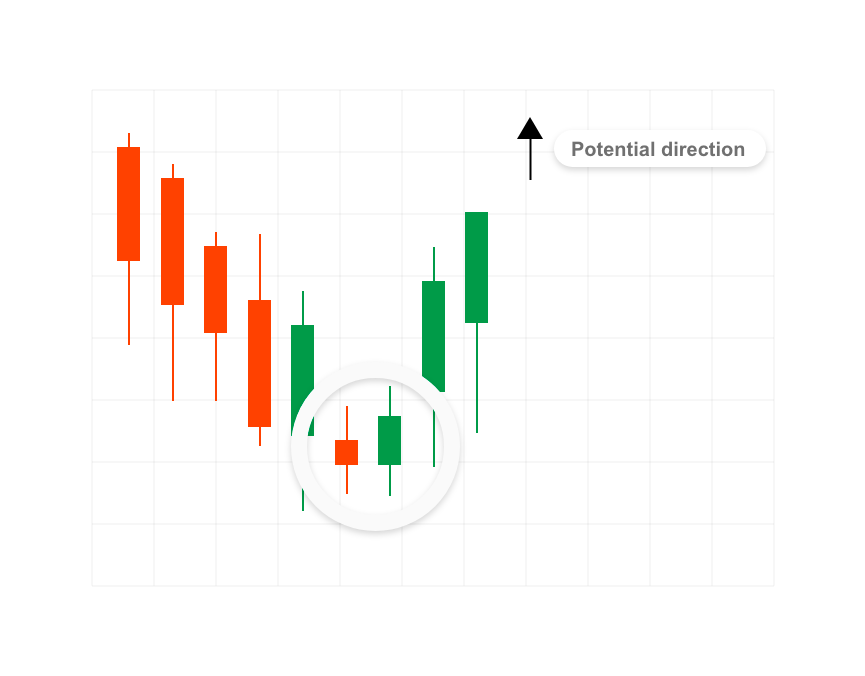
At the conclusion of an uptrend, the engulfing pattern is bearish.
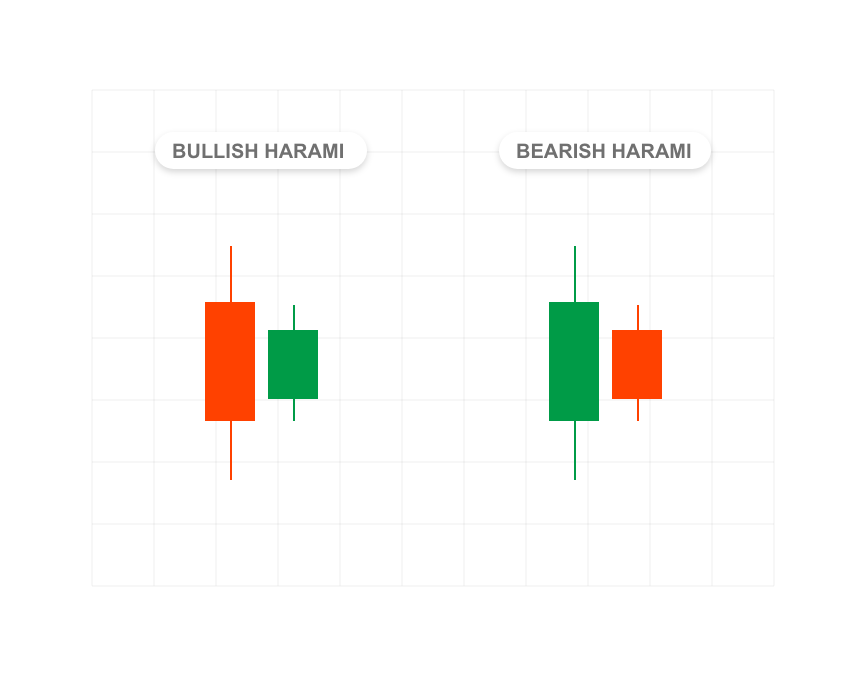
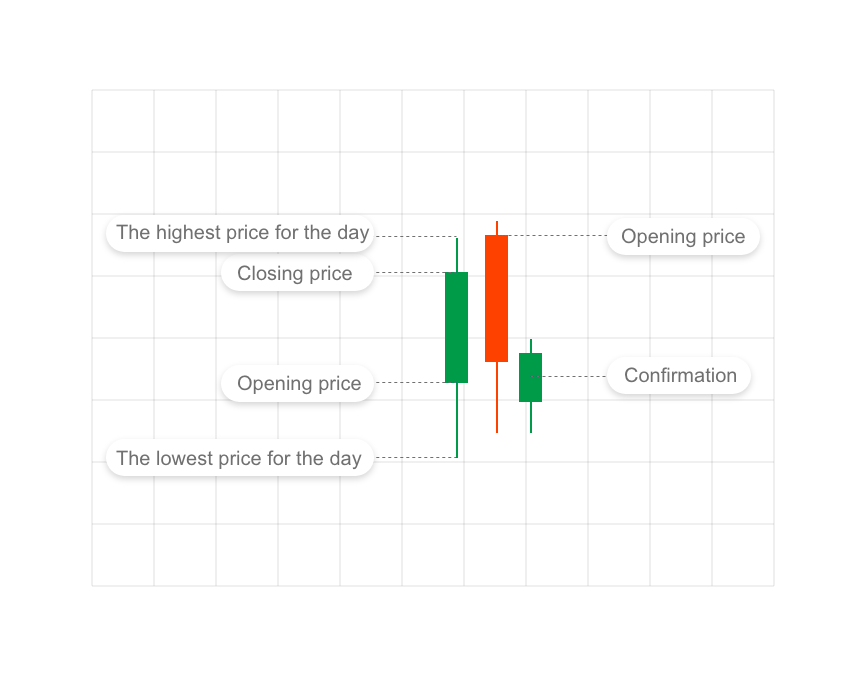
Harami
Harami is a reversal pattern where the second candlestick is entirely contained within the first candlestick and is opposite in colour. Harami cross, a related pattern, has a second candlestick that is a doji (when the open and close are effectively equal).
Doji
When a market's open and close are almost at the same price point, the candlestick resembles a cross or plus sign. Traders should look out for a short to non-existent body, with wicks of varying length.
This doji pattern conveys a struggle between buyers and sellers that results in no net gain for either side. Alone, a doji is a neutral signal, but it can be found in reversal patterns such as bullish morning star and bearish evening star.
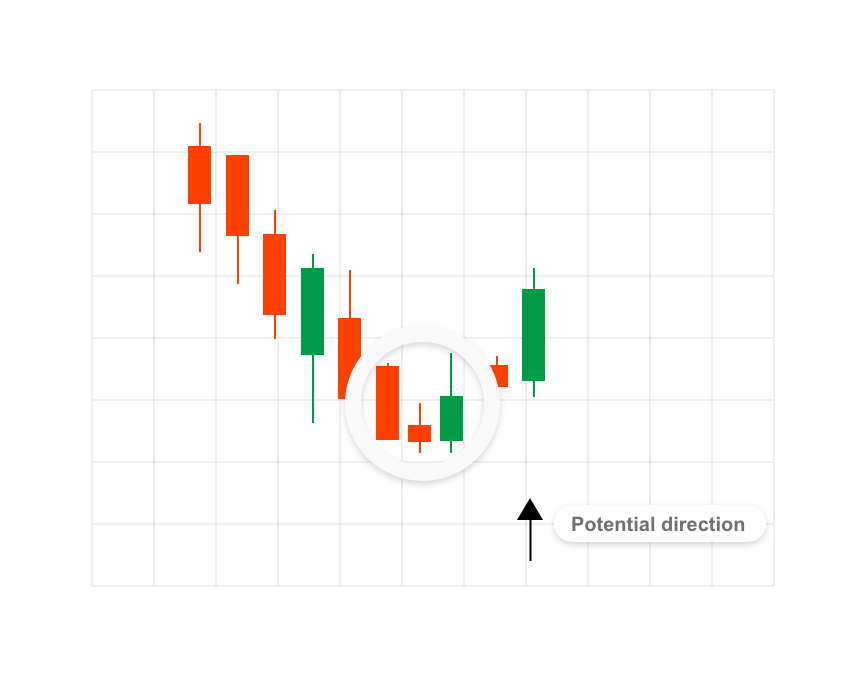
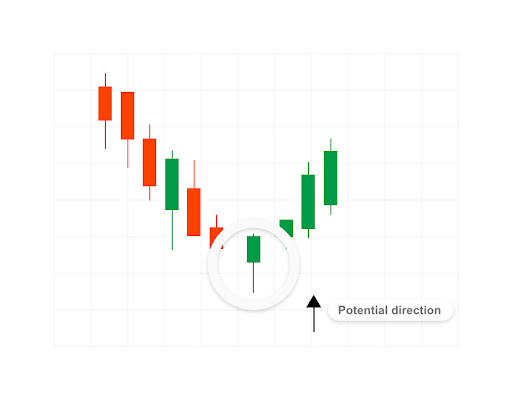
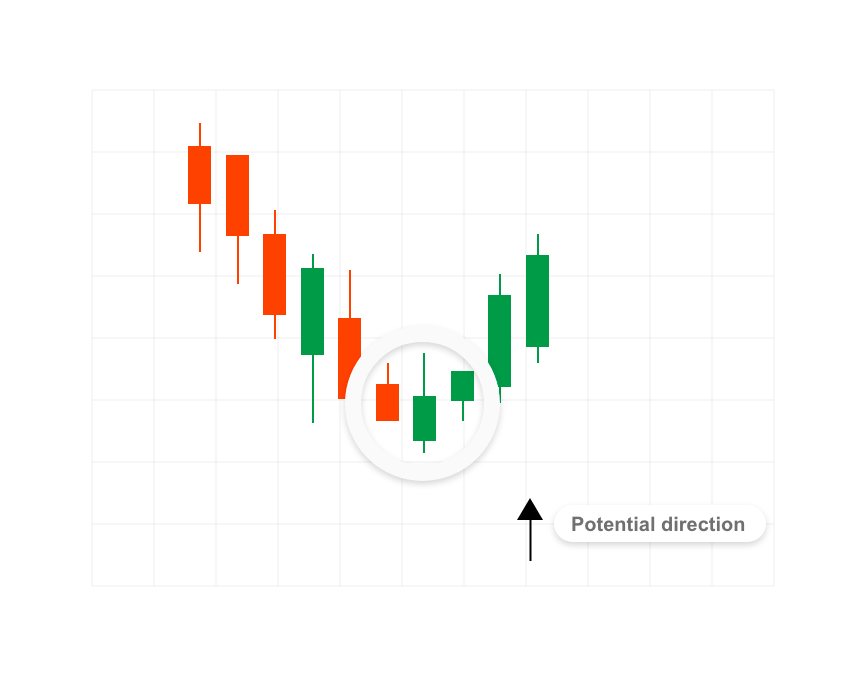
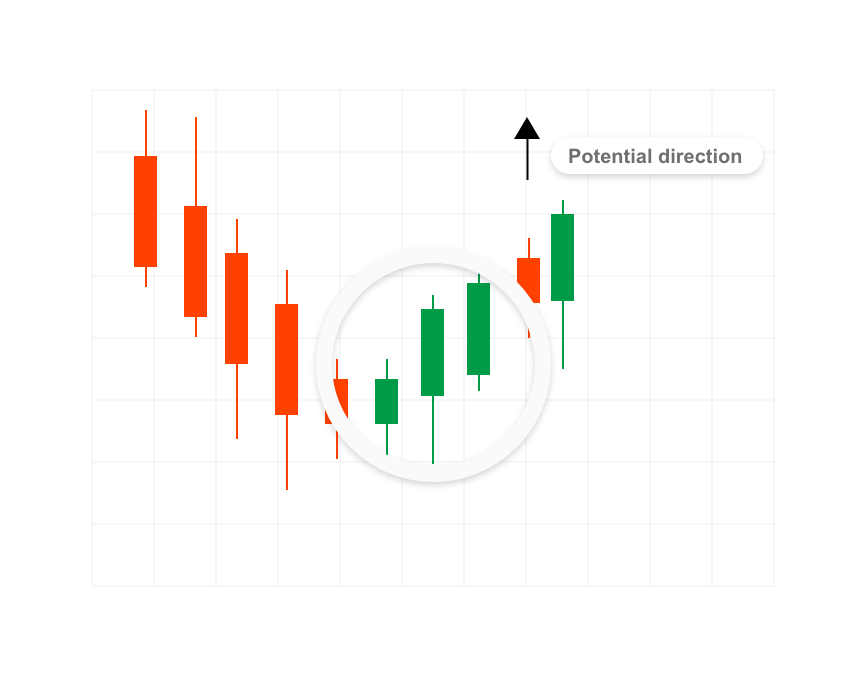
Morning star
Morning star is bullish as a reversal pattern where the first candlestick is long and red-bodied, followed by a short candlestick that has gapped lower; it is completed by a long-bodied green candlestick that closes above the midpoint of the first candlestick.
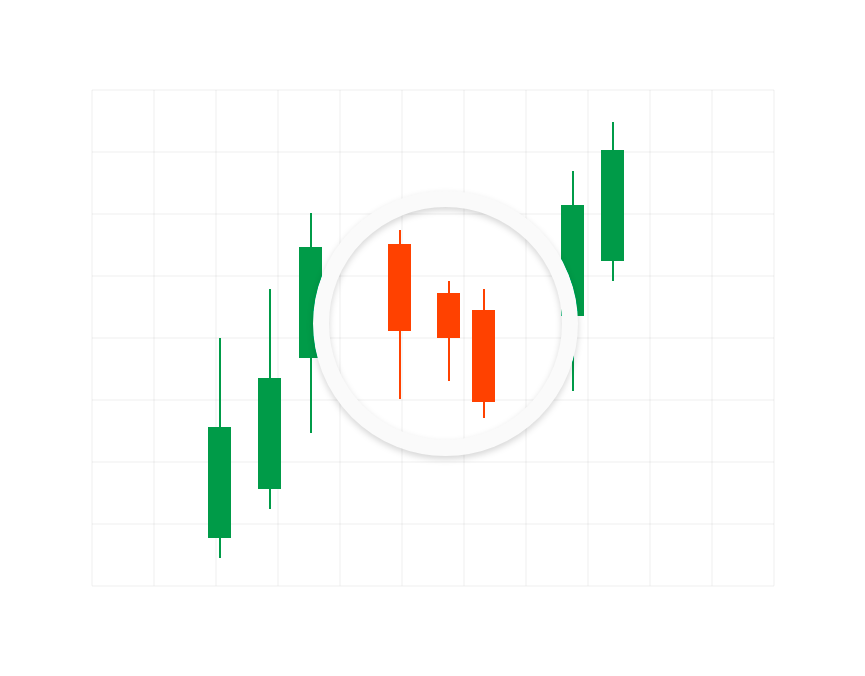
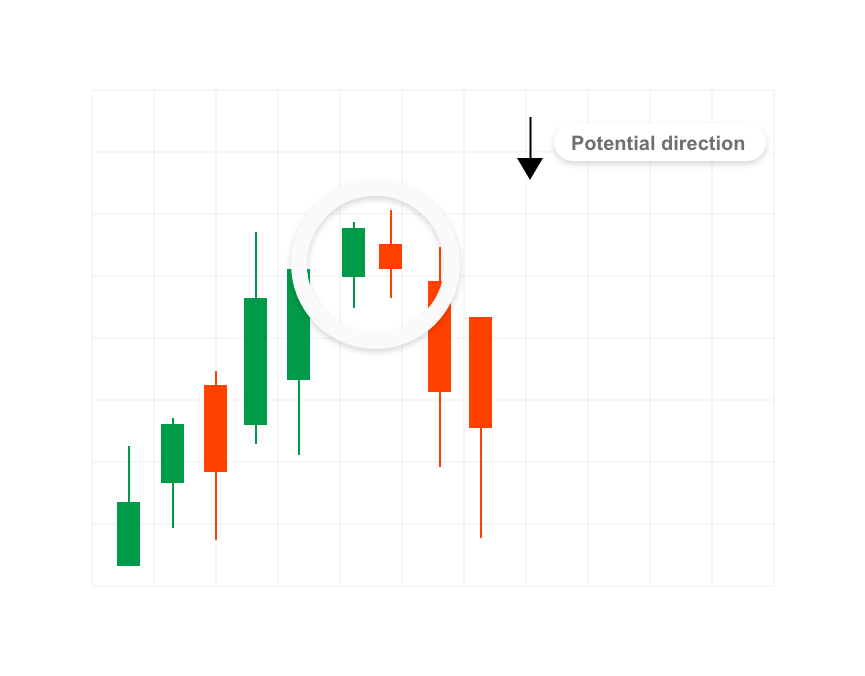
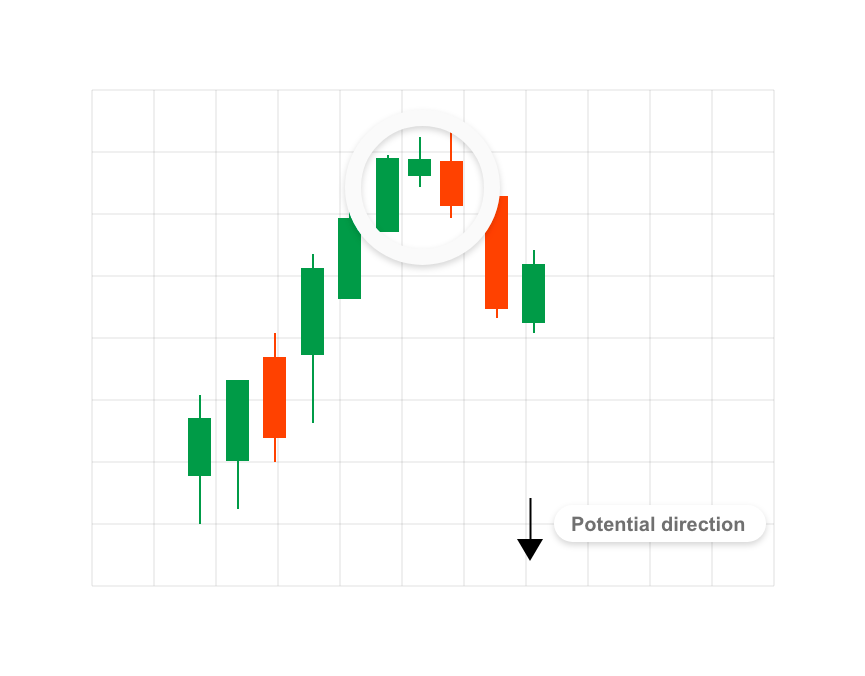
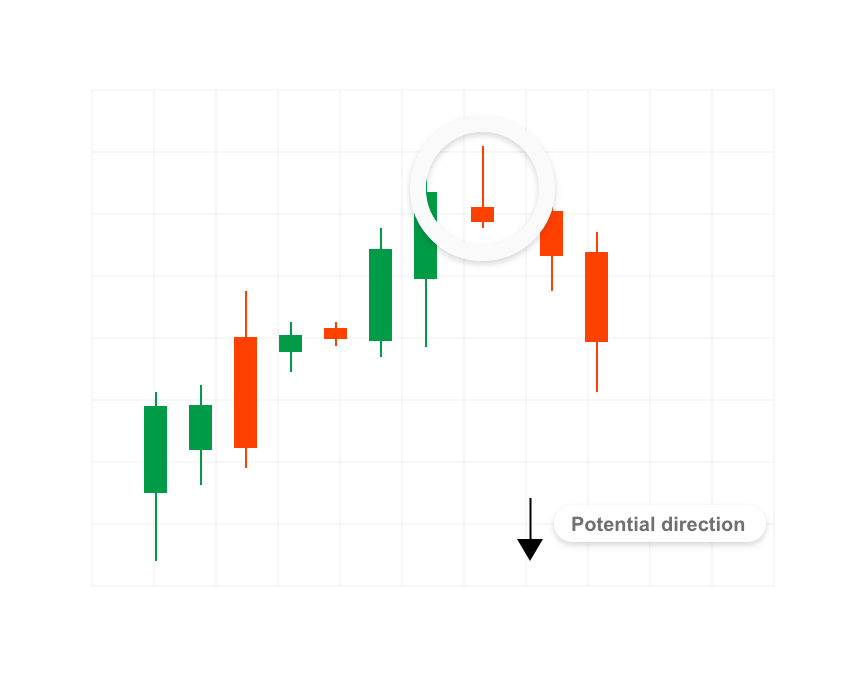
Evening star
Evening star is bearish as a reversal pattern where the first candlestick continues the uptrend. The second candlestick gaps up and has a narrow body. The third candlestick closes below the midpoint of the first candlestick.
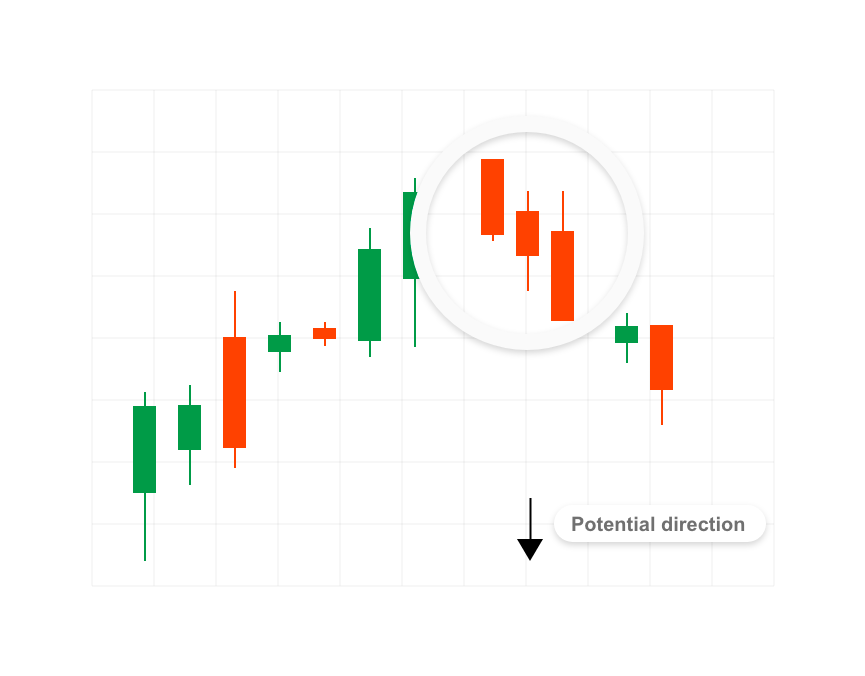
Three black crows
Three black crows candlestick pattern comprises three consecutive long red candles with short or non-existent wicks. Each session opens at a similar price to the previous day, but selling pressures push the price lower and lower with each close.
Traders interpret this pattern as the start of a bearish downtrend, as the sellers have overtaken the buyers during three successive trading days.
Dark cloud cover
Dark cloud cover candlestick pattern indicates bearish reversal - a black cloud over the previous day's optimism. It comprises two candlesticks: a red candlestick which opens above the previous green body, and closes below its midpoint. It signals that the bears have taken over the session, pushing the price sharply lower. If the wicks of the candles are short it suggests that the downtrend was extremely decisive.
Hammer
The hammer candlestick pattern is formed of a short body with a long lower wick, and is found at the bottom of a downward trend. A hammer shows that although there were selling pressures during the day, ultimately a strong buying pressure drove the price back up.
The colour of the body can vary, but green hammers indicate a stronger bull market than red hammers.
Inverted hammer
Inverted hammer is a similarly bullish pattern, with the only difference that the upper wick is long, while the lower wick is short.
It indicates a buying pressure, followed by a selling pressure that was not strong enough to drive the market price down. The inverted hammer pattern suggests that buyers will soon have control of the market.
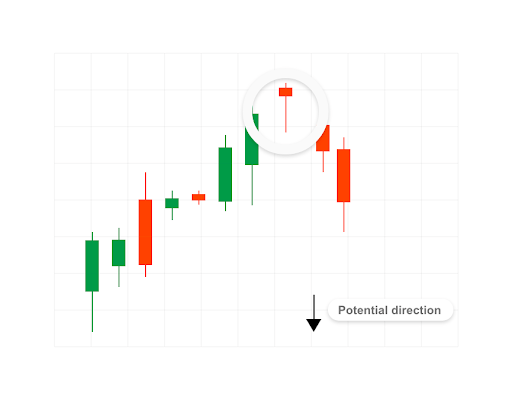
Shooting star
Shooting star is the same shape as inverted hammer, but is formed in an uptrend, it has a small lower body, and a long upper wick.
Usually, the market will gap slightly higher on opening and rally to an intra-day high before closing at a price just above the open - like a star falling to the ground.
Hanging man
The hanging man pattern is the bearish equivalent of a hammer; it has the same shape but forms at the end of an uptrend. It indicates that there was a significant sell-off during the day, but that buyers were able to push the price up again.
The large sell-off is often seen as an indication that the bulls are losing control of the market.
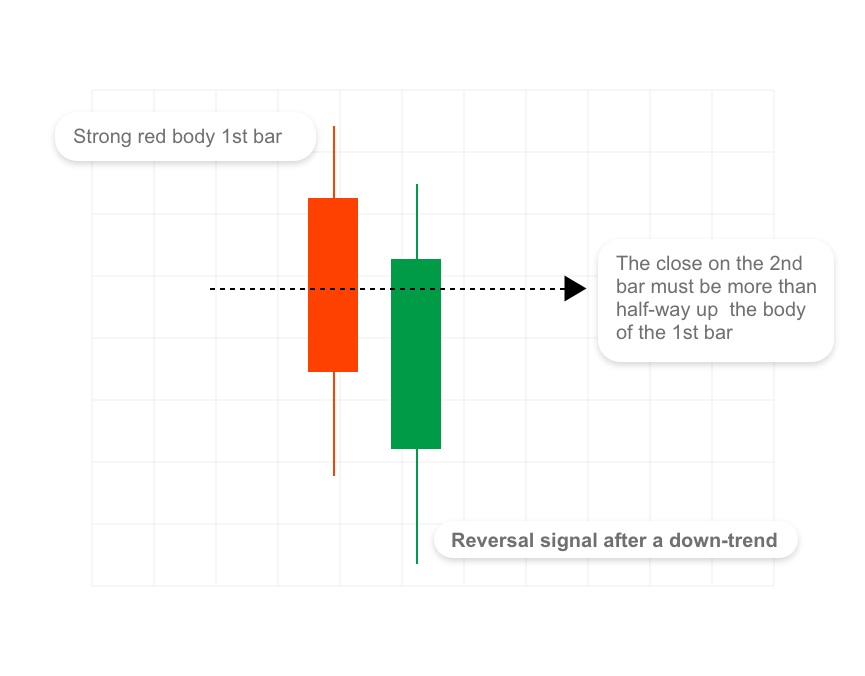
Piercing line
Piercing line is also a two-stick pattern, made up of a long red candle, followed by a long green candle. There is usually a significant gap down between the first candlestick's closing price, and the green candlestick's opening.
It indicates a strong buying pressure, as the price is pushed up to or above the mid-price of the previous day.
Three white soldiers
The three white soldiers pattern occurs over three days. It consists of consecutive long green candles with small wicks, which open and close progressively higher than the previous day.
It is a very strong bullish signal that occurs after a downtrend, and shows a steady advance of buying pressure.
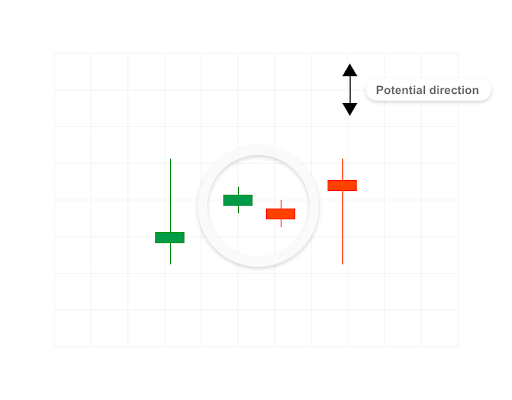
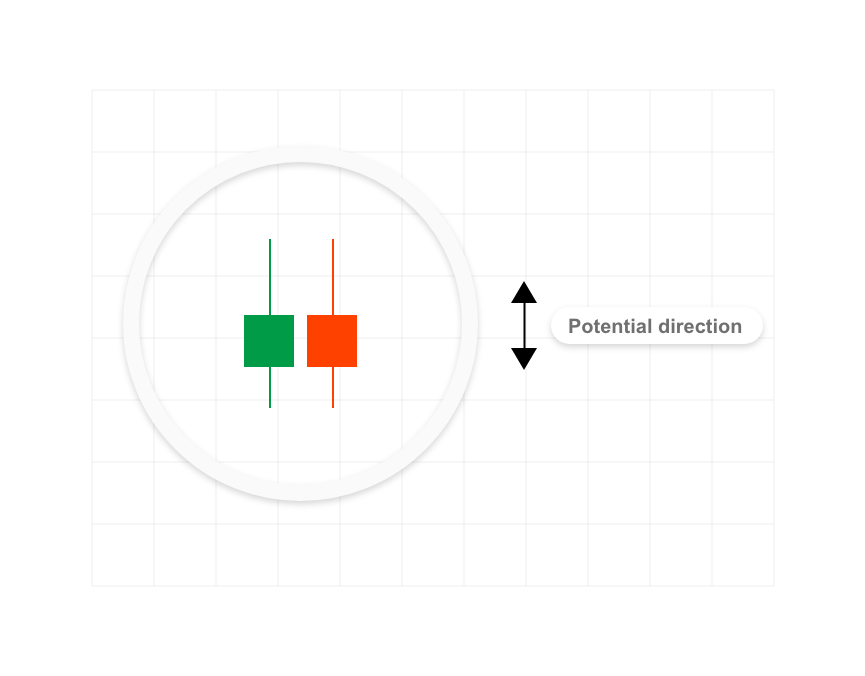
Spinning top
Spinning top candlestick pattern has a short body centred between wicks of equal length. The pattern indicates indecision in the market, resulting in no meaningful change in price: the bulls sent the price higher, while the bears pushed it low again.
Spinning top is often interpreted as a period of consolidation, or rest, following a significant uptrend or downtrend.
On its own, a spinning top is a relatively benign signal, but can be interpreted as a sign of things to come as it signifies that the current market pressure is losing control.
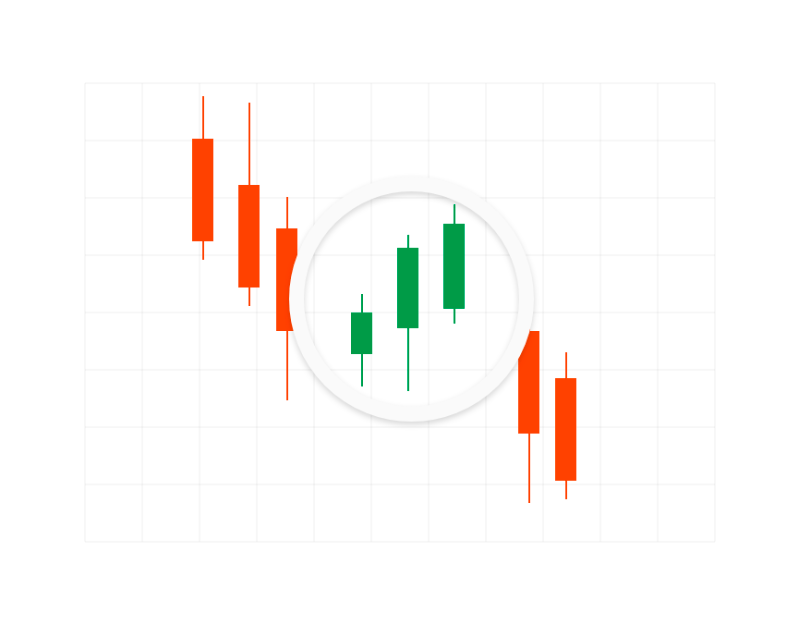
Falling three methods
Three-method formation patterns are used to predict the continuation of a current trend, be it bearish or bullish. The bearish pattern is called the falling three methods.
It is formed by a long red body, followed by three small green bodies, and another red body - the green candles are all contained within the range of the bearish bodies. It shows traders that the bulls do not have enough strength to reverse the trend.
Rising three methods
The opposite is true for the bullish pattern, called the rising three methods candlestick pattern. It comprises three short reds sandwiched within the range of two long greens.
The pattern shows traders that, despite some selling pressure, buyers are retaining control of the market.