Heikin Ashi chart
Heikin Ashi means average bar in Japanese and it is an offshoot of the candlestick technique.
Heikin Ashi candlesticks use the open-close data from the prior period and the open-high-low-close (OHLC) data from the current period to create a candlestick. The resulting candlestick filters out some noise to better capture the trend. Taken together, Heikin Ashi represents the average pace of prices.
Heikin Ashi candlesticks are not used the same as the normal Japanese candlesticks, as they do not display any visible bullish or bearish trading patterns that may consist of one to three candlesticks. Instead, these candlesticks can be used to identify trending periods, potential reversal points and classic technical analysis patterns.
It is recommended to use Heikin Ashi in conjunction with the candlestick chart when trading securities to spot market trends and predict future prices.
It makes candlestick charts more readable and trends easier to analyse. For example, traders can use Heikin Ashi charts to know when to stay in trades while a trend persists but get out when the trend pauses or reverses.
Calculation formula
Normal candlestick charts are composed of a series of open-high-low-close (OHLC) candles set apart by a time series. The Heikin Ashi technique shares some characteristics with standard candlestick charts but uses a modified formula of close-open-high-low (COHL):
Formula
Close = (Open + High + Low + Close)/4.
Open = (open of previous bar + close of previous bar)/2.
High = the maximum value from the high, open, or close of the current period.
Low = the minimum value from the low, open, or close of the current period.
It is obvious that before you can calculate the future Heikin Ashi candlesticks, you need to have your first Heikin Ashi candlestick. Therefore, the first calculation simply uses data from the current open, high, low and close.
-
The first Heikin Ashi close equals the average of the open, high, low and close
((O+H+L+C)/4). -
The first Heikin Ashi open equals the average of the open and close
((O+C)/2). -
The first Heikin Ashi high equals the high and the first Heikin Ashi low equals the low.
Explanation
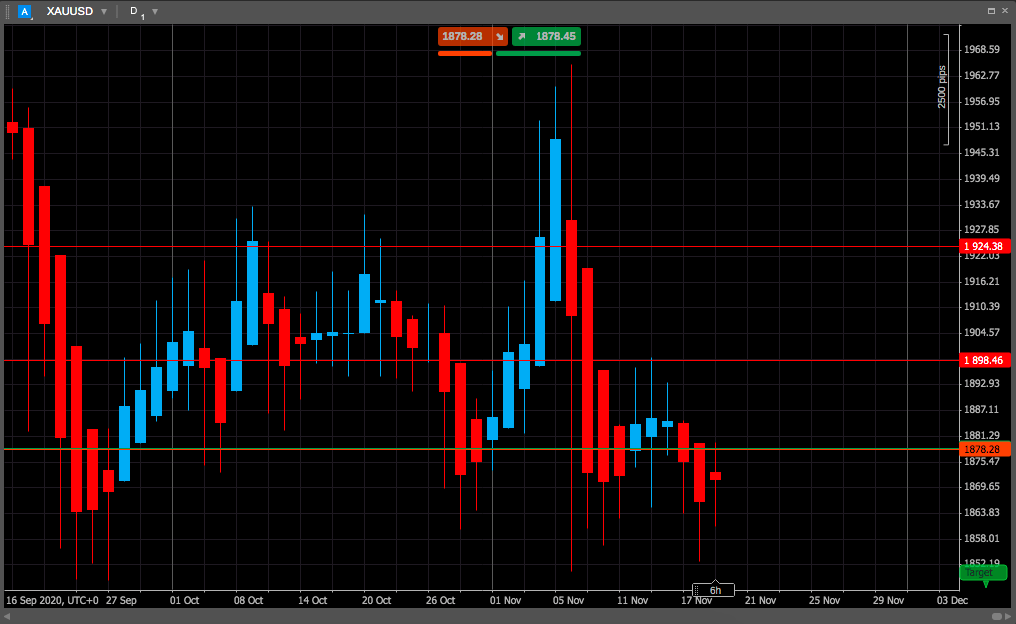
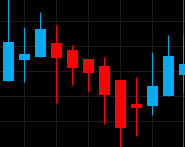
Heikin Ashi candlesticks are very similar to normal candlesticks, but differ in some key features. In cTrader charts, a Heikin Ashi candlestick is blue when the close is above the open. Conversely, Heikin Ashi candlesticks are red when the close is below the open. This is similar to normal candlesticks, which are red when the close is below the open and green when the close is above the open.
While traditional candlestick patterns cannot be applied to Heikin Ashi candlesticks, there is still valuable information that can be obtained from these charts.
A long blue Heikin Ashi candlestick shows strong buying pressure over a two-day period. The absence of a lower wick also reflects strength. A long red Heikin Ashi candlestick shows strong selling pressure over a two-day period. The absence of an upper wick also reflects selling pressure.
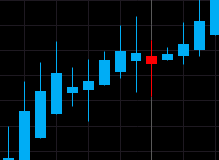
Small Heikin Ashi candlesticks or those with long upper and lower wicks show indecision over the last two bars. This often occurs when one candlestick is red and the other is blue.
You can apply Heikin Ashi candlestick charts to any market, most charting platforms include them as an option. There are five primary signals that identify trends and buying opportunities:
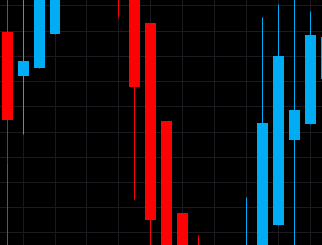
1. Blue candles with no lower wicks indicate a strong uptrend.
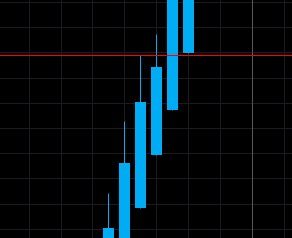
2. Blue candles signify an uptrend - a signal to add to the long position and exit short positions.
3. Candles with a small body surrounded by upper and lower wicks indicate a trend change - risk-loving traders might buy or sell here, while others will wait for confirmation before going long or short.
4. Red candles indicate a downtrend - a signal to add to the short position and exit long positions.
5. Red candles with no higher wicks identify a strong downtrend - a signal to stay short until there is a change in trend.
These signals may make locating trends or trading opportunities easier than with traditional candlesticks. The trends are not interrupted by false signals as often and are thus more easily spotted. Heikin Ashi candlesticks provide chartists with a versatile tool that can filter noise, foreshadow reversals and identify classic chart patterns.
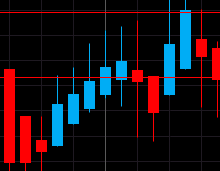
In fact, all aspects of classical technical analysis can be applied to these charts. Chartists can use Heikin Ashi candlesticks to identify support and resistance, draw trend lines or measure retracements. Volume indicators and momentum oscillators also work well.