Line chart
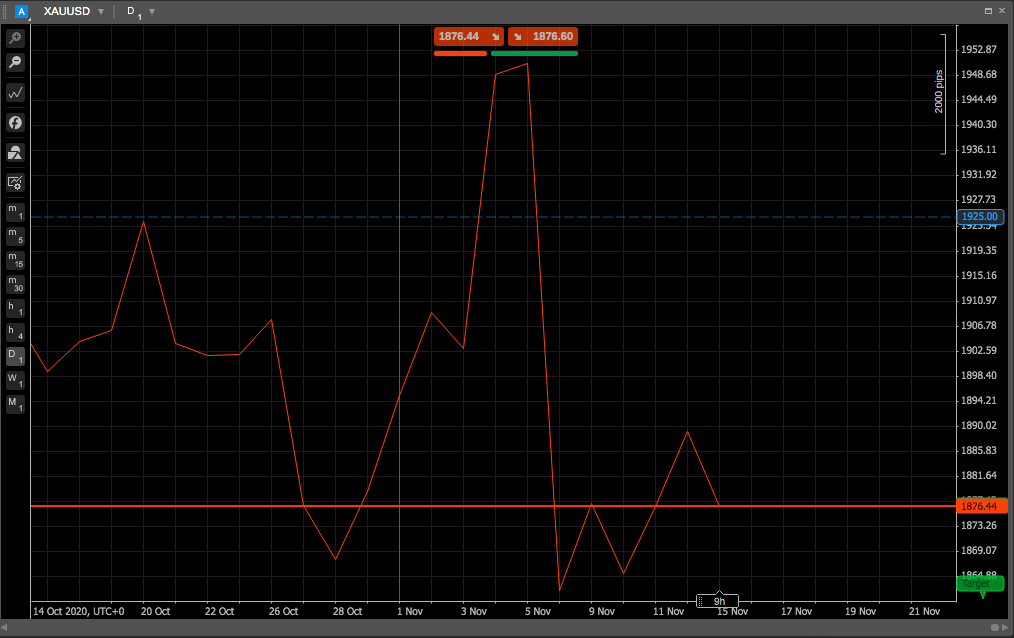
The line chart draws an unbroken line connecting the closing prices for the selected period on the charts. It is a graphical representation of an asset's historical price movement that connects a series of data points with a continuous line.
This is the most basic type of chart used in finance and typically only depicts a security's closing prices over time. Line charts can quickly assist traders in their technical assessment of price action by showing the general trend.
Line charts can be used on any period, but are most often applied to daily price changes. Traders can use line charts with the other chart types to see the full technical picture.
Principles of a line chart
A line chart gives traders a clear visualisation of where the price of a security has travelled over a given period (1 day by default in cTrader). Because line charts display only the closing prices, they reduce the noise from less critical periods in the trading day, such as the open, high and low. Since closing prices are typically considered the most important, it is understandable to see why line charts are popular with investors and traders.
This chart is also good for visualisation of the overall trend of a security.
Benefits
The main benefit of using the line chart is its clarity. Traders can be overwhelmed with too much information when analysing bar charts or candlestick charts. The trading term (paralysis by analysis) describes this phenomenon well. Using charts that display extensive price information and indicators can give multiple signals that lead to confusion and complicate trading decisions.
Using a line chart helps traders clearly identify key support and resistance levels, trends and recognisable chart patterns.
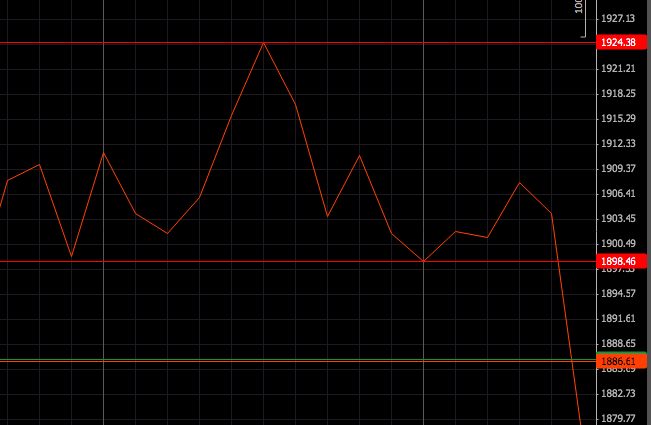
Example
The XAUUSD line chart below makes it easy to locate major support and resistance levels between USD 1924.38 and USD 1898.46 before the price drops below support.
The other benefit of the line chart is that it is easy to use. Line charts are ideal for beginner traders to use due to their simplicity. They help teach basic chart reading skills before learning more advanced techniques, such as reading candlestick patterns or learning the basics of point and figure charts.
Drawbacks
Line charts lack detail and nuance. They offer a quick impression of the trend, but you do not get a feel for how the trend was constructed. Line charts may not provide enough price information for some traders to monitor their trading strategies.
Some strategies require prices derived from the open, high and low. For example, a trader may buy a stock if it closes above the high price of the previous 20 days. Also, traders who use more information than just the close, do not have enough information to backtest their trading strategy by using a simple line chart.
Candlestick charts, which contain an asset's daily open, close, high and low prices all in the same unit may be more useful in these cases.