Range chart
The range chart removes time from its calculations and only considers symbol price. These bars are based solely on price and offer another way to view and utilise market volatility.
Range bar charts can display any number of bars within a session. More bars appear during volatile periods, while fewer are printed when volatility is low.
The number of range bars created during a trading session also depends on the symbol being charted and the specified price movement for each range bar.
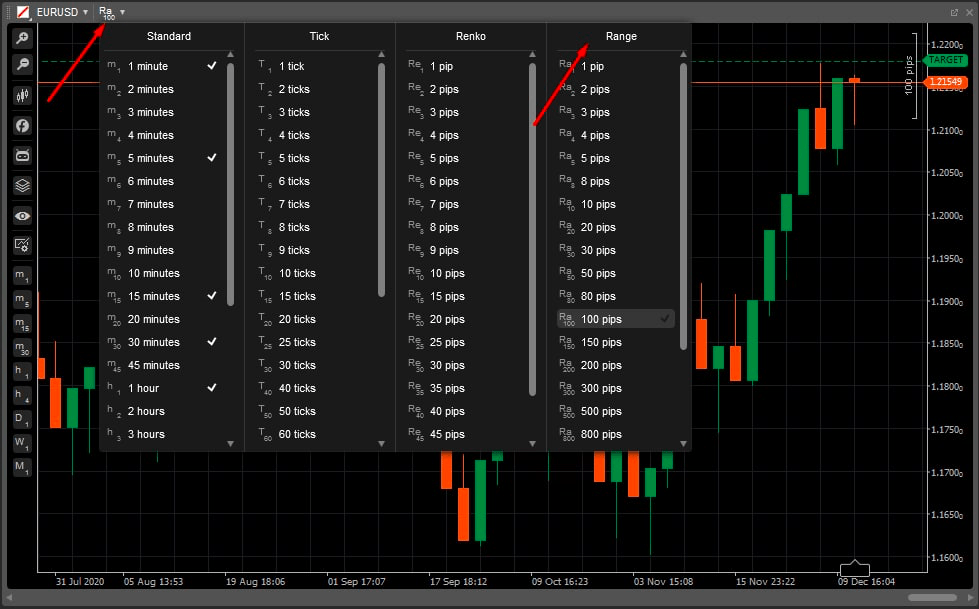
In cTrader, to switch your currently opened chart to range bars, select the period icon in the upper-left corner of the chart, then choose a value from 1 to 10000 pips in the Range section.
Depending on your choice, your range chart will be built considering the respective number of pips.
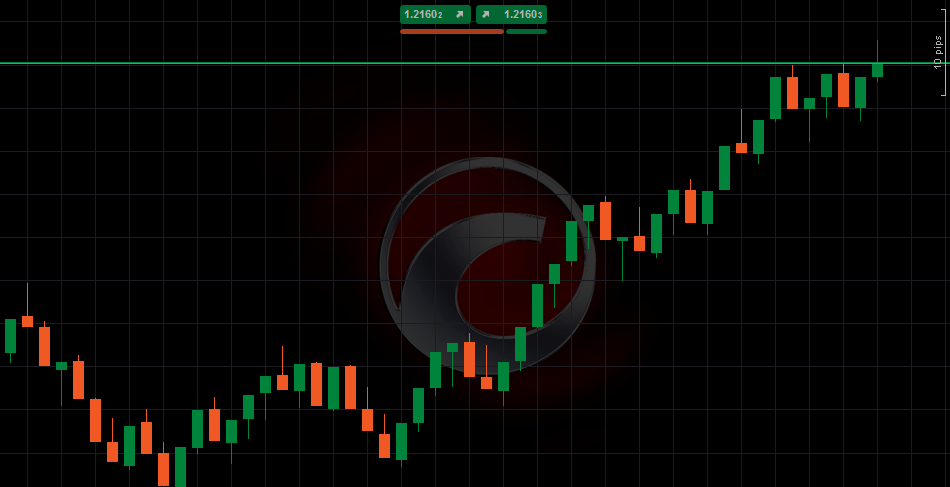
In the range chart, all price bars are of equal length. For example, if you set a 10-pip range bar, then all bars in the chart are of 10-pip range (high to low, or low to high).
Each new bar opens at the first price that enters its range. It opens outside the previous bar’s high or low, and closes at either its own high or low. Each range bar is defined by the same price increment and its closure takes place at the range's high or low, regardless of where it was opened. Therefore, if you want to show the price movement by the specific number of ticks up or down in the chart, you should set this value as the chart’s period.
Like Renko charts, range bars display price in a condensed form, reducing much of the noise that occurs when prices move back and forth between a narrow range to a single bar or two.
As range bar charts eliminate much of the noise, they become very useful when it comes to drawing trendlines. In cTrader, areas of support and resistance are emphasized automatically. Hover over a trendline to see its details in a pop-up on the chart.
Usage
The main benefit of range charts is that they present price in a condensed form. The noise is mostly eliminated to fit one or two bars, as each next bar will not be built until the specified price range is satisfied.
Trendlines are commonly used with range charts. Horizontal trendlines highlight support and resistance, while upward and downward trendlines show trending periods.
Example
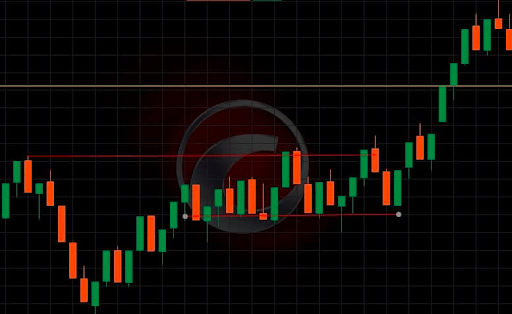
The screenshot below shows trendlines on a 10-pip EURUSD range bar chart. The horizontal lines show that repeated price movement within a range can lead to a stronger breakout once the price breaks through.
This principle applies to both upward and downward trendlines: the more times the price touches the line, the greater the potential move once a breakout occurs.
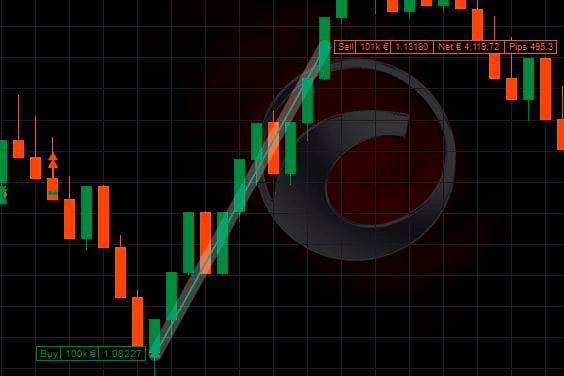
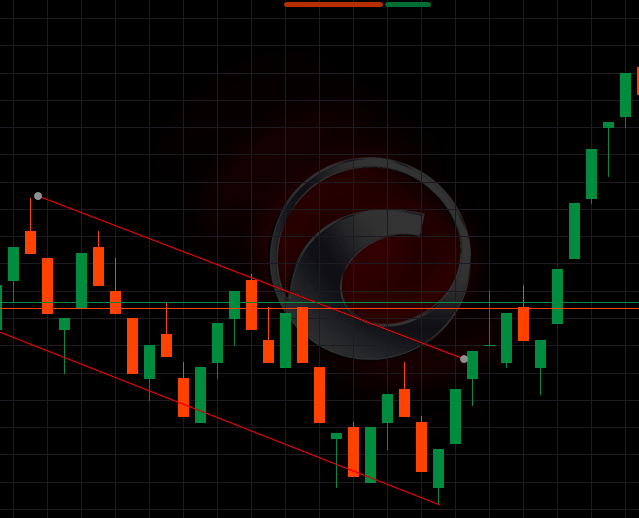
The next example shows a price channel formed by two parallel downward trendlines on a 1-pip EURUSD range bar chart. Trendlines are a natural fit for range bar charts. With less noise, trends can be easier to identify.
The biggest advantage of a range bar is that its information reflects actual price activity, not just time-based signals. When using a time-based technical signal, your trade is late by definition.
The price movement must occur before it is displayed. Traders prefer range bars because unlike a chronology-based signal, a range bar is the actual price parameter a symbol has established over an undefined period.
Example
A 10-pip range bar candlestick shows a clearly defined trading range. A move above or below this range is considered a price expansion, not a breakout.