Commodity Channel Index
Definition
The Commodity Channel Index (CCI) is a versatile momentum-based technical analysis indicator that measures the deviation of an asset's price from its average price over a specific period. Although originally developed for commodities, the CCI is now widely applied to other asset classes, including stocks and forex, to identify overbought and oversold conditions.


History
The CCI was developed by Donald Lambert, a technical analyst and introduced in his 1980 article in Commodities magazine (now known as Futures). Lambert designed the indicator to identify cyclical price patterns in commodities, but it has since gained broader use across various financial markets due to its effectiveness in measuring market trends and reversals.
Calculations
1. First, the Simple Moving Average (SMA) of the Typical Price (TP) over the specified number of periods \(n\) needs to be determined.
\[ SMA (TP) = { 1 \over n } { \sum_{i=0}^{n-1} { TP_{t-1} } } \]
2. Then, the mean absolute deviation of the source from the SMA over the same period should be calculated.
\[ Mean\ Deviation = { { \sum_{i=0}^{n=1} | TP_{t-1} - {SMA (TP)} | } \over n } \]
3. Finally, the Commodity Channel Index is computed, using the SMA and mean deviation.
\[ CCI = { { TP_t - SMA (TP) } \over { 0.015 \times Mean\ Deviation} } \]
\(t\) is the current index and 0.015 is a constant used to standardise the CCI values, allowing most results to fall between +100 and -100.
Interpretation
By default, the number of periods for the CCI calculation is set to 20.
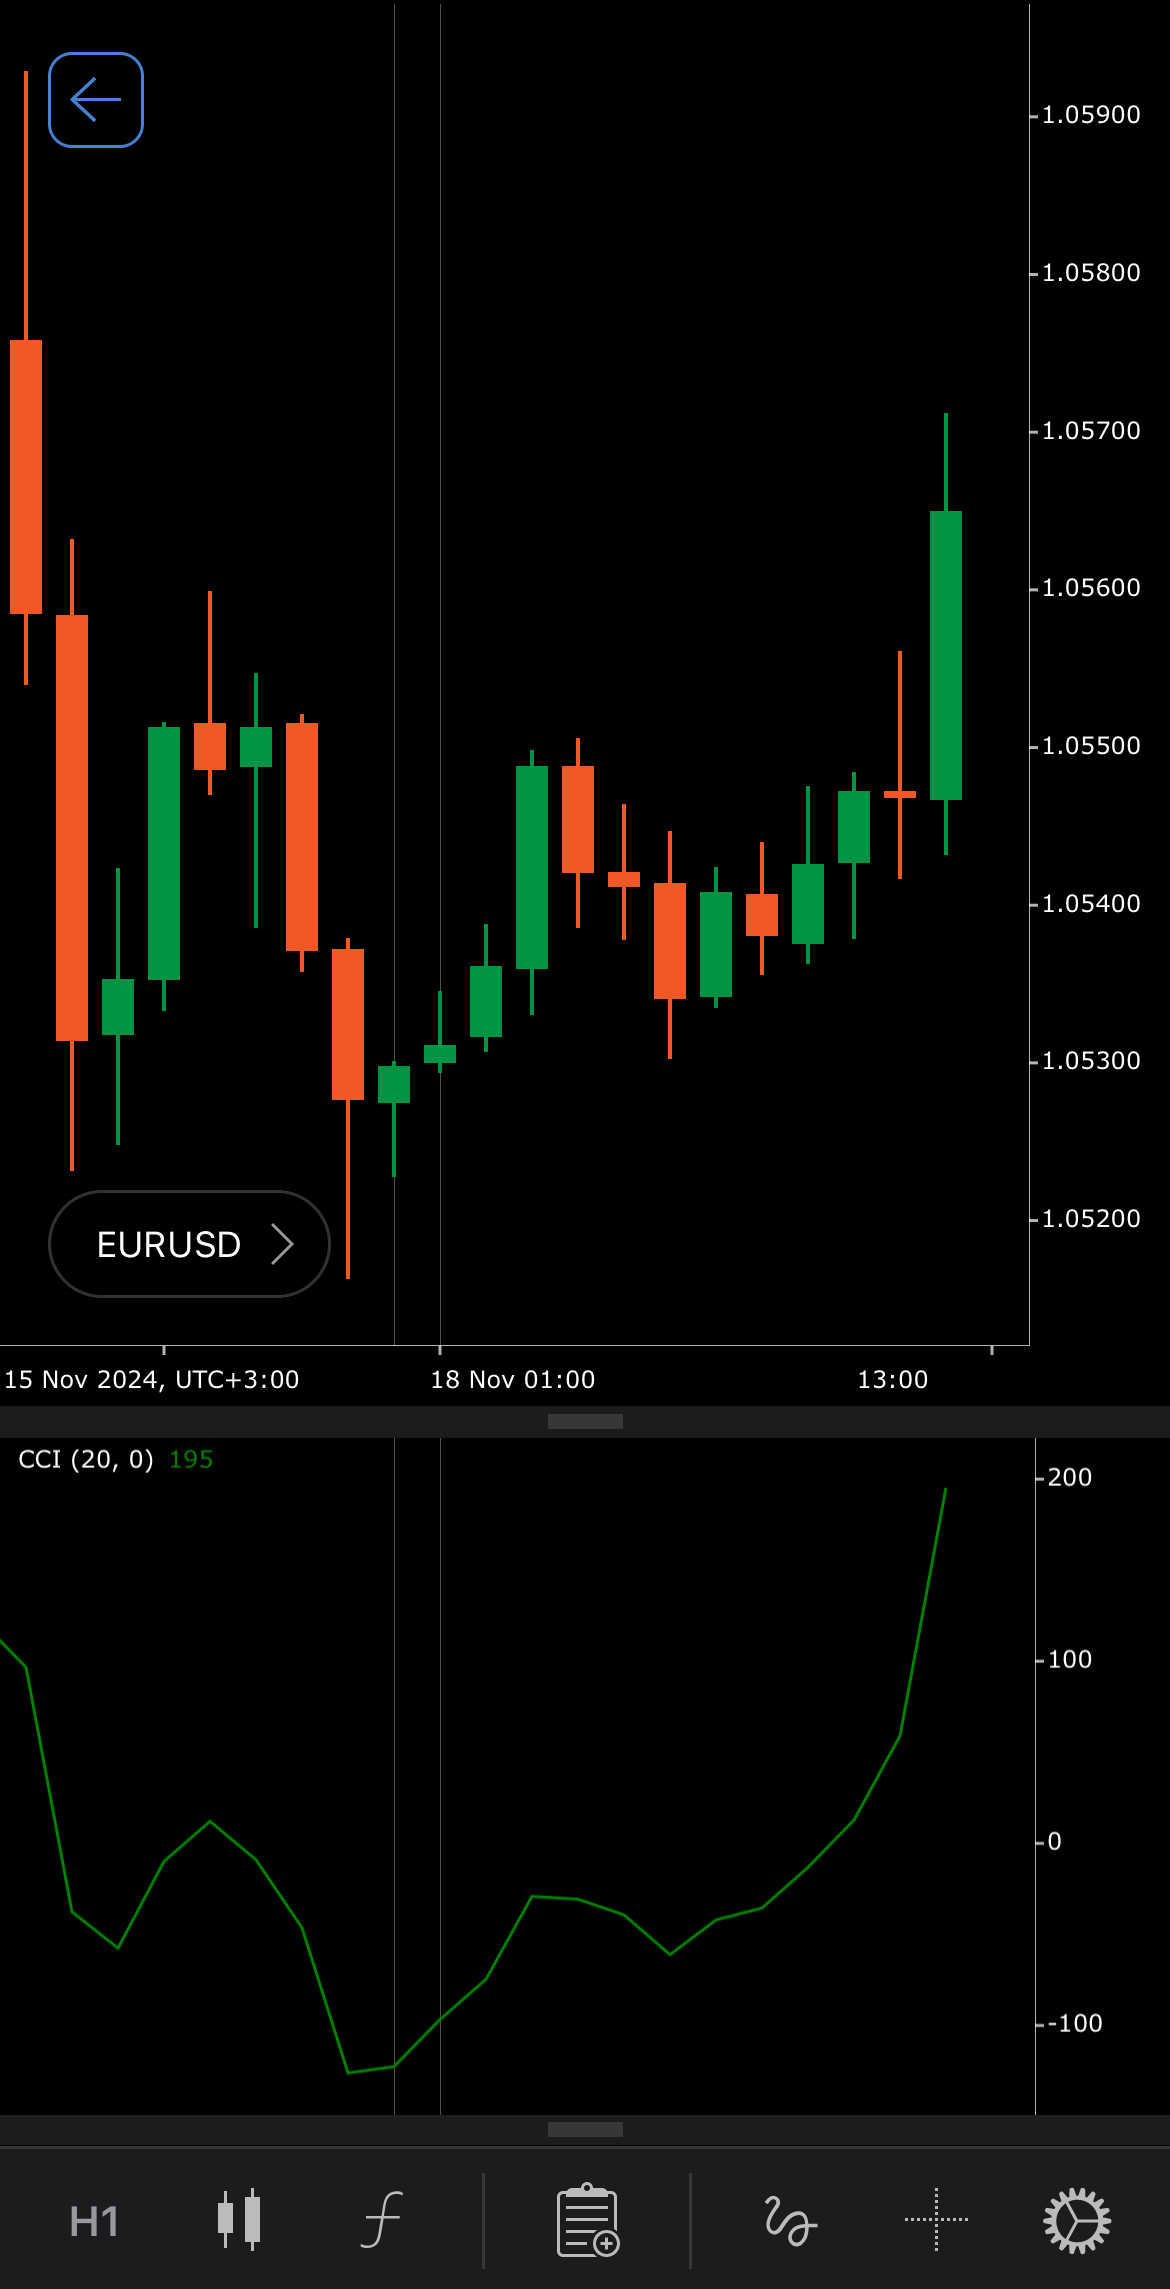
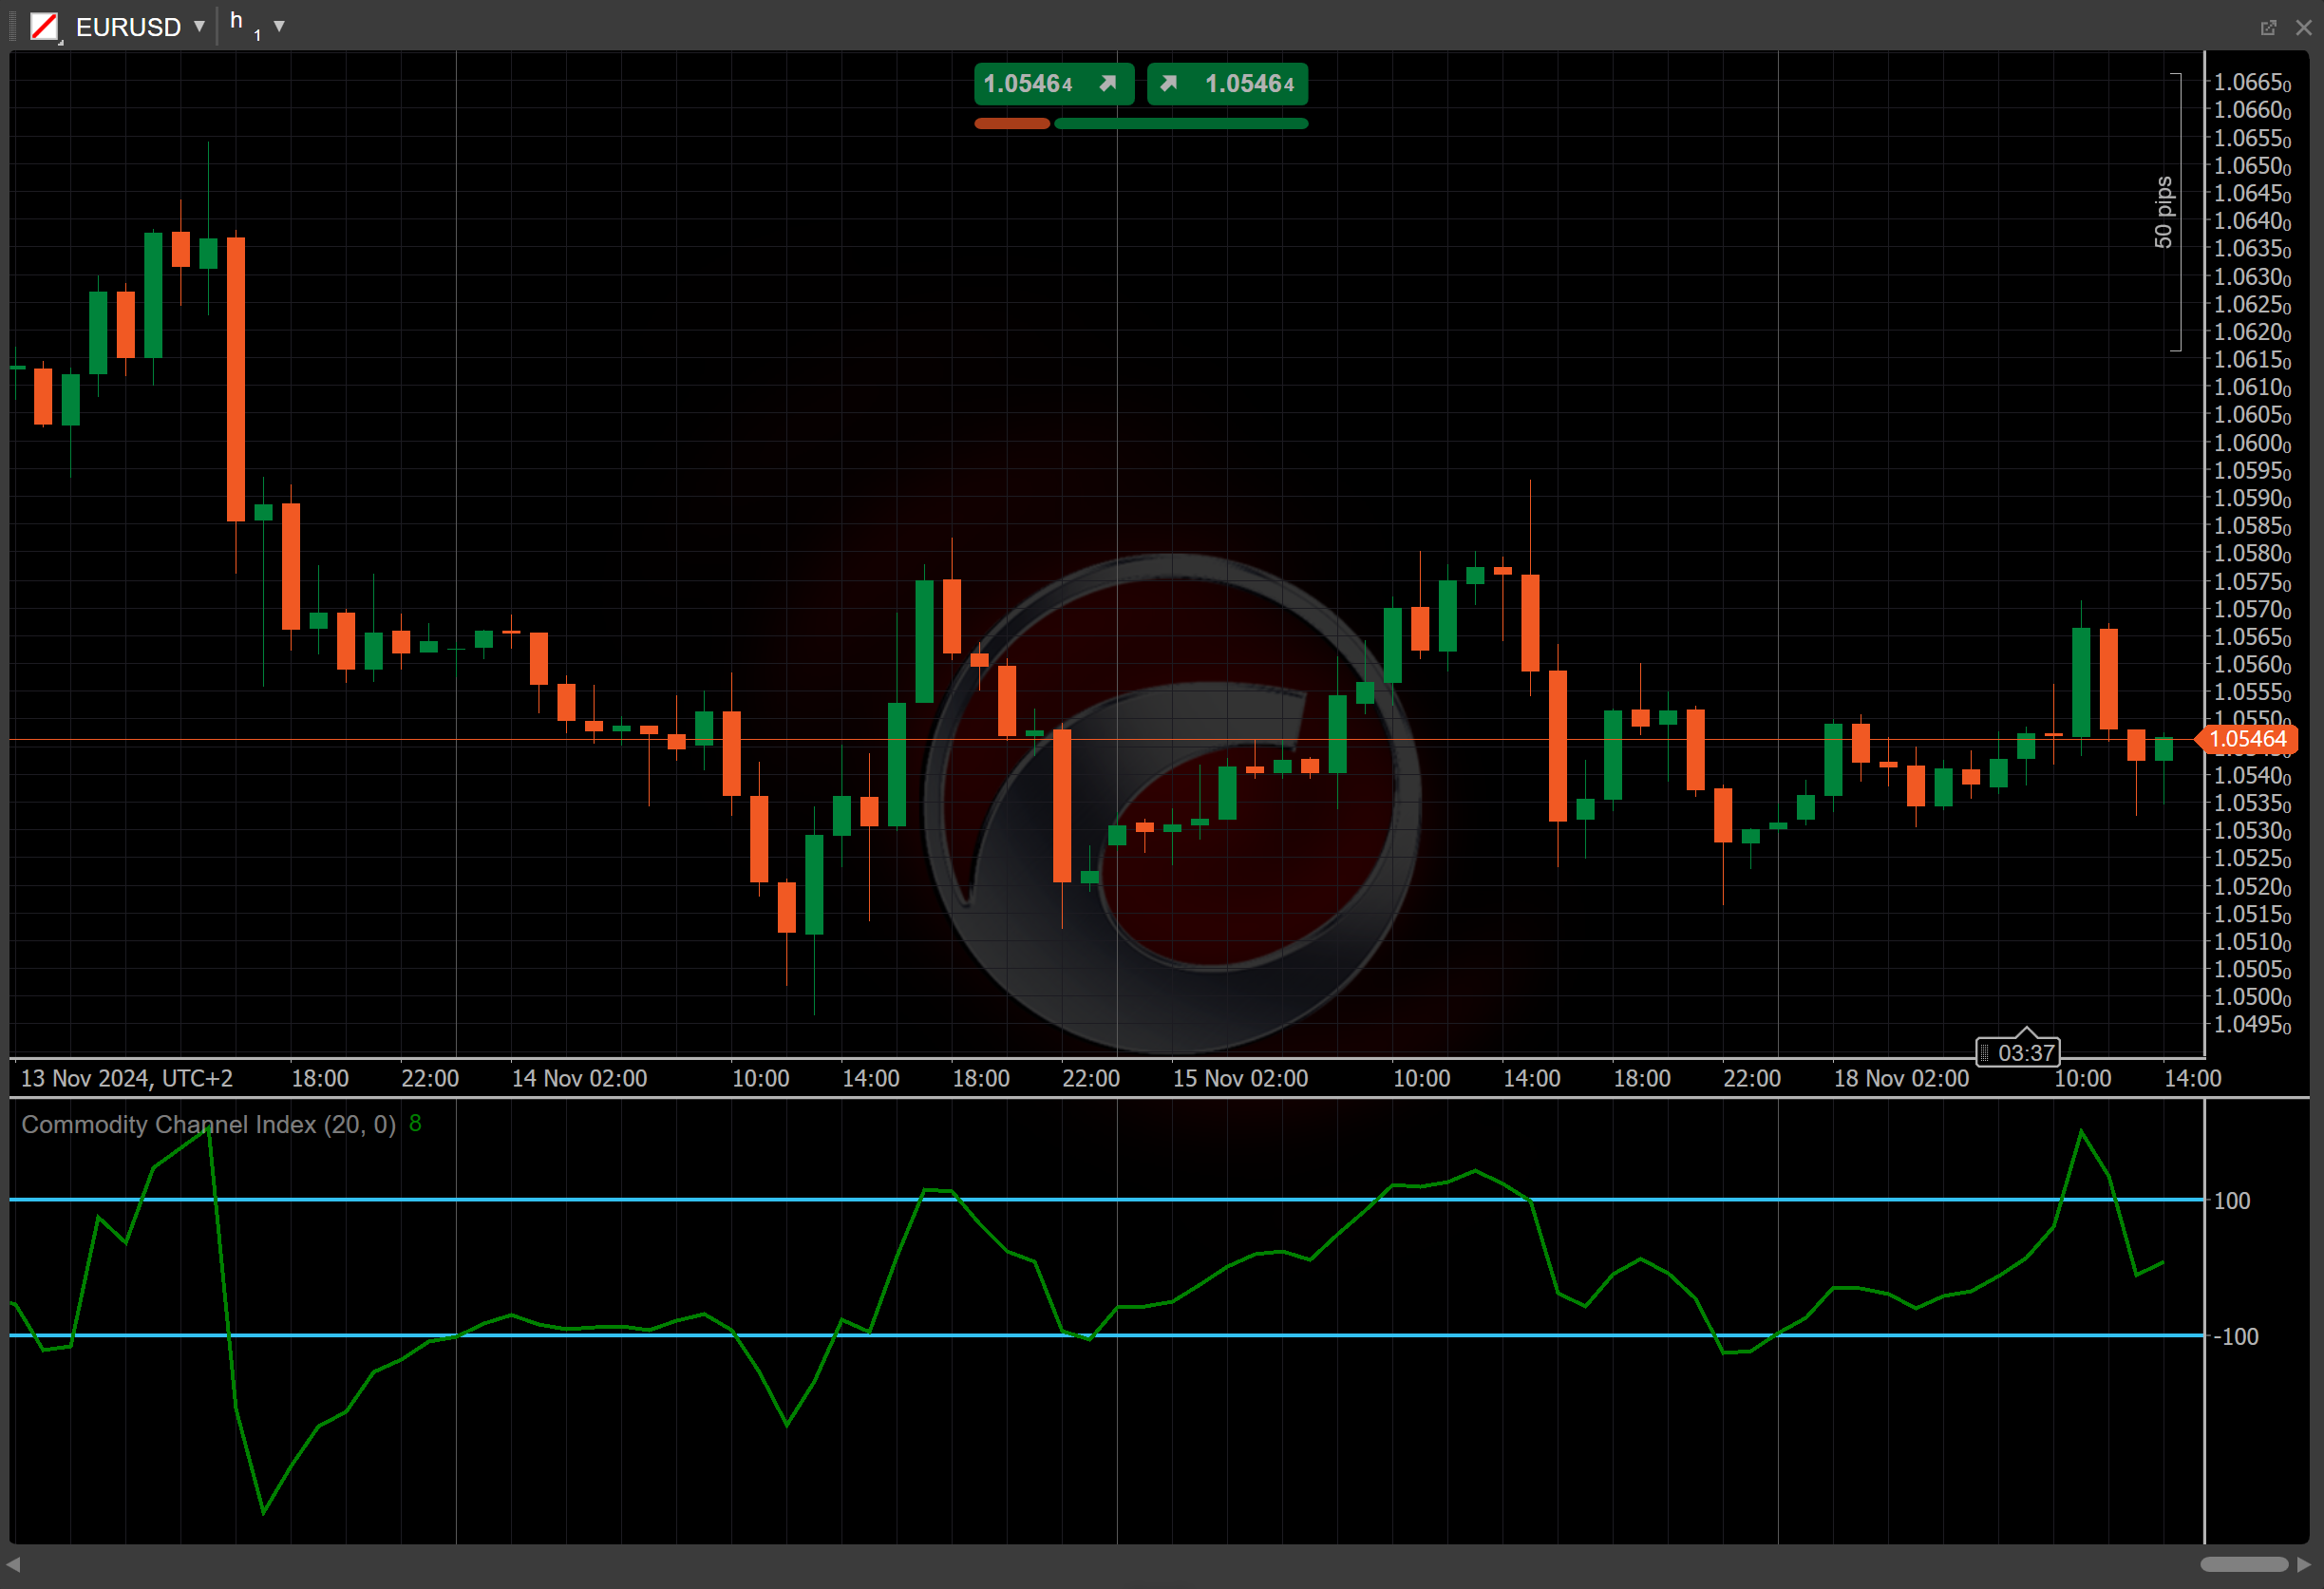
The CCI is used to identify overbought or oversold conditions, as well as potential reversals in price trends.
-
Overbought and oversold levels – the CCI above +100 is considered overbought, suggesting a potential downward correction or reversal. The CCI below -100 is considered oversold, indicating a potential upward reversal.
-
Zero-line crossover – crossing above zero suggests positive momentum and potentially signals the beginning of an uptrend. Crossing below zero indicates negative momentum, suggesting a possible downtrend.
-
Divergence – bullish divergence occurs when the price makes lower lows, but the CCI makes higher lows, indicating weakening downward momentum and a potential reversal. Bearish divergence occurs when the price makes higher highs, but the CCI makes lower highs, indicating weakening upward momentum and a potential reversal.
-
Shift – by adjusting the shift parameter to alter the alignment of the CCI indicator with price data on the chart, you can explore how the CCI readings correspond to past or future price movements.
Application
The CCI can be applied to several trading strategies.
-
Buy signals – when the CCI moves from below -100 to above -100, it suggests that the asset is emerging from an oversold condition, potentially signalling a buying opportunity. A move above +100 indicates strong upward momentum, suggesting the beginning of a new uptrend. This can be interpreted as a buy signal, with the position held until the CCI moves back below +100.
-
Sell signals – when the CCI moves from above +100 to below +100, it may indicate that the asset is exiting an overbought condition, signalling a potential sell opportunity. This may indicate a good opportunity to close long positions or initiate short positions. A move below -100 suggests strong downward momentum, indicating the beginning of a new downtrend. This can be interpreted as a sell signal, with the position held until the CCI moves back above -100.
-
Trend confirmation – the CCI values crossing the zero line can confirm the strength of a current trend, allowing traders to enter positions early in the trend development.
-
Stop-loss placement – traders can place stop-loss orders based on the CCI signals, setting stops below oversold levels in a potential uptrend or above overbought levels during a potential downtrend.
Note
You can take advantage of algo trading, with cBots executing trades based on the signals from this indicator, as shown in our examples. Learn more about how to use indicators in cBots.
Limitations
The CCI may generate false signals in choppy or sideways markets. Additionally, the CCI effectiveness is highly dependent on the selected time frame and can vary across different assets.
Summary
The Commodity Channel Index is a versatile momentum indicator that helps traders identify overbought and oversold conditions, as well as potential trend reversals. By comparing an asset price to its average over a specified period, the CCI provides key signals for entering and exiting trades.