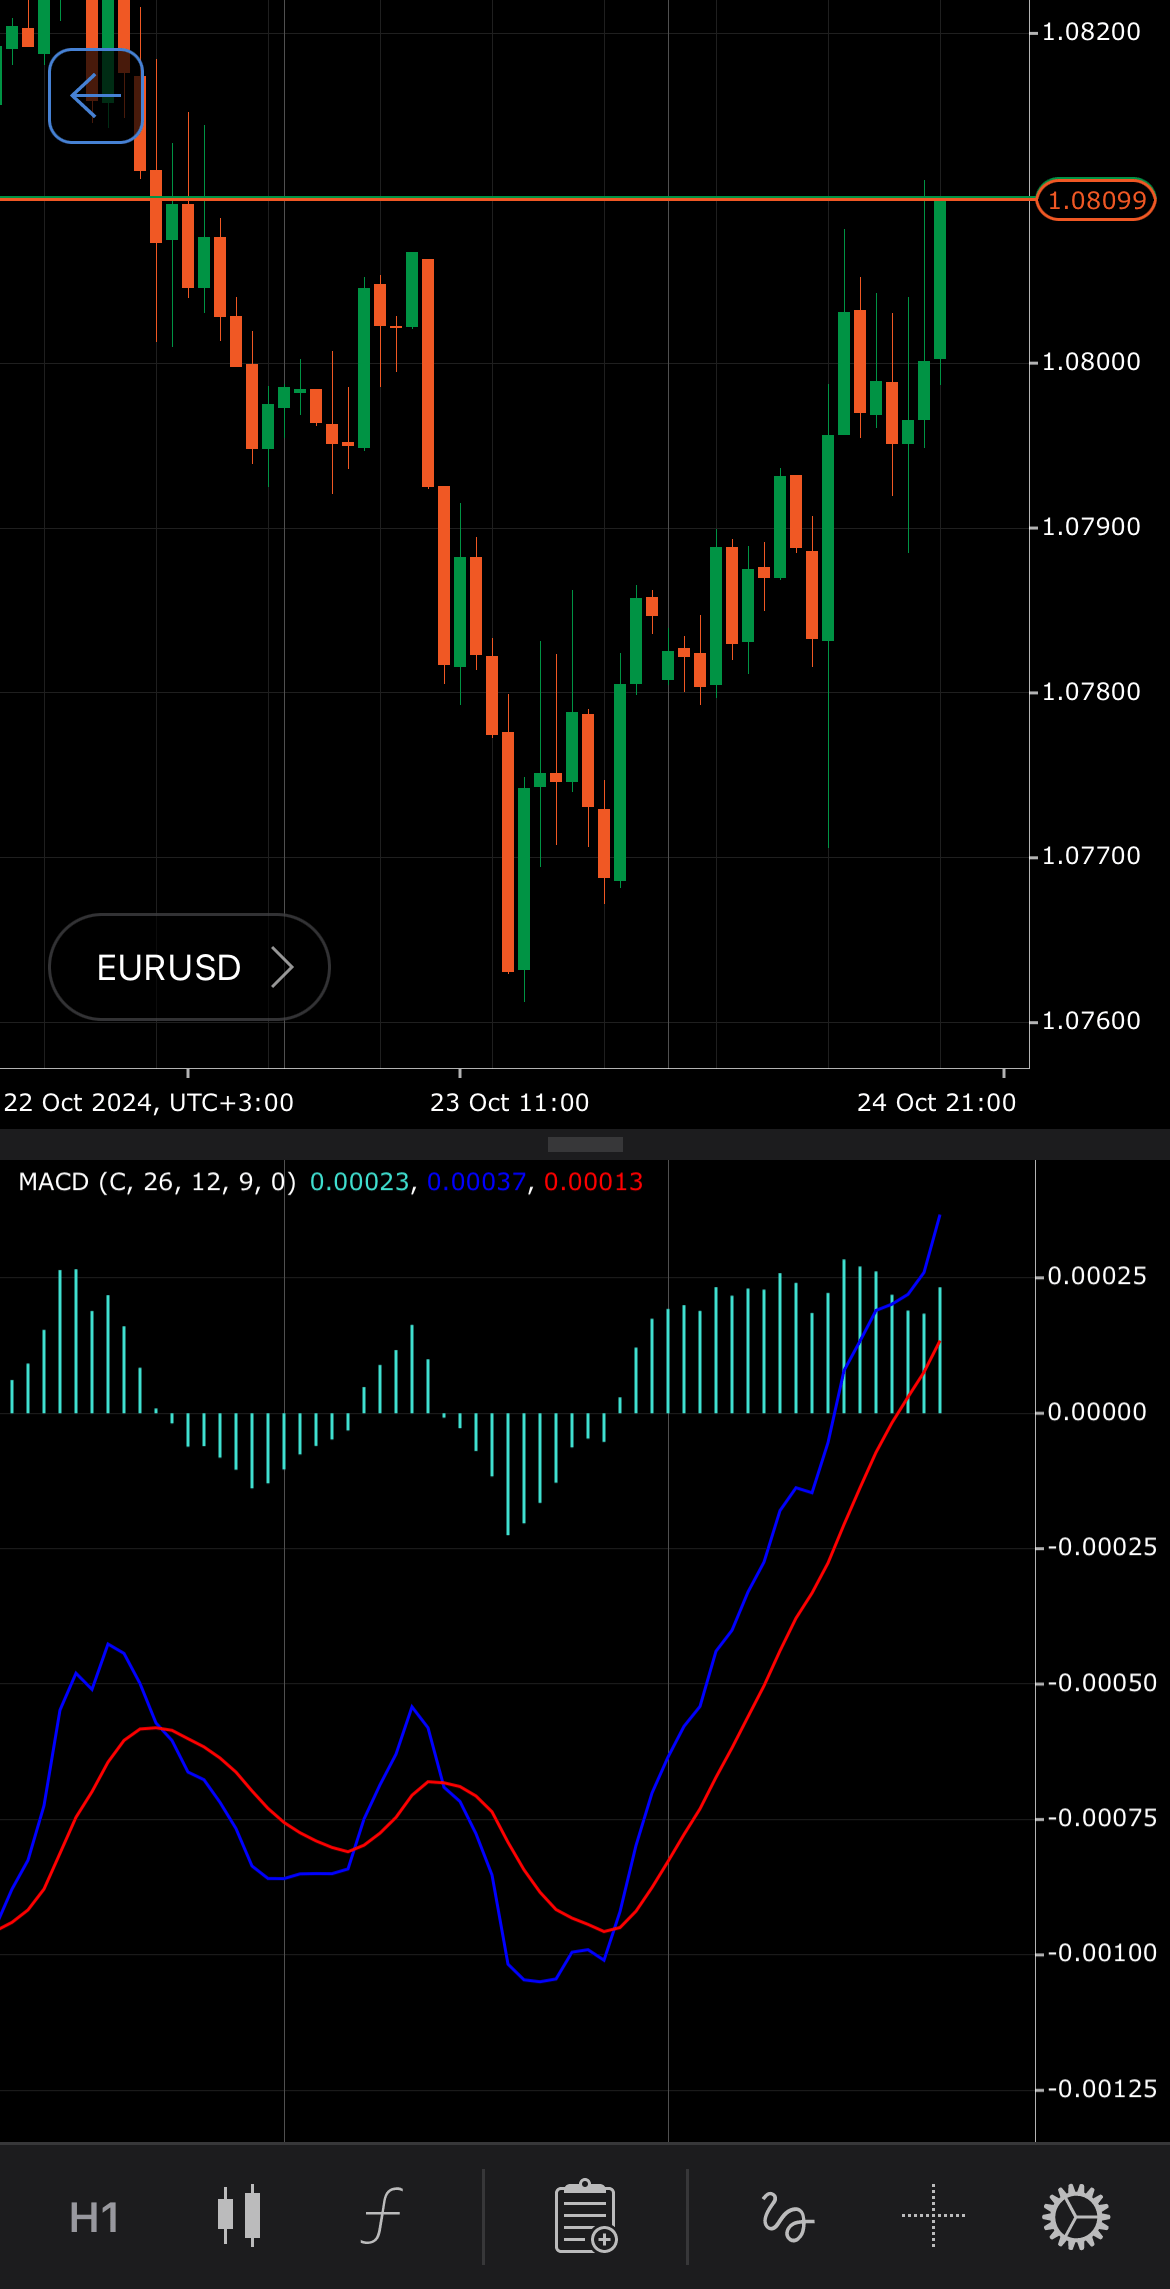
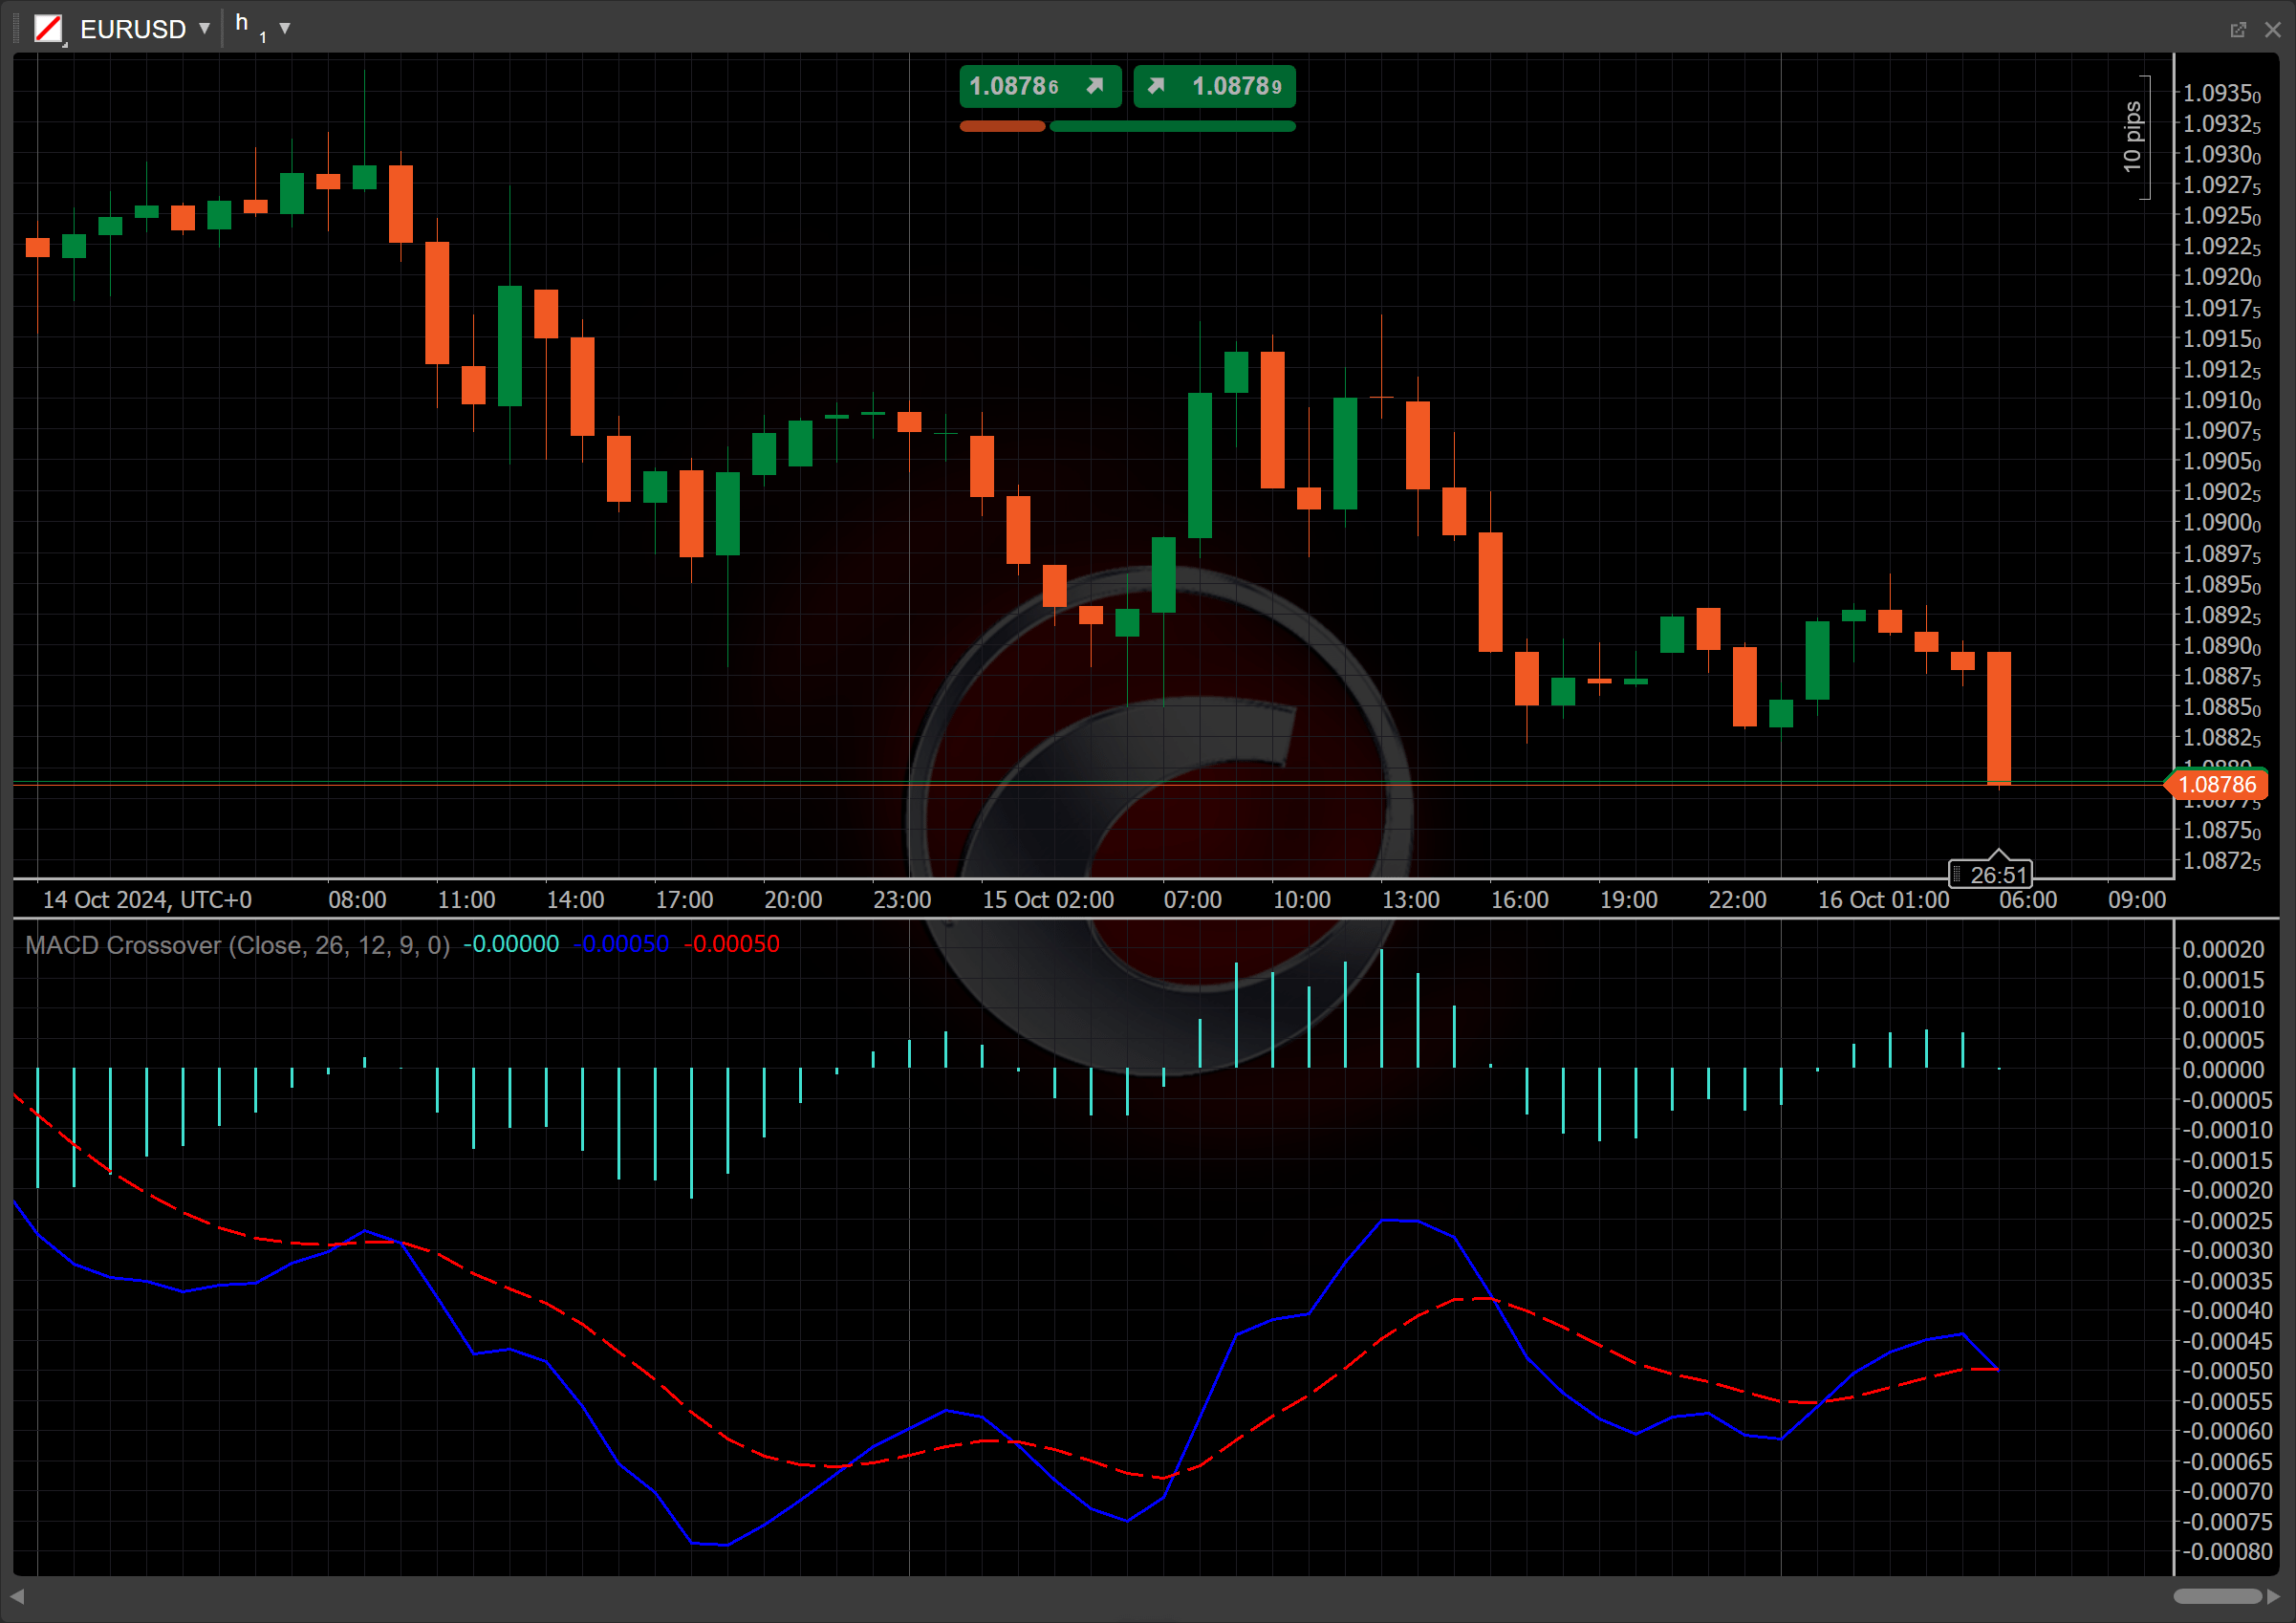
MACD Crossover
Definition
The Moving Average Convergence/Divergence (MACD) Crossover indicator is a technical analysis tool that identifies potential buy and sell signals by tracking the relationship between two key lines: the MACD line and the Signal line.
-
The MACD line is a trend-following momentum indicator that shows the relationship between two Exponential Moving Averages (EMAs) of a symbol price.
-
The Signal line is an EMA of the MACD line over a specified period.
When these lines intersect, an upward crossover suggests a potential buying opportunity, while a downward crossover indicates a possible selling opportunity.


History
MACD was created in the 1970s by Gerald Appel and has become one of the most widely used technical tools, easily accessible on most trading platforms provided by online stock brokers. It aimed to identify changes in the intensity, direction, momentum and duration of a stock price trend. By complementing the MACD line with its Signal line, traders are able to track appropriate buy and sell signals depending on the direction in which these lines cross.
Calculations
The Signal line is calculated as an EMA of the MACD line over a specified period:
\[ Signal\ Line = { EMA_n ( MACD\ Line ) } \]
\(MACD\) \(Line\) – the difference between the short-period and the long-period EMAs
\(EMA_n\) (\(MACD\) \(Line\)) – the \(n\)-period EMA of the MACD line
Interpretation
The MACD Crossover indicator is most commonly used with the following parameter values: a 12-day period for the short-term EMA, a 26-day period for the long-term EMA and a 9-day period for the EMA of the MACD line.
The main patterns of the indicator behaviour can be interpreted as follows:
-
Crossovers – when the MACD line turns upward, crossing over the Signal line, and continues or stays above it, a bullish crossover has occurred. This is a signal that a symbol price is on the rise. The exact opposite is true when the MACD line crosses down over the Signal line. This is a bearish crossover and if the MACD line continues to drop below the Signal line, it is a good indication that the bears are taking over. Crossovers are more reliable when they conform to the prevailing trend.
-
Divergence – an increasing divergence between the MACD line and its Signal line suggests strengthening momentum in the current trend, signalling that the trend is likely to continue.
Application
-
Buy signal – when the MACD line crosses above the Signal line, it indicates a potential buying opportunity. This is typically seen as a bullish crossover, signalling that upward momentum is gaining strength.
-
Sell signal – when the MACD line crosses below the Signal line, it generates a potential sell signal. This bearish crossover suggests increasing downward momentum and can signal a good time to exit long positions or enter short trades.
-
Stop-loss placement – to manage risk, traders usually place a stop loss below a recent support level for buy signals or above a recent resistance level for sell signals. The stop loss ensures protection in case the crossover fails to result in a sustained trend.
-
Exit strategies – consider exit when the MACD line crosses below the Signal line after a bullish crossover, indicating a potential reversal.
-
Confirming trades – traders often use additional indicators such as Relative Strength Index (RSI), Simple (SMA) or Exponential Moving Average (EMA) to confirm the strength of the MACD signal before committing to the trade. This reduces the likelihood of acting on false signals.
Note
You can take advantage of algo trading, with cBots executing trades based on the signals from this indicator, as shown in our examples. Learn more about how to use indicators in cBots.
Limitations
The MACD Crossover does not provide context about the overall market trend or strength, making it essential to combine it with other indicators for more reliable analysis. Crossovers can also generate false signals, particularly in volatile or sideways trends, leading to premature trades that may not result in significant price movement.
Summary
The MACD Crossover indicator identifies potential trend reversals by signalling when the shorter-term moving average crosses above or below the longer-term moving average. This indicator is based on the relationship between the MACD line and its Signal line, with crossovers indicating bullish or bearish momentum. An upward crossover suggests a potential buying opportunity, while a downward crossover indicates a possible selling opportunity. While effective for detecting changes in market direction, traders should be cautious of false signals, particularly in volatile or sideways conditions.