Mass Index
Definition
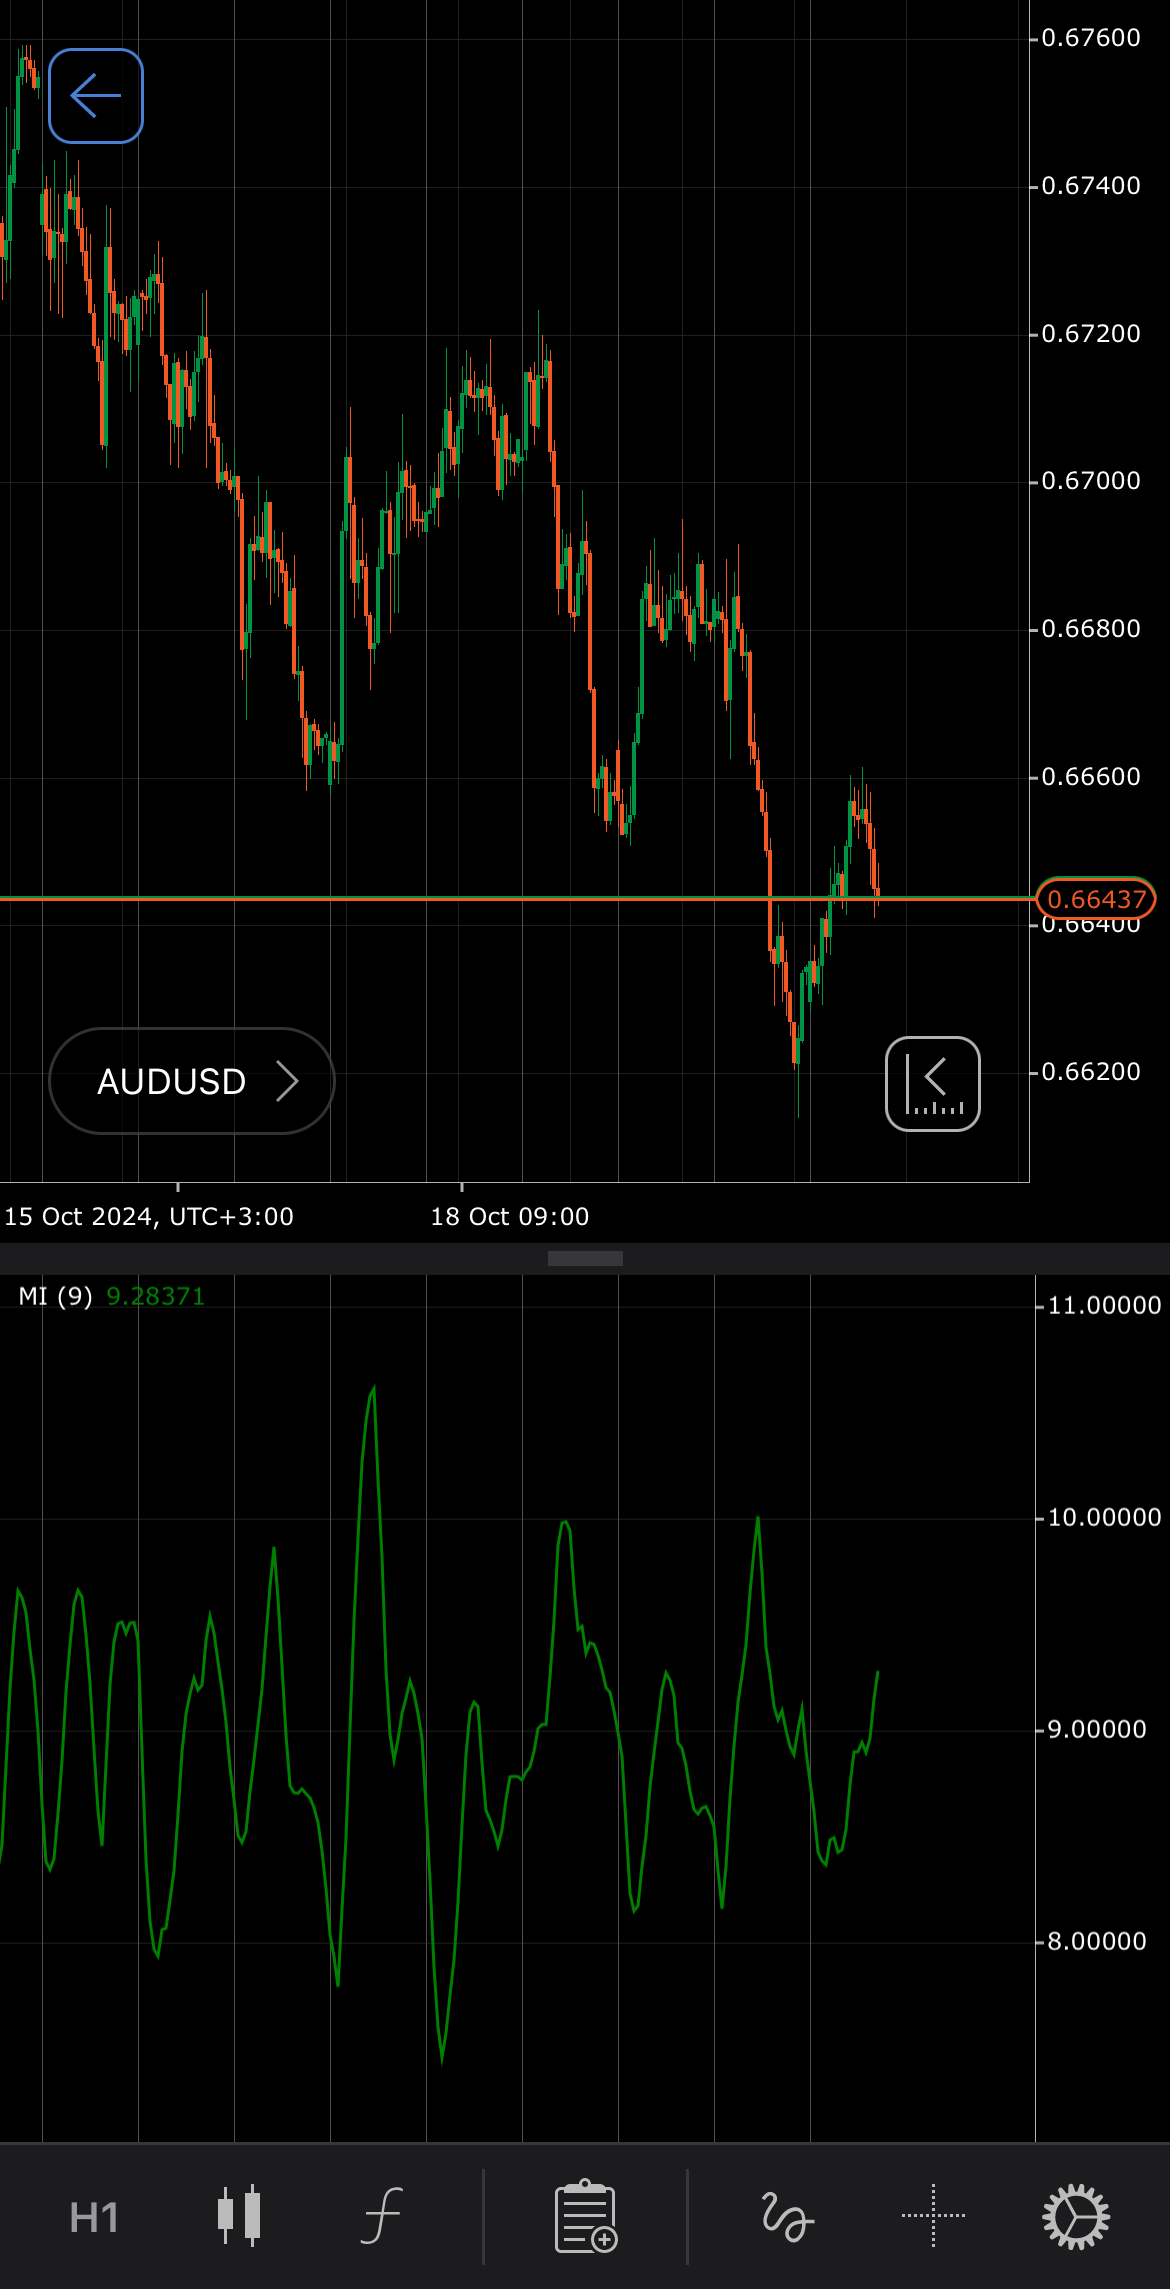
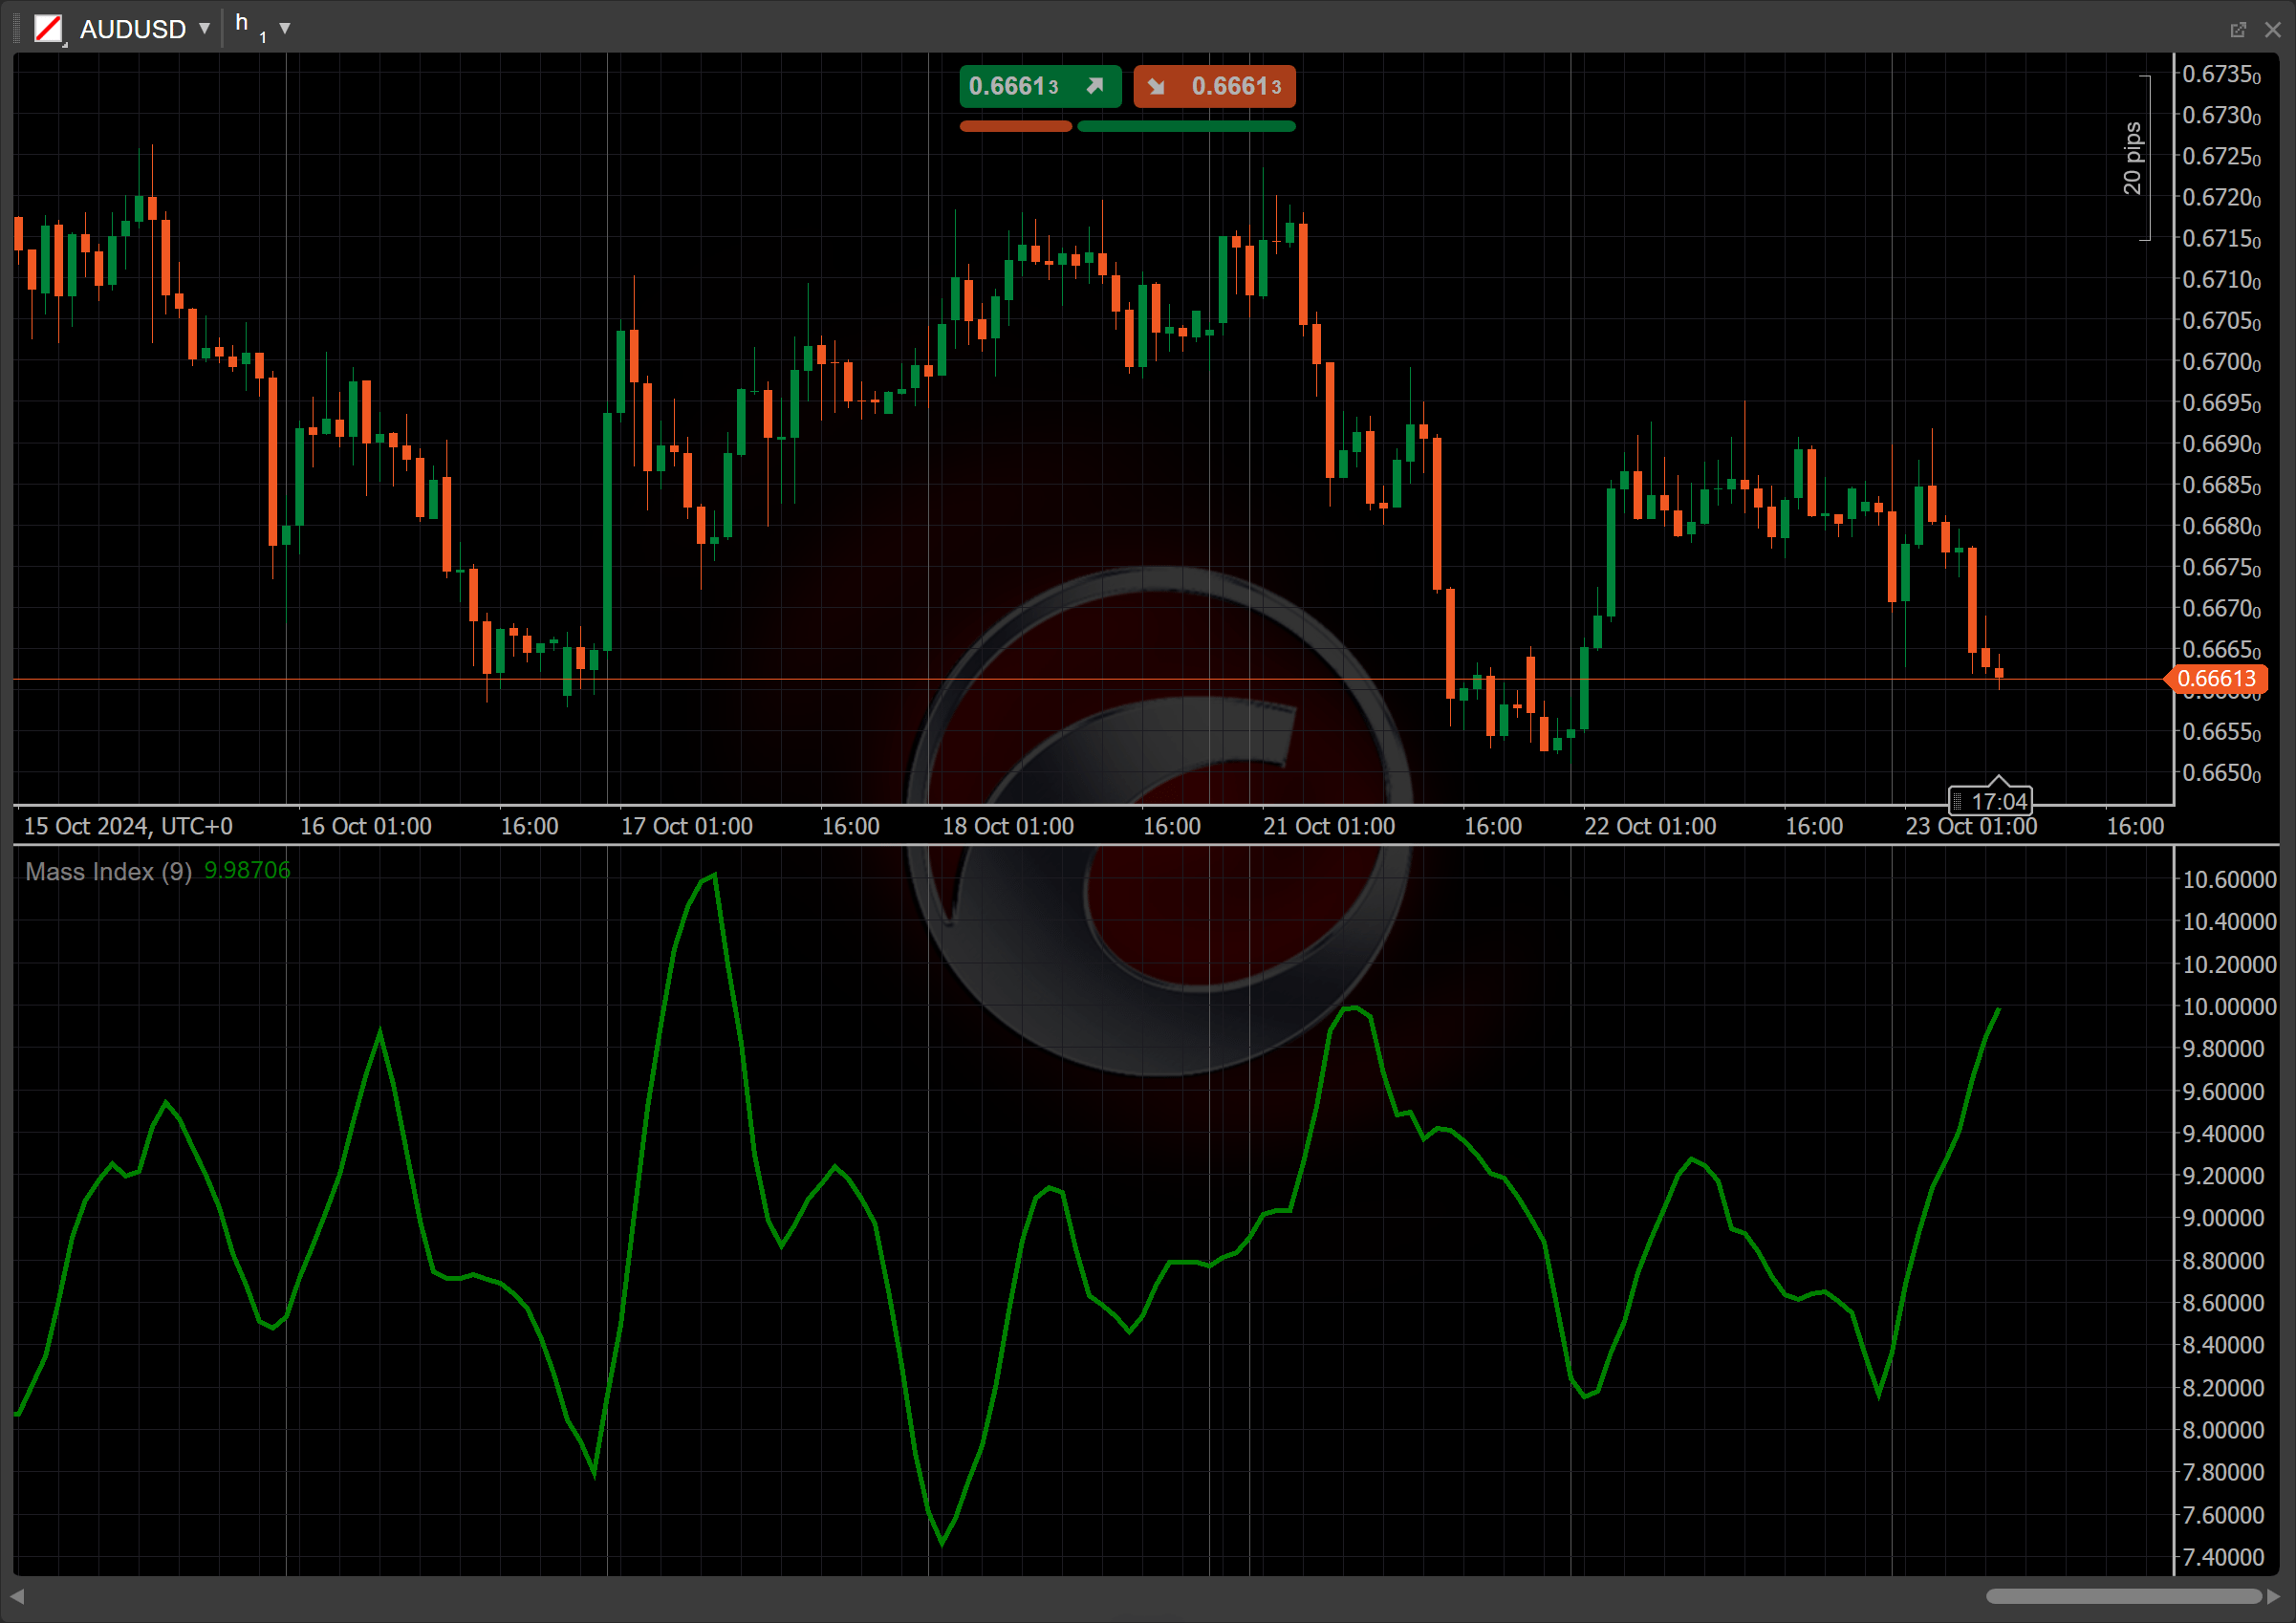
The Mass Index (MI) is a technical indicator that examines the fluctuations between high and low stock prices over a specific time frame. It suggests that a reversal of the current trend is likely when the range expands beyond a certain threshold and then subsequently narrows.


History
The Mass Index was developed by Donald Dorsey in the early 1990s as a tool for identifying potential trend reversals in financial markets. It was first introduced in his book "The New Trading Dimensions" published in 1994, where he emphasised the importance of price volatility in market analysis.
Calculations
The Mass Index is calculated by first determining its Exponential Moving Average (EMA), followed by the Exponential Moving Average of this EMA (a double average). The ratio of these two averages is then summed over a specified number of periods.
\[ Mass\ Index = \sum_{i=1}^n { {EMA\ (High - Low)} \over {EMA\ (EMA\ (High - Low))} } \]
\(n\) – the number of periods
\((High - Low)\) – the range for each period
\(EMA\) \((High - Low)\) – the EMA of the range
\(EMA\) \((EMA\) \((High - Low))\) – the EMA of the above
Interpretation
The Mass Index indicator is most commonly used with the 9-day period for the EMA and 25 days for the Mass Index calculation period. A Mass Index value below 26.5 typically suggests that the market is in a stable condition without significant volatility. In this range, there may not be an imminent trend reversal. When the Mass Index rises above a key threshold and then falls below it, it signals a possible trend reversal.
Application
While monitoring the Mass Index, the key trading signal is the so-called "reversal bulge". This occurs when the 25-period Mass Index rises above 27 and then falls back below 26.5. Such behaviour is interpreted as a probable signal of trend reversal (regardless of the trend direction).
-
Buy signal – after a reversal bulge in the Mass Index, if the price crosses above the 9-day EMA. This indicates that the price is gaining upward momentum, suggesting a buy opportunity, as the market may be entering an upward trend.
-
Sell signal – after a reversal bulge in the Mass Index, if the price crosses below the 9-day EMA. This signals that the price is weakening and could be entering a downtrend, suggesting a sell opportunity.
-
Stop-loss placement – placing a stop loss just below recent support levels or the moving average helps protect against losses if the market moves against a bullish signal from the Mass Index. Conversely, a stop loss is typically set just above recent resistance levels or the moving average to buffer against unexpected upward movements following a bearish signal from the Mass Index.
-
Confirming trades – traders often enhance their decision-making by using the MI alongside other technical indicators, such as the Simple Moving Average (SMA), to confirm potential reversal signals. Also, a confirmation from the Relative Strength Index (RSI) indicating the oversold or overbought conditions can strengthen the signal derived from the Mass Index.
Note
You can take advantage of algo trading, with cBots executing trades based on the signals from this indicator, as shown in our examples. Learn more about how to use indicators in cBots.
Limitations
Since the Mass Index does not specify the direction of market movement, it is recommended to use it in conjunction with other indicators to confirm potential reversal signals (see application section). In strongly trending markets, the Mass Index may not provide valuable signals, as it focuses more on volatility rather than the direction of the trend.
Summary
The Mass Index indicator is designed to detect potential trend reversals by measuring the range between the high and low prices over time. It is a volatility-based indicator that focuses on the expansion and contraction of price ranges, without providing directional signals. Traders often look for specific patterns, such as a reversal bulge, where the index rises above a certain value (such as 27) and then falls back below a threshold (such as 26.5), signalling a potential reversal in the current price trend.