Momentum Oscillator
Definition
The Momentum Oscillator (MO) is a technical indicator that measures the speed or rate of a price change over a specified period of time. It compares the current price to the price from a previous period, helping identify overbought or oversold conditions. Traders use it to detect trend strength and potential reversals by analysing the oscillator crossing points with a moving average or specific thresholds.


History
The class of momentum indicators includes at least 20 technical indicators. The basic idea behind all these indicators, applied to financial markets by analysts in the 1960s and 1970s, is rooted in the concept of inertia, where prices in motion tend to stay in motion unless acted upon by external forces (reflecting Newton's First Law). Though the exact originator of the Momentum Oscillator formula is not well-documented, this indicator has become a staple of technical analysis for its simplicity and ability to highlight price acceleration or deceleration, making it useful for trend-following strategies.
Calculations
The Momentum Oscillator is calculated as the most recent closing price divided by the closing price from a previous period, then multiplied by 100:
\[ MO = { { {ClosePrice\ (today)} \over ClosePrice\ (n\ periods\ ago) } \times 100 } \]
\(ClosePrice\) (\(today\)) – the current closing price
\(ClosePrice\) (\(n\) \(periods\) \(ago\)) – the closing price \(n\) periods ago
\(n\) – the number of periods
Interpretation
The Momentum Oscillator is calculated using a 14-day lookback by default, but other periods can be adjusted based on the strategy. The main patterns of the indicator behaviour can be interpreted as follows:
-
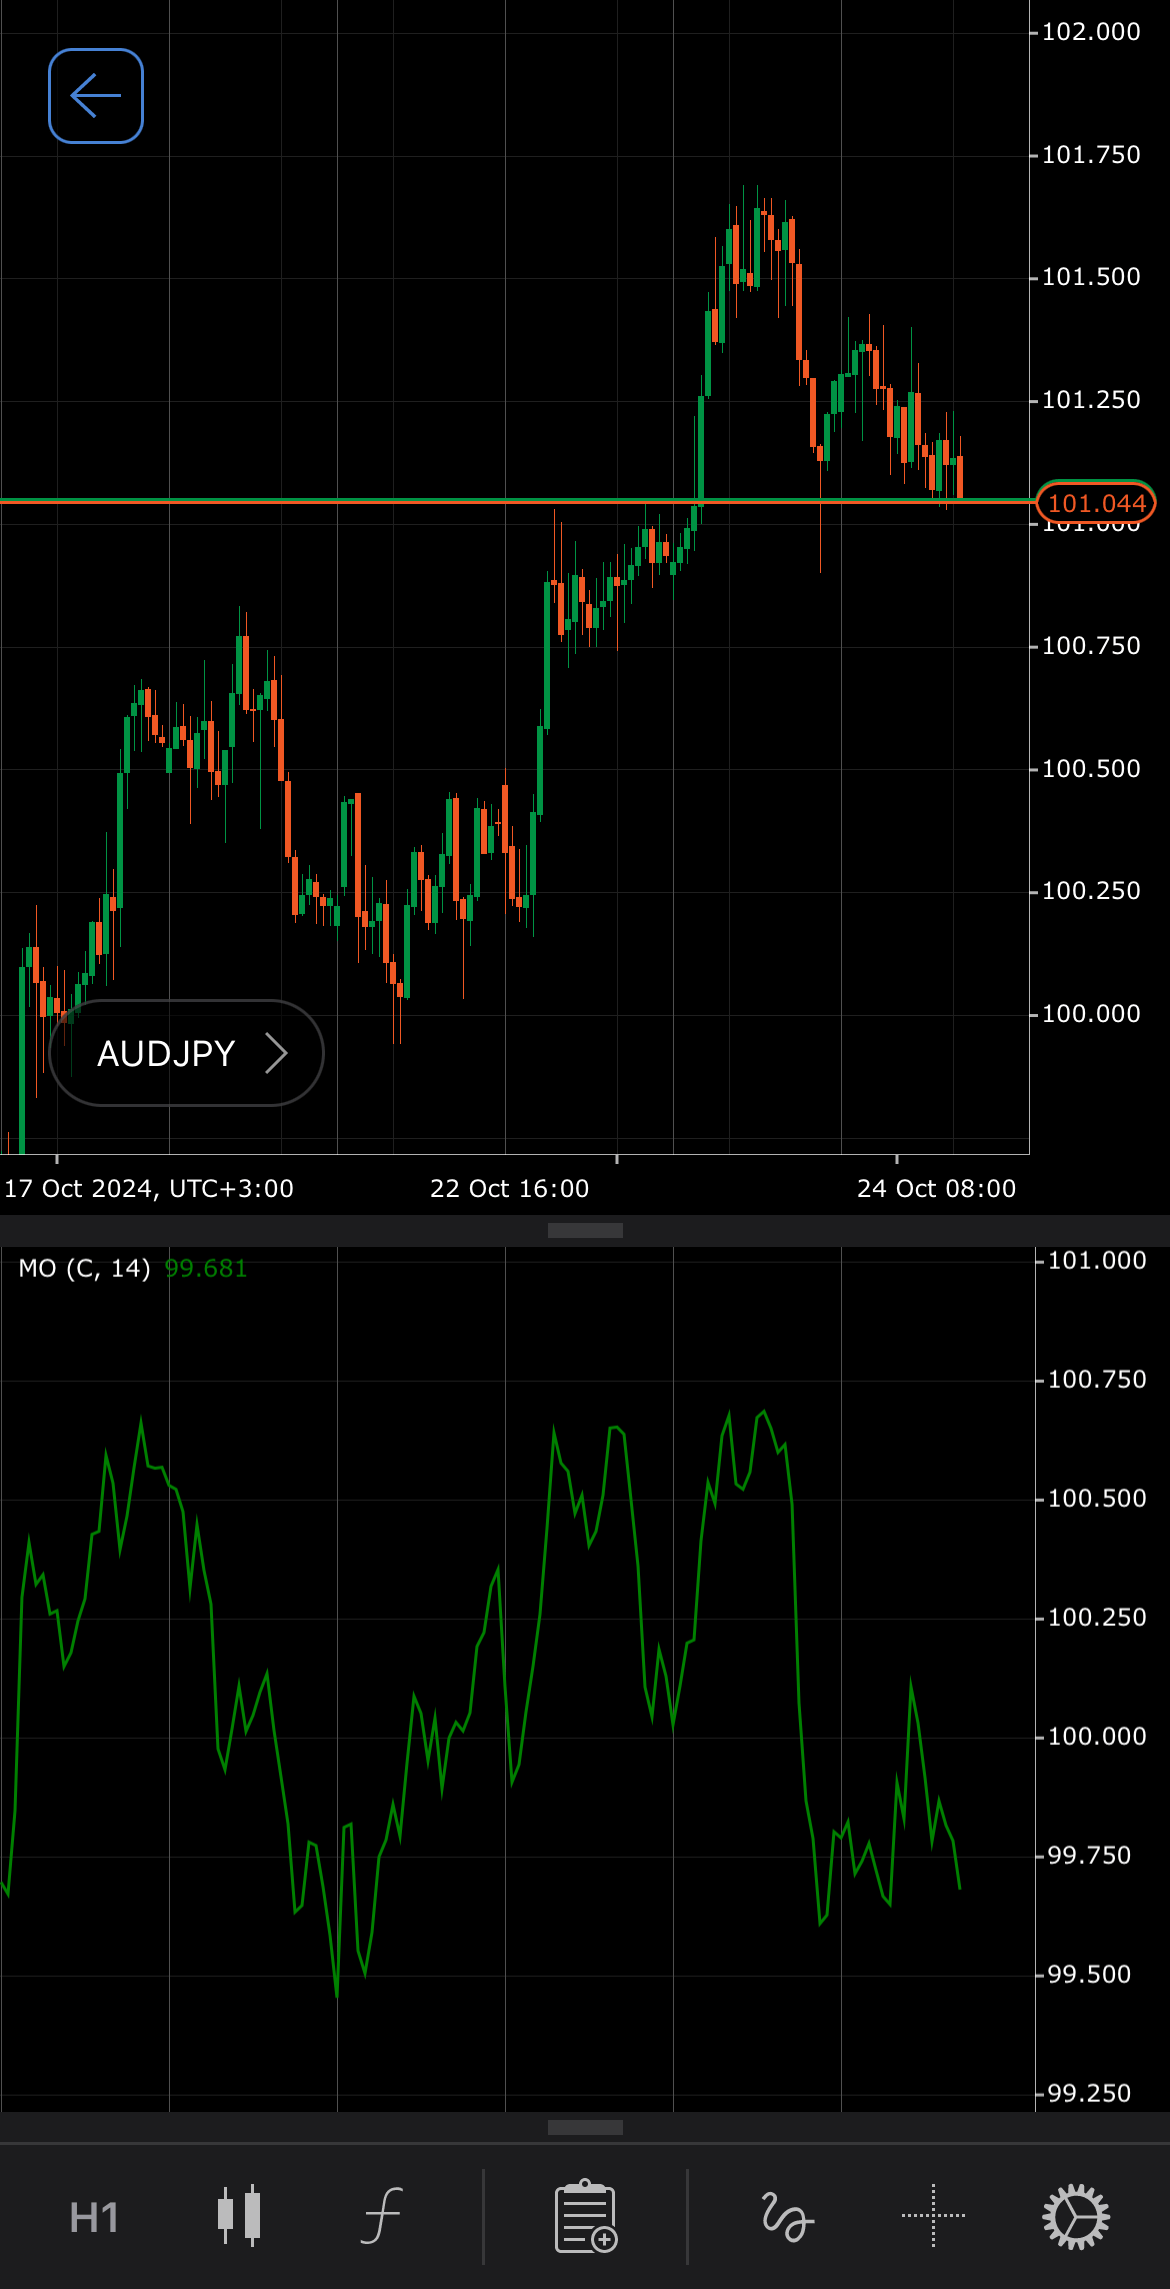
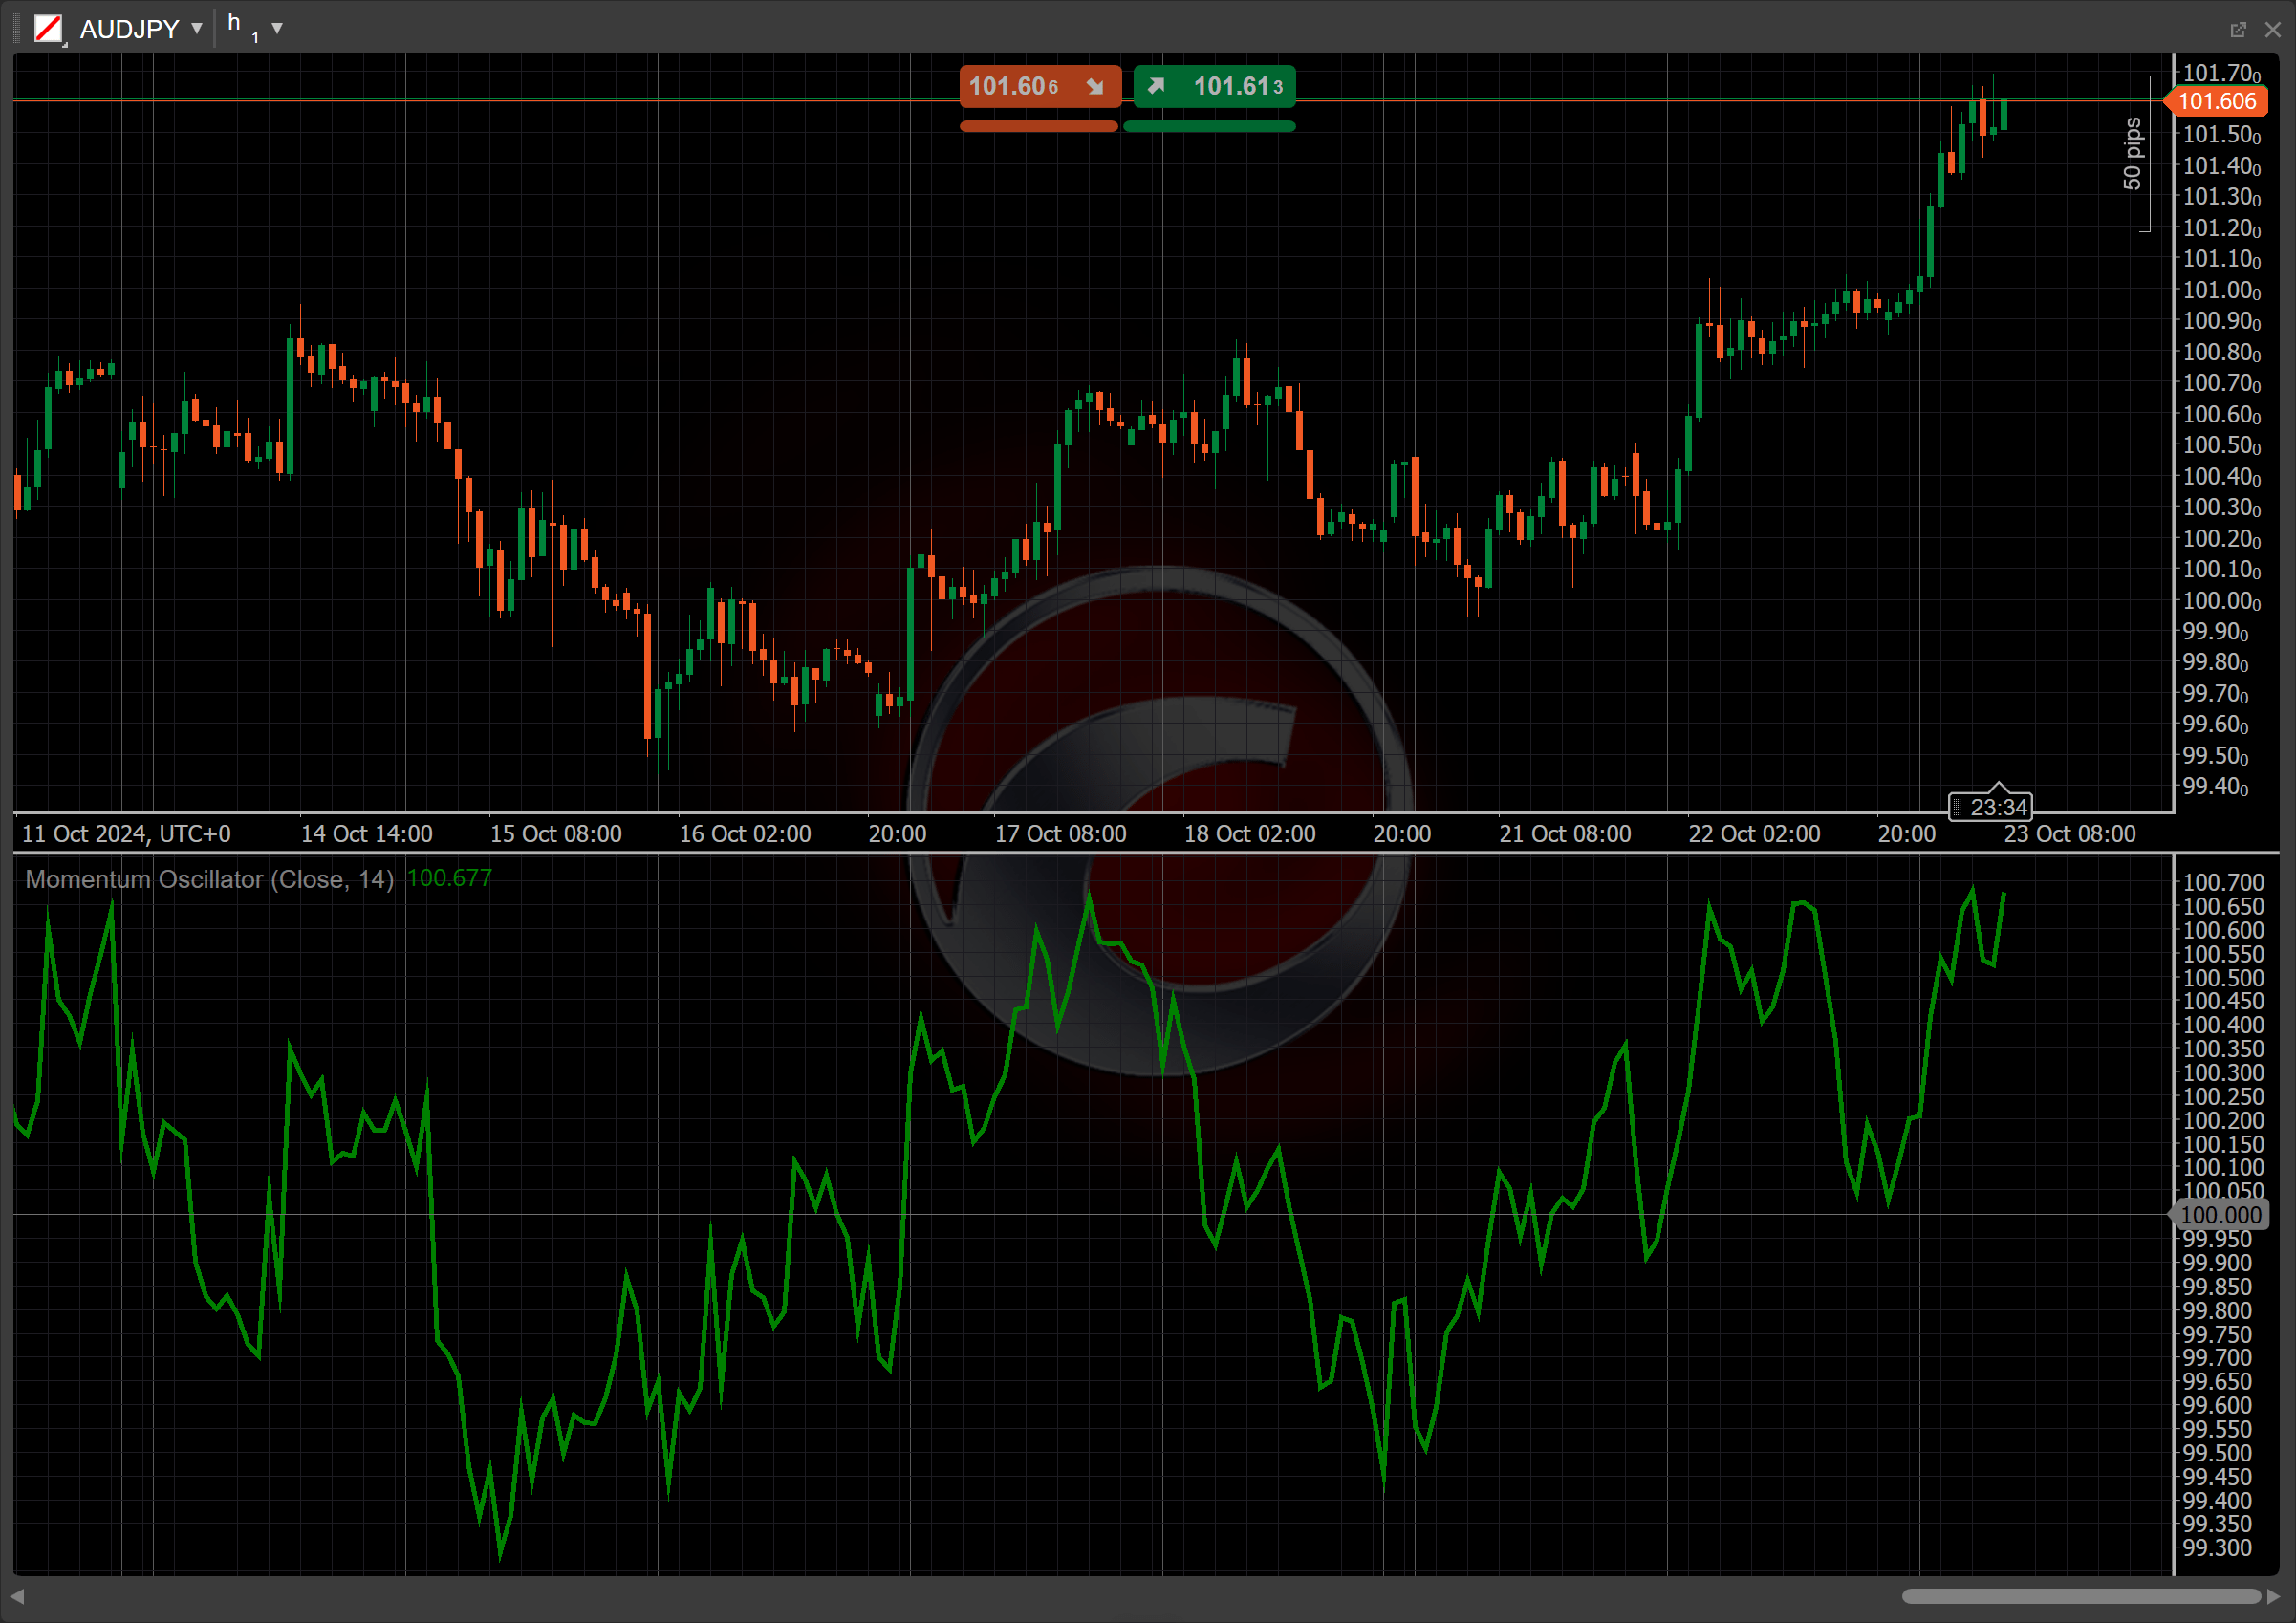
Crossovers – the oscillator returns values centred around 100. Values above 100 indicate upward momentum, while values below 100 show downward momentum.
-
Divergence – if the price is making new highs while the Momentum Oscillator does not, this bearish divergence can indicate a potential reversal to the downside. Conversely, if the price makes new lows while the MO does not, this bullish divergence can signal a potential reversal to the upside.
Application
-
Buy signal – traders can consider entering a buy position when the oscillator crosses above a certain threshold (100 by default) and shows rising momentum, indicating strong bullish strength.
-
Sell signal – traders can consider entering a sell position when the oscillator crosses below a certain threshold and displays falling momentum, suggesting bearish pressure in the market.
-
Stop-loss placement – for buy trades, it is recommended to set a stop loss below support levels where the oscillator shows weakening momentum. For sell trades, traders usually place a stop loss above resistance levels with a declining oscillator.
-
Exit strategies – consider exiting when a divergence occurs between the price movement and the oscillator, as this suggests a potential reversal.
-
Confirming trades – while using the oscillator to confirm trade entries check for divergence or convergence with price trends. If the indicator moves in tandem with price (both rising or falling), it reinforces the trade validity. Conversely, if there is divergence (price making new highs or lows while the oscillator does not), be cautious, as it may indicate a reversal.
-
Combining indicators – for effective trend confirmation, use the Simple Moving Average (SMA) of the MO indicator. Consider entering buy positions when the MO crosses above the SMA, showing rising momentum, and sell position when the MO drops below the SMA, indicating weakening momentum.
Note
You can take advantage of algo trading, with cBots executing trades based on the signals from this indicator, as shown in our examples. Learn more about how to use indicators in cBots.
Limitations
The Momentum Oscillator has limitations, including lagging signals due to its reliance on past prices, which can lead to delayed entries or exits. It may also produce false signals during volatile or sideways markets, where price action does not reflect true momentum. Additionally, the indicator can struggle in trending markets if used in isolation, as it may not capture the full market context.
Summary
The Momentum Oscillator is an indicator used in technical analysis to assess how quickly a symbol price is changing over a defined period, with the most frequent value of 14. By evaluating the current price against a prior price, the oscillator helps identify whether the market is experiencing bullish or bearish momentum. Also, the indicator signals buying or selling opportunities through crossovers and divergences with price movements.