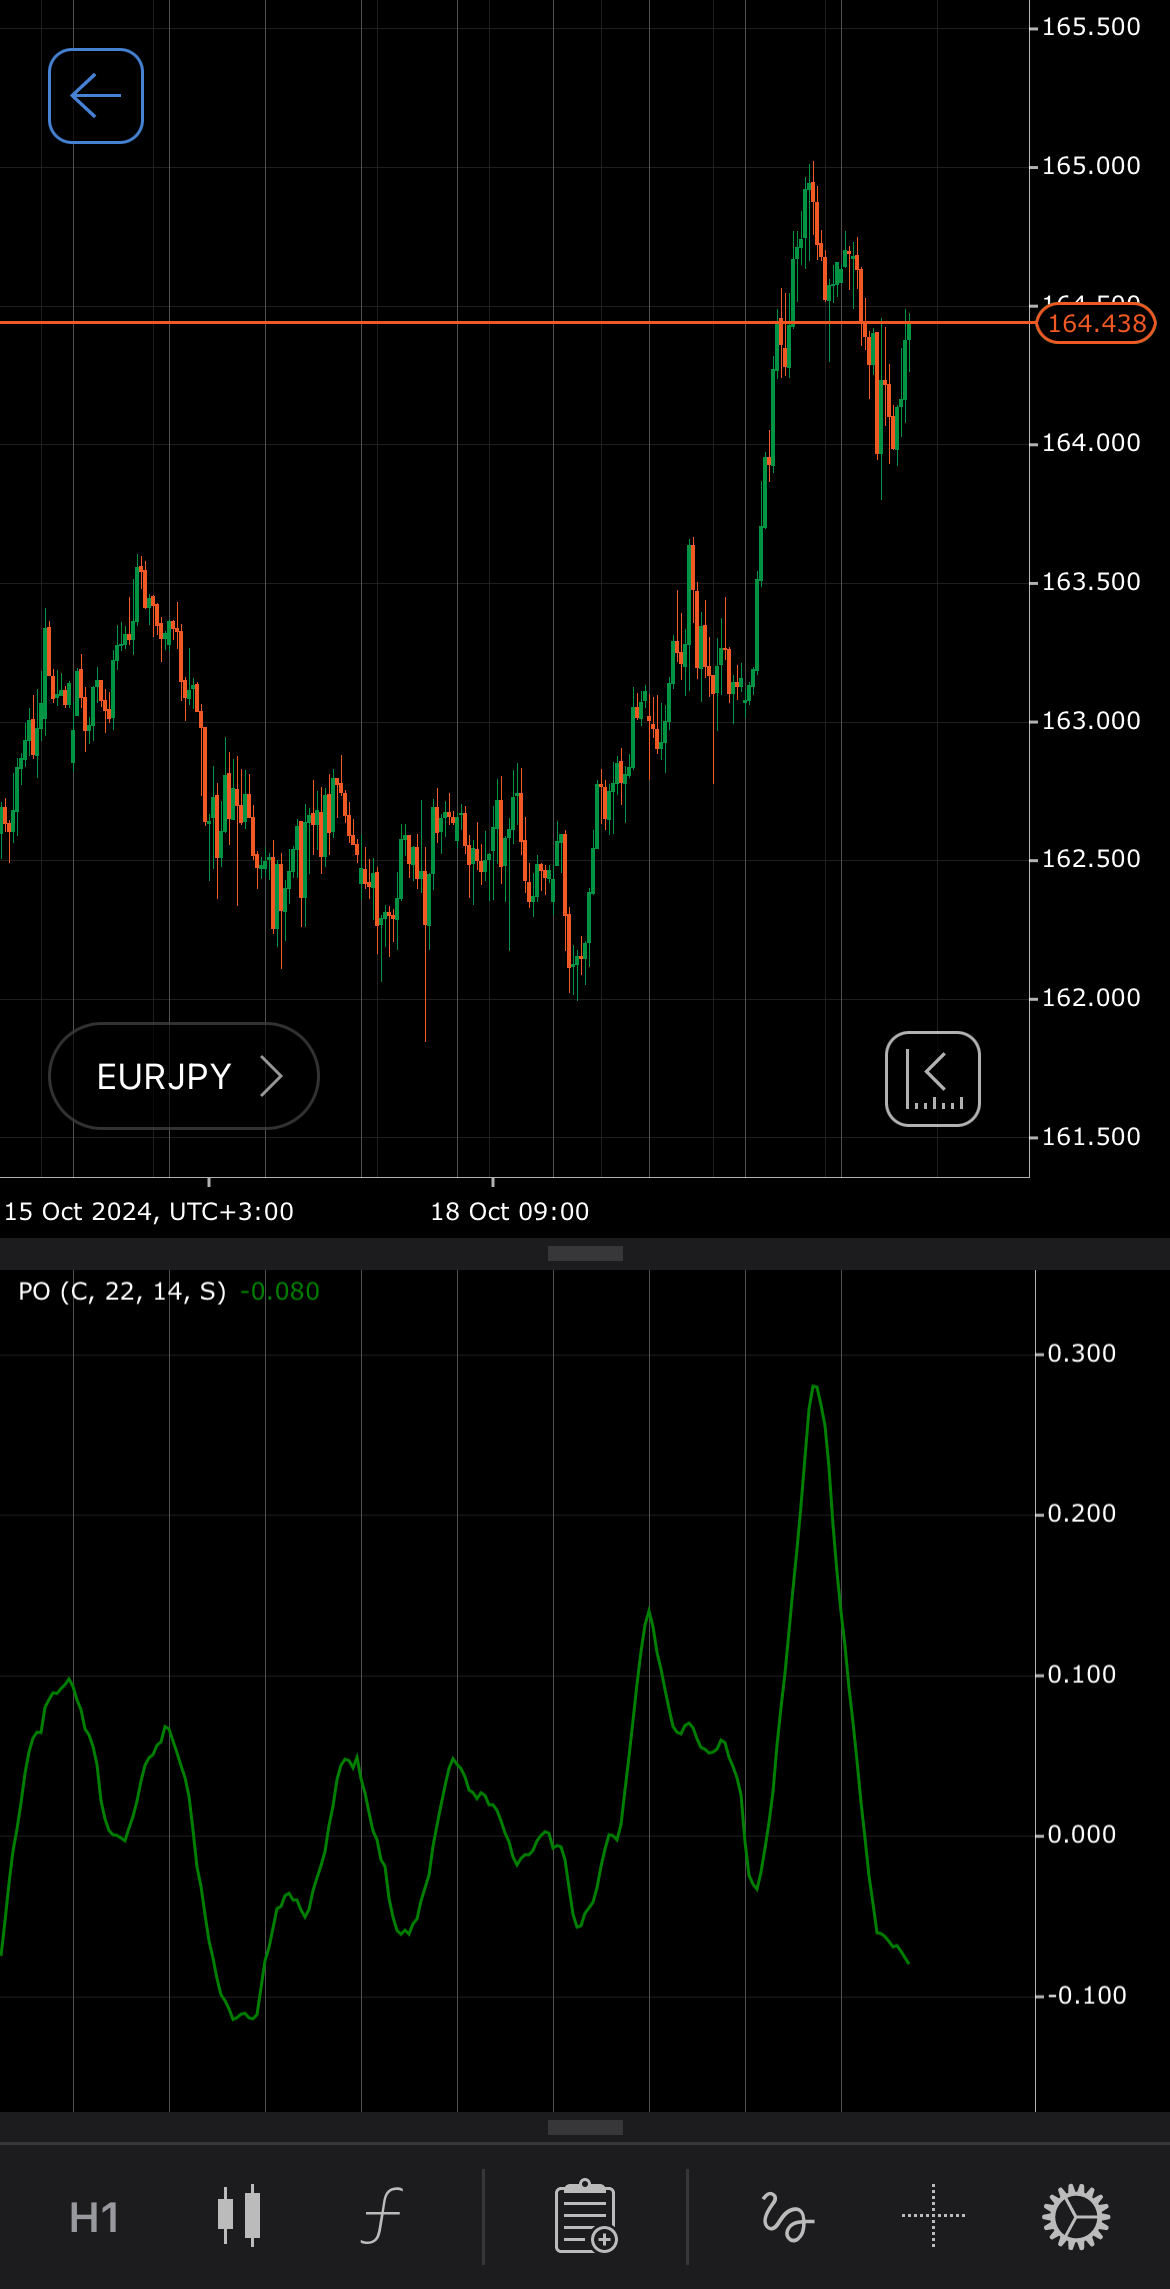
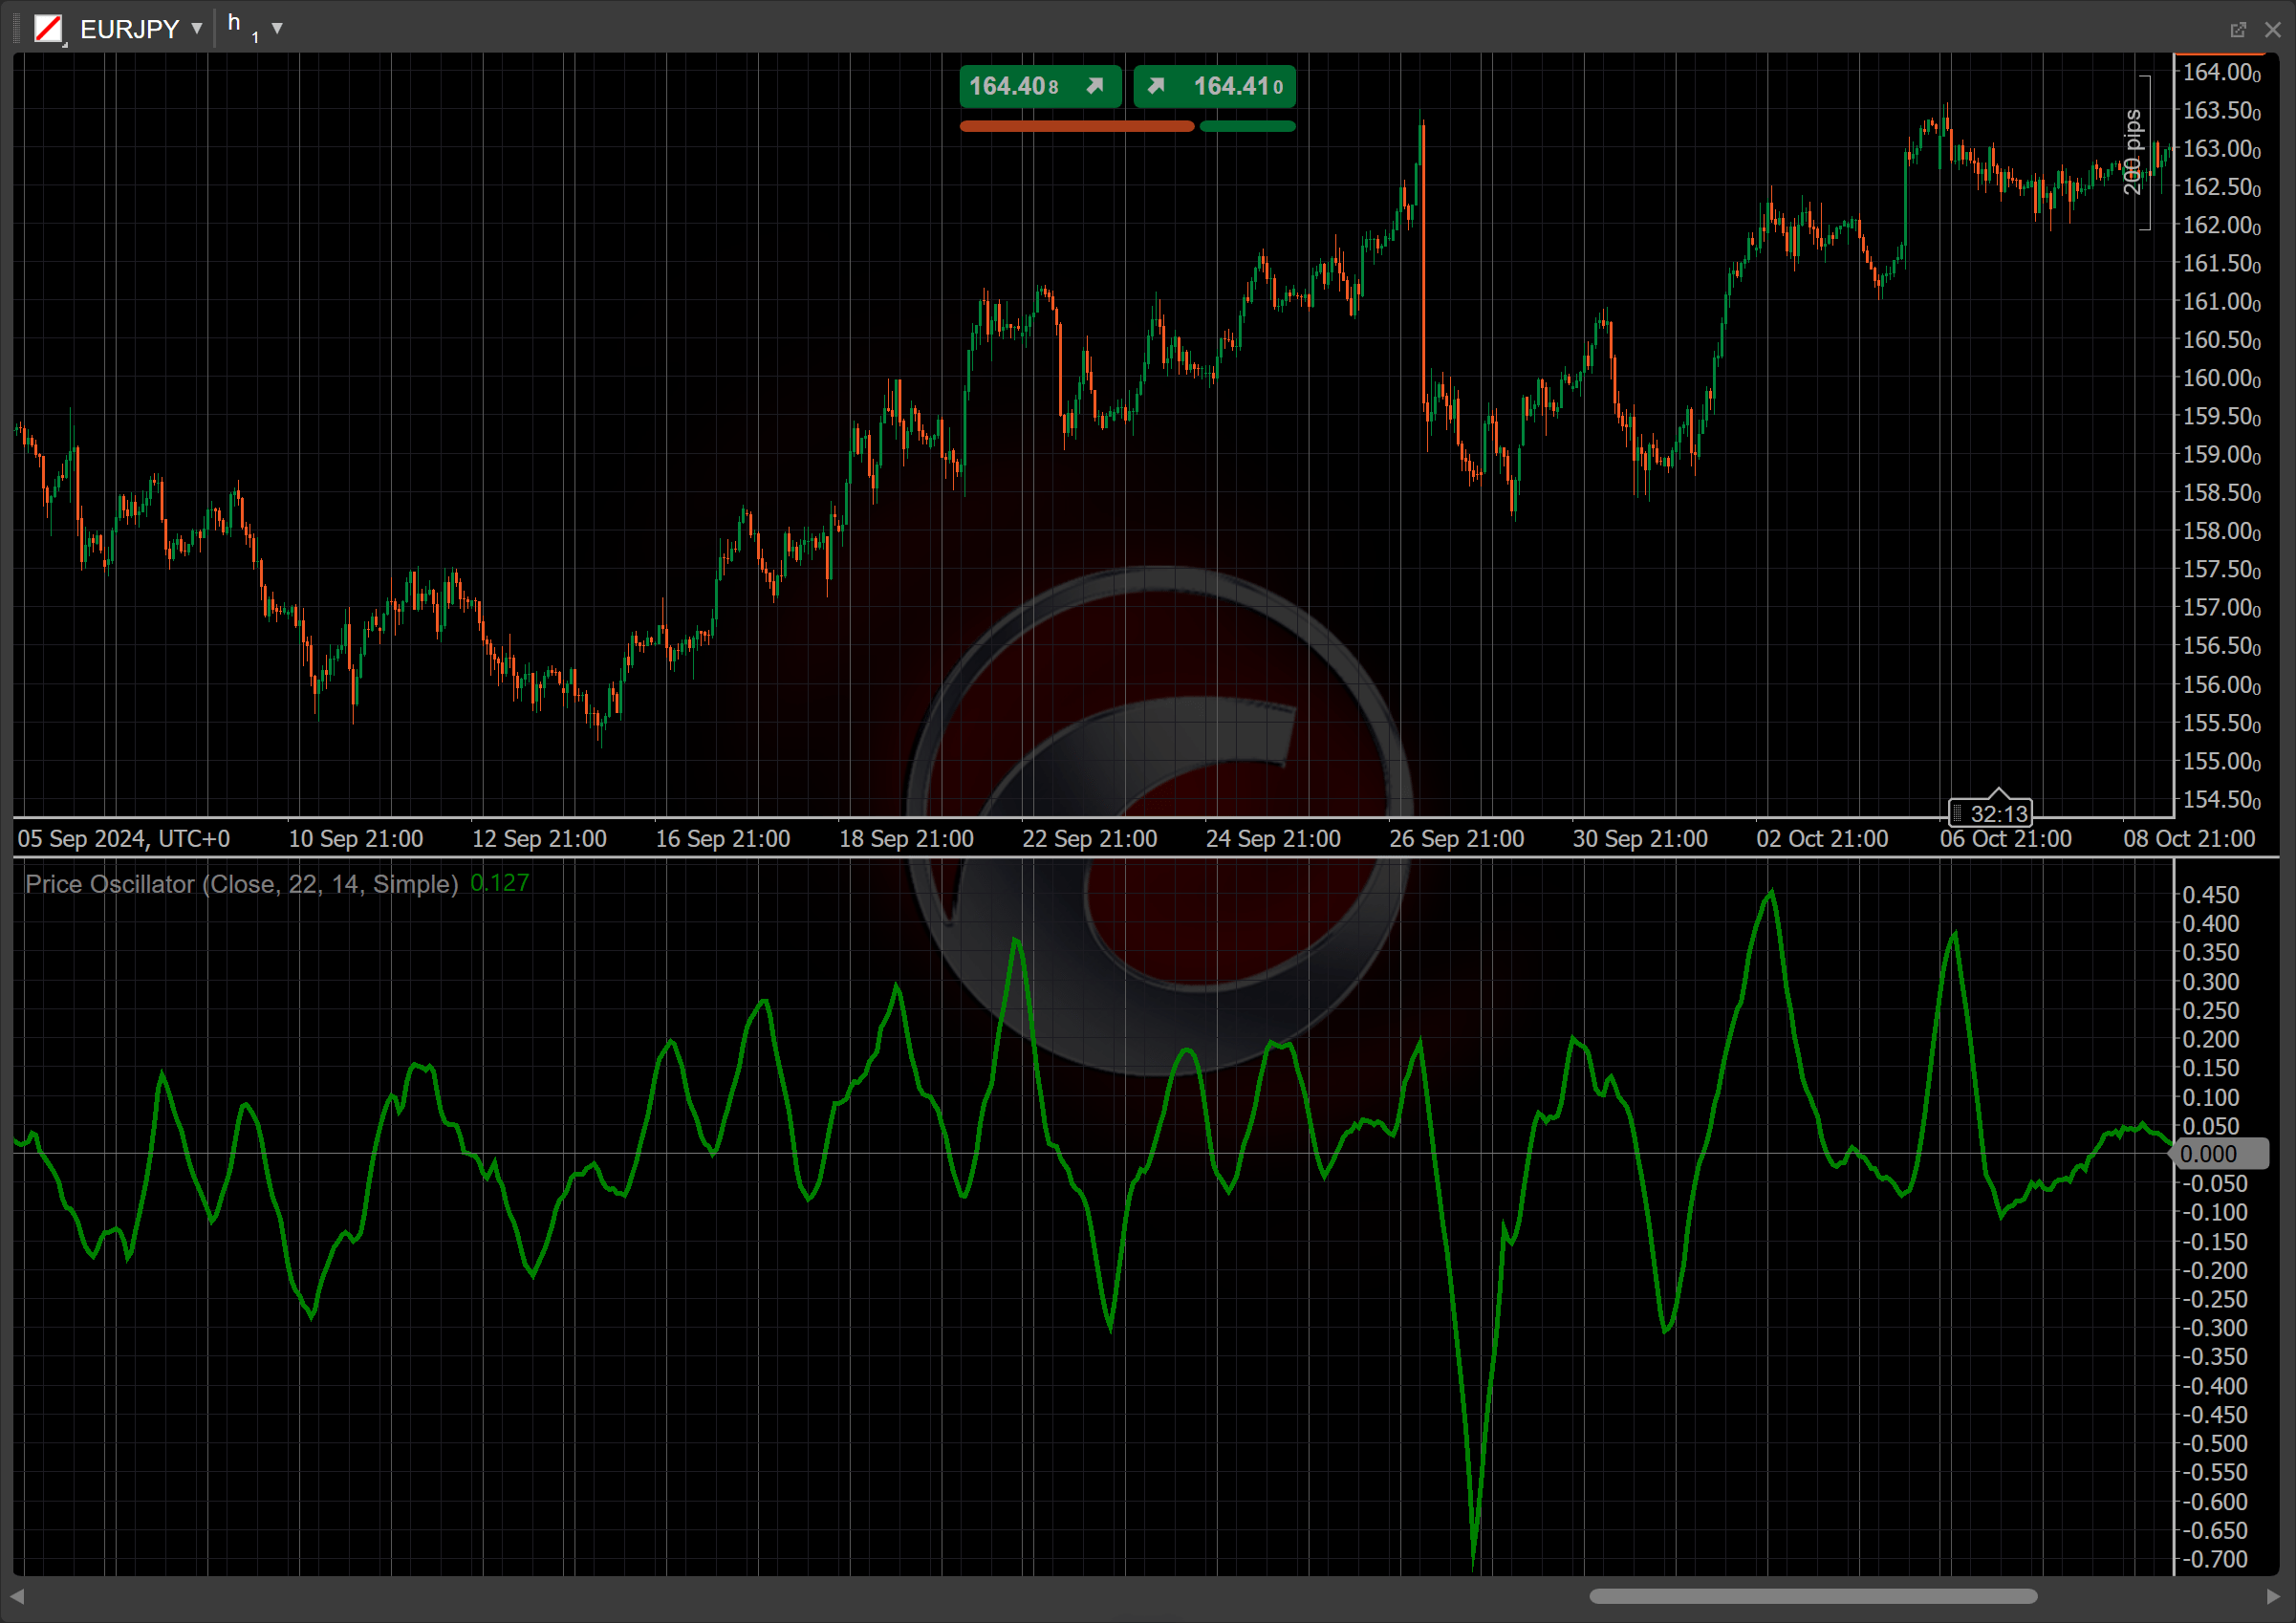
Price Oscillator
Definition
The Price Oscillator or the Percentage Price Oscillator (PPO) is a technical indicator designed to measure the relationship between two moving averages of a symbol price, helping traders identify price trends, assess momentum, and determine potential entry and exit points. This oscillator visualises the difference between short-term and long-term moving averages, providing insights into momentum shifts and potential reversals in price direction.


History
While the exact origin of the Price Oscillator is less defined than some other indicators, it has gained recognition through its utility in a broader analysis of market momentum. The oscillator is widely used among traders across various markets, including stocks, commodities and forex, for its ability to identify bullish and bearish momentum shifts and potential entry and exit points in trading strategies.
Calculations
The Price Oscillator is calculated using the following formula:
\[ Price\ Oscillator = { { { MA_{fast} - MA_{slow} } \over MA_{slow} } \times 100 } \]
\(MA_{fast}\) – the moving average calculated over the fast period
\(MA_{slow}\) – the moving average calculated over the slow period
Interpretation
The Simple Moving Average serves as the default type of moving average; however, traders can select a specific type from all the MA types available for analysis. In our particular case, a 22-day period for the short-term SMA and a 9-day period for the long-term SMA are used.
The following interpretations of the indicator are generally applicable:
-
Zero-line crossovers – when the PPO crosses above the zero line, it signals a potential bullish trend, suggesting that the short-term moving average is gaining strength relative to the long-term moving average. Conversely, when the PPO crosses below the zero line, it indicates a potential bearish trend.
-
Rising and falling – a rising PPO indicates increasing bullish momentum, suggesting that the price is likely to continue rising. Conversely, a falling oscillator suggests decreasing bullish momentum or increasing bearish momentum, signalling a potential decline in price.
-
Divergence – if prices are making new highs but the oscillator is making lower highs, this could indicate weakening momentum and a potential reversal. Conversely, convergence occurs when the oscillator aligns with price movements, confirming the prevailing trend.
-
Reversal points – potential reversal points can be identified when the PPO shows signs of divergence from the price action. If the oscillator indicates a loss of momentum while prices continue to rise, this may suggest an upcoming reversal.
Application
-
Buy signal – when the PPO crosses above the zero line, indicating that the short-term moving average is gaining momentum relative to the long-term moving average, it suggests a potential bullish trend and may prompt traders to enter a long position.
-
Sell signal – when the PPO crosses below the zero line, indicating that the short-term moving average is weakening compared to the long-term moving average, it suggests a potential bearish trend and signals traders to consider entering a short position.
-
Stop-loss placement – by placing a stop loss slightly below the swing low for buys and above the swing high for sells, traders can protect their capital while allowing for normal price fluctuations.
-
Exit strategies – consider closing positions when the Price Oscillator crosses back below the zero line for long positions or above the zero line for short positions. Additionally, you can look for divergence between the oscillator and price action as a potential exit signal, indicating weakening momentum.
-
Confirming trades – when the Price Oscillator crosses above zero with the price above the moving average, it signals a strong bullish trend, suggesting a buy opportunity. Conversely, a cross below zero indicates a sell opportunity. Combining it with the Relative Strength Index (RSI), a buy signal in oversold territory (below 30) suggests an upward reversal, while a sell signal in overbought territory (above 70) suggests a downward reversal.
Note
You can take advantage of algo trading, with cBots executing trades based on the signals from this indicator, as shown in our examples. Learn more about how to use indicators in cBots.
Limitations
The Price Oscillator may generate false signals, particularly in volatile markets where price swings can lead to erratic crossovers. It primarily focuses on moving averages, which can lag behind current price action, causing delayed responses to trends. Additionally, it may not perform well in sideways markets, where it can produce misleading signals.
Summary
The Price Oscillator measures the difference between two moving averages of a symbol price, helping traders identify momentum and potential trend reversals. It generates buy signals when crossing above the zero line and sell signals when crossing below. The oscillator is valuable for spotting bullish and bearish trends, with rising values indicating increasing bullish momentum and falling values suggesting bearish conditions. It is recommended to use the Price Oscillator in conjunction with other indicators, such as the RSI or moving averages, to confirm signals and enhance trading strategies.