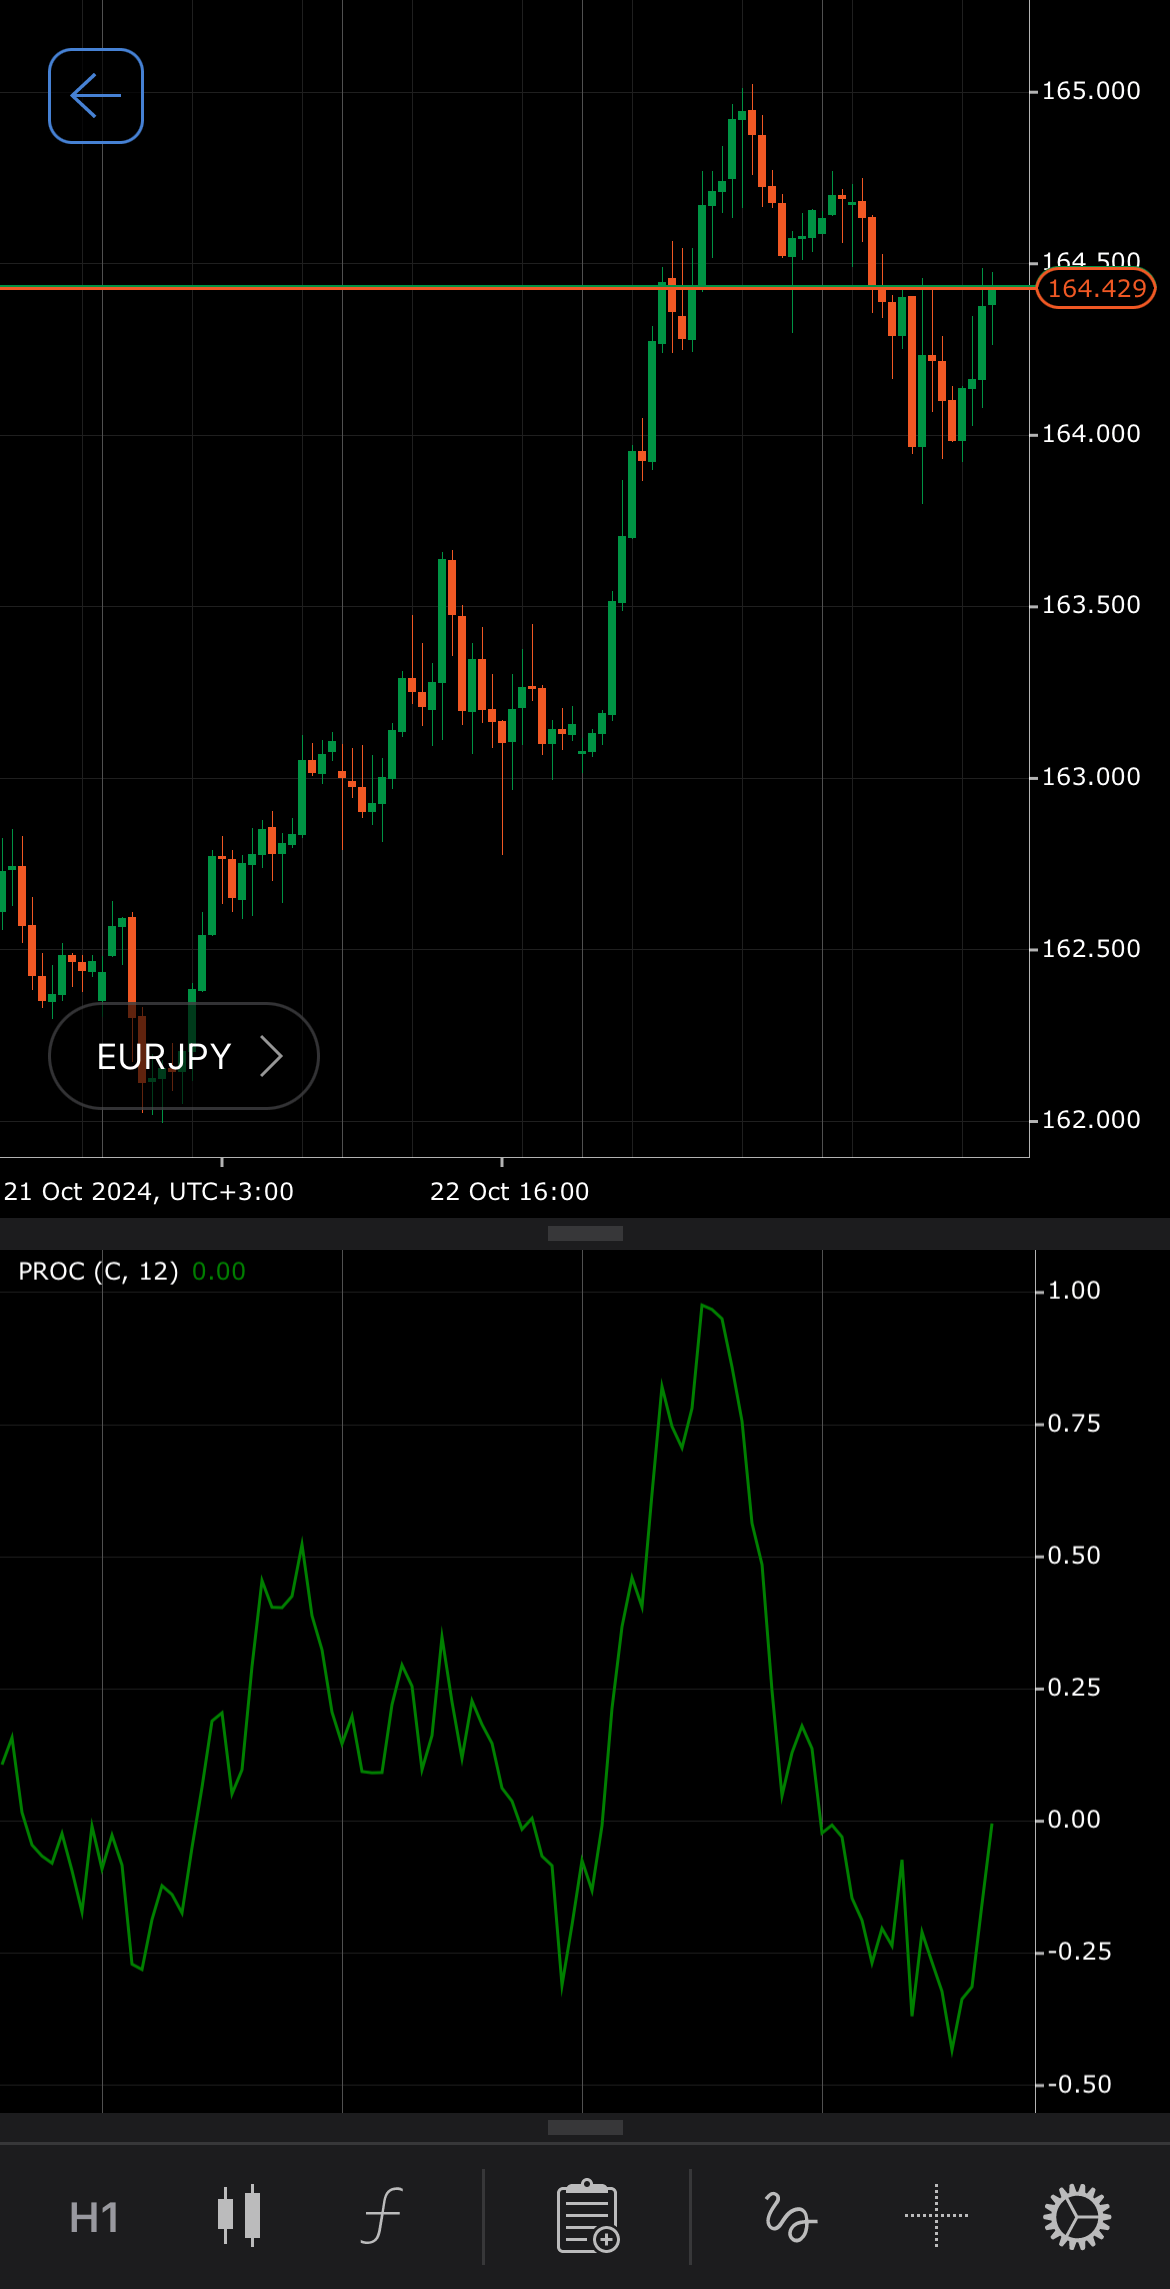
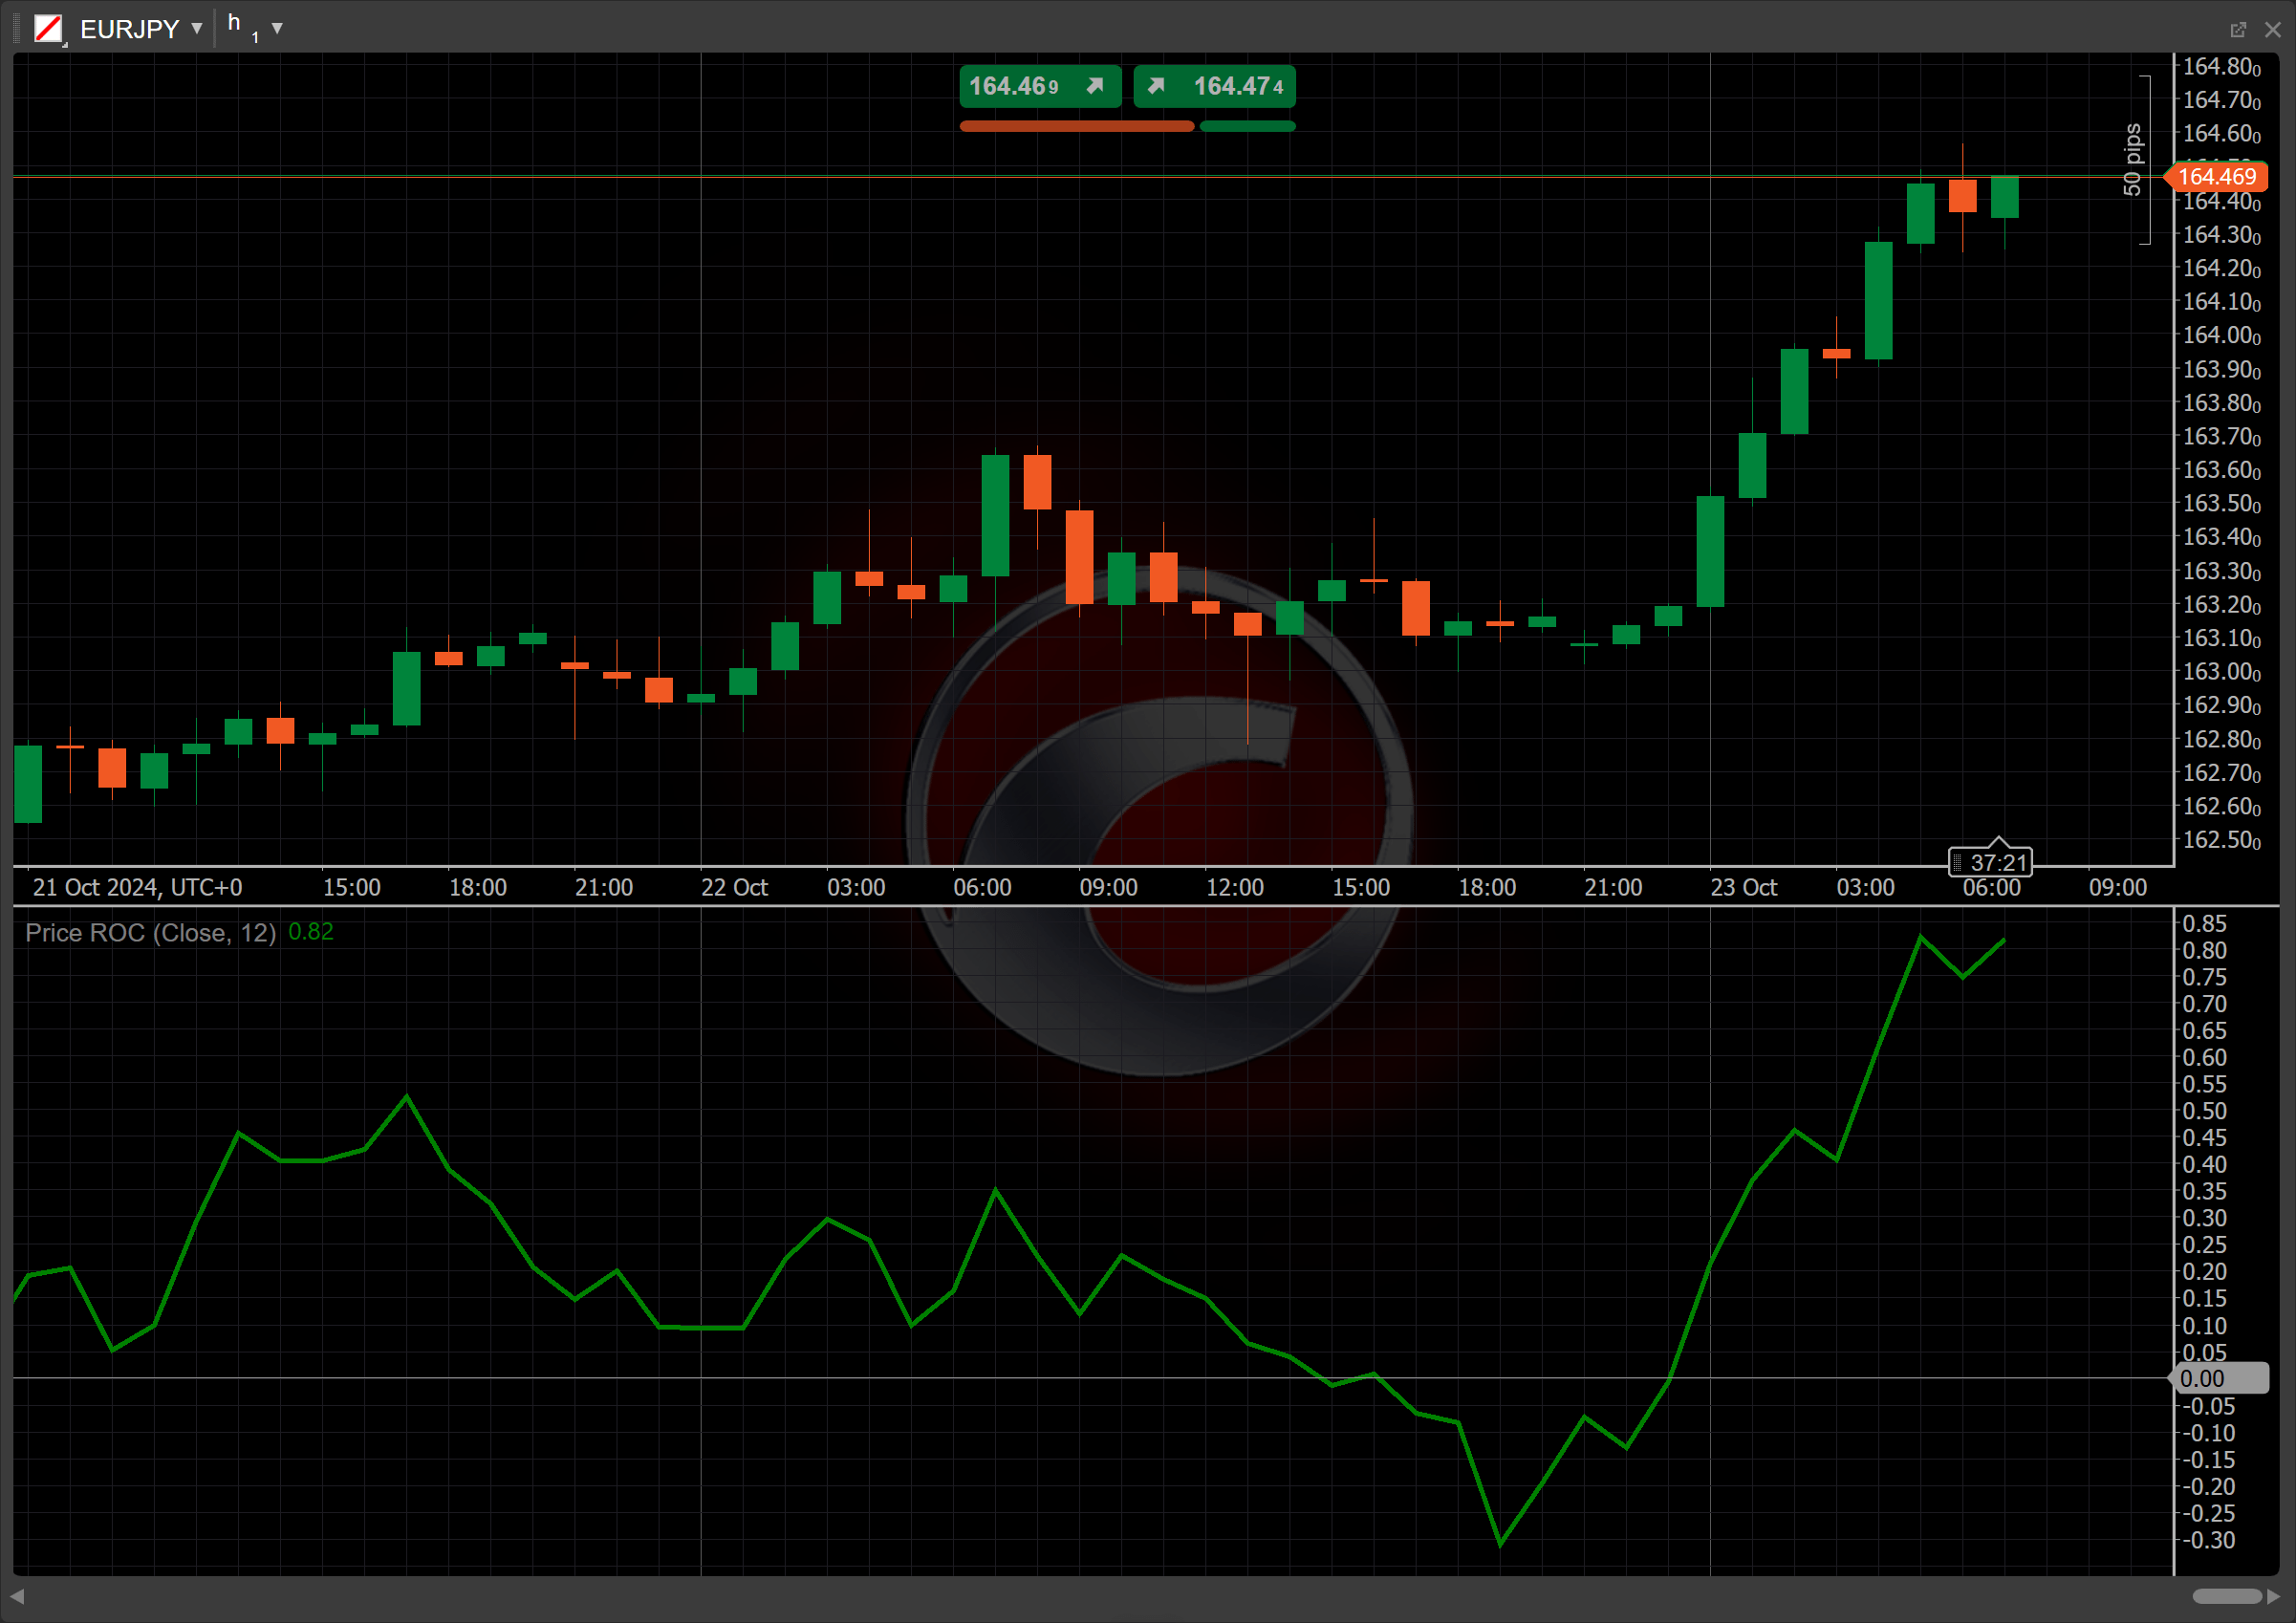
Price ROC
Definition
The Price Rate of Change (ROC) indicator measures the percentage change in price over a specific period. It compares the current price to the price from \(n\) periods ago, helping identify the strength and direction of momentum. A positive ROC suggests upward momentum, while a negative ROC indicates downward momentum, making it useful for trend confirmation and reversal signals.


History
The Price ROC has been a staple in technical analysis for decades, widely used by traders to assess market momentum. Although its exact origin is not attributed to a single creator like some other indicators, the Price ROC has evolved into a simple yet powerful tool for price analysis. It has gained prominence within the broader technical analysis community due to its ability to measure the speed at which prices change.
Calculations
The Price ROC is calculated using the following formula:
\[ ROC = { { { Close - Close\ n\ periods\ ago } \over Close\ n\ periods\ ago } \times 100 } \]
\(Close\) – the closing price of the current period
\(Close\) \(n\) \(periods\) \(ago\) – the closing price from n periods earlier
\(n\) – the lookback period
Interpretation
The Price ROC indicator is calculated using 12 periods by default, but other periods can be adjusted based on the strategy. The main patterns of the indicator behaviour can be interpreted as follows:
-
Zero-line crossovers – when the Price ROC crosses above the zero line, it signals positive momentum, suggesting the start of an uptrend or strengthening upward movement. When the Price ROC crosses below the zero line, it signals negative momentum, suggesting the start of a downtrend or strengthening downward movement.
-
Rising and falling – a rising ROC indicates increasing momentum in the direction of the trend (uptrend if above zero, downtrend if below zero). A falling ROC signals waning momentum, suggesting the trend may be losing strength, regardless of whether it is an uptrend or downtrend.
-
Divergence – bullish divergence occurs when the price is making lower lows while the Price ROC is making higher lows, suggesting a potential reversal to the upside. Bearish divergence occurs when the price is making higher highs while the Price ROC is making lower highs, suggesting a potential reversal to the downside.
-
Reversal points – significant swings in the Price ROC, especially after extended periods of extreme positive or negative values, can indicate potential reversal points in the price trend.
Application
-
Buy signal – when the Price ROC crosses above zero, showing positive momentum and the start of an uptrend, consider buying. Traders often enter positions at this point, anticipating further price increases based on the strength of the momentum.
-
Sell signal – when the Price ROC crosses below zero, it indicates negative momentum and the start of a downtrend, suggesting a sell opportunity. Traders may take short positions, expecting further price declines as momentum continues to shift downward.
-
Stop-loss placement – for buy positions, place a stop loss just below recent support levels to protect against sudden reversals. For sell positions, set a stop loss above recent resistance, ensuring limited risk in case of an upward price movement.
-
Exit strategies – consider exiting positions when the Price ROC shows signs of weakening momentum or crosses back toward zero. This can indicate a potential reversal or a slowdown in the current trend, prompting traders to lock in profits.
-
Confirming trades – it is recommended to combine the Price ROC with moving averages or trend indicators to confirm signals. For example, a buy signal from the Price ROC can be reinforced by a bullish crossover in a moving average, enhancing the reliability of the trade decision.
Note
You can take advantage of algo trading, with cBots executing trades based on the signals from this indicator, as shown in our examples. Learn more about how to use indicators in cBots.
Limitations
The Price ROC is a lagging indicator, which means it can delay responses to rapid price movements, resulting in missed opportunities. It can generate false signals during low volatility or choppy market conditions. Additionally, the Price ROC focuses solely on price changes and ignores volume, limiting its context. Its effectiveness is also highly dependent on the chosen lookback period, with shorter periods being noisy and longer periods potentially missing short-term trends.
Summary
The Price Rate of Change is a momentum oscillator that measures the percentage change in price over a specified period, helping traders assess market momentum. A positive ROC indicates upward momentum, while a negative ROC suggests downward momentum. Traders use it to identify potential buy and sell signals through zero line crossovers, rising or falling momentum, and divergence with price action.