Rainbow Oscillator
Definition
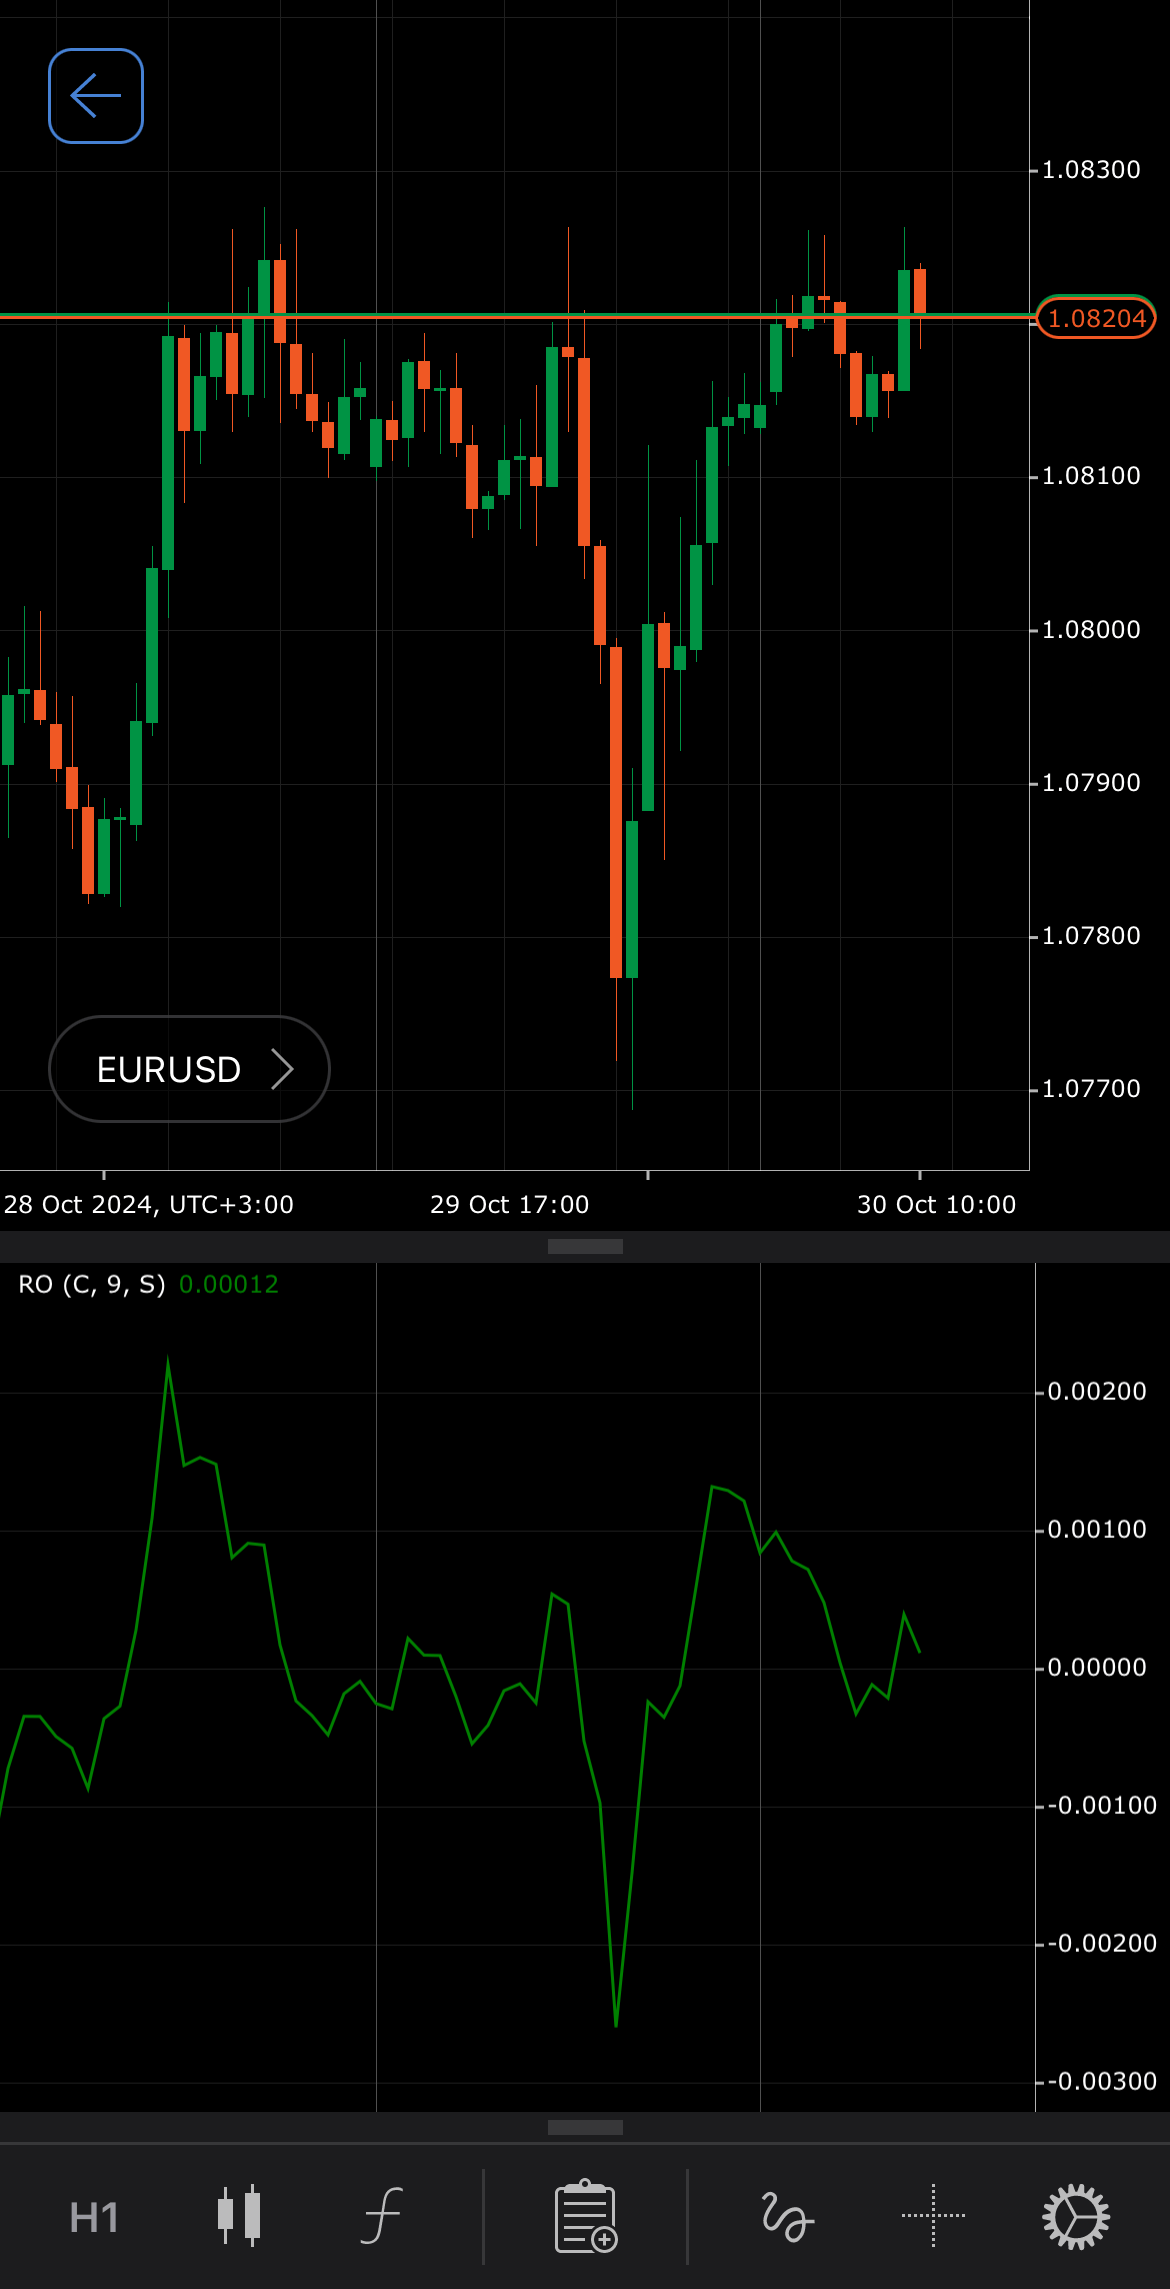
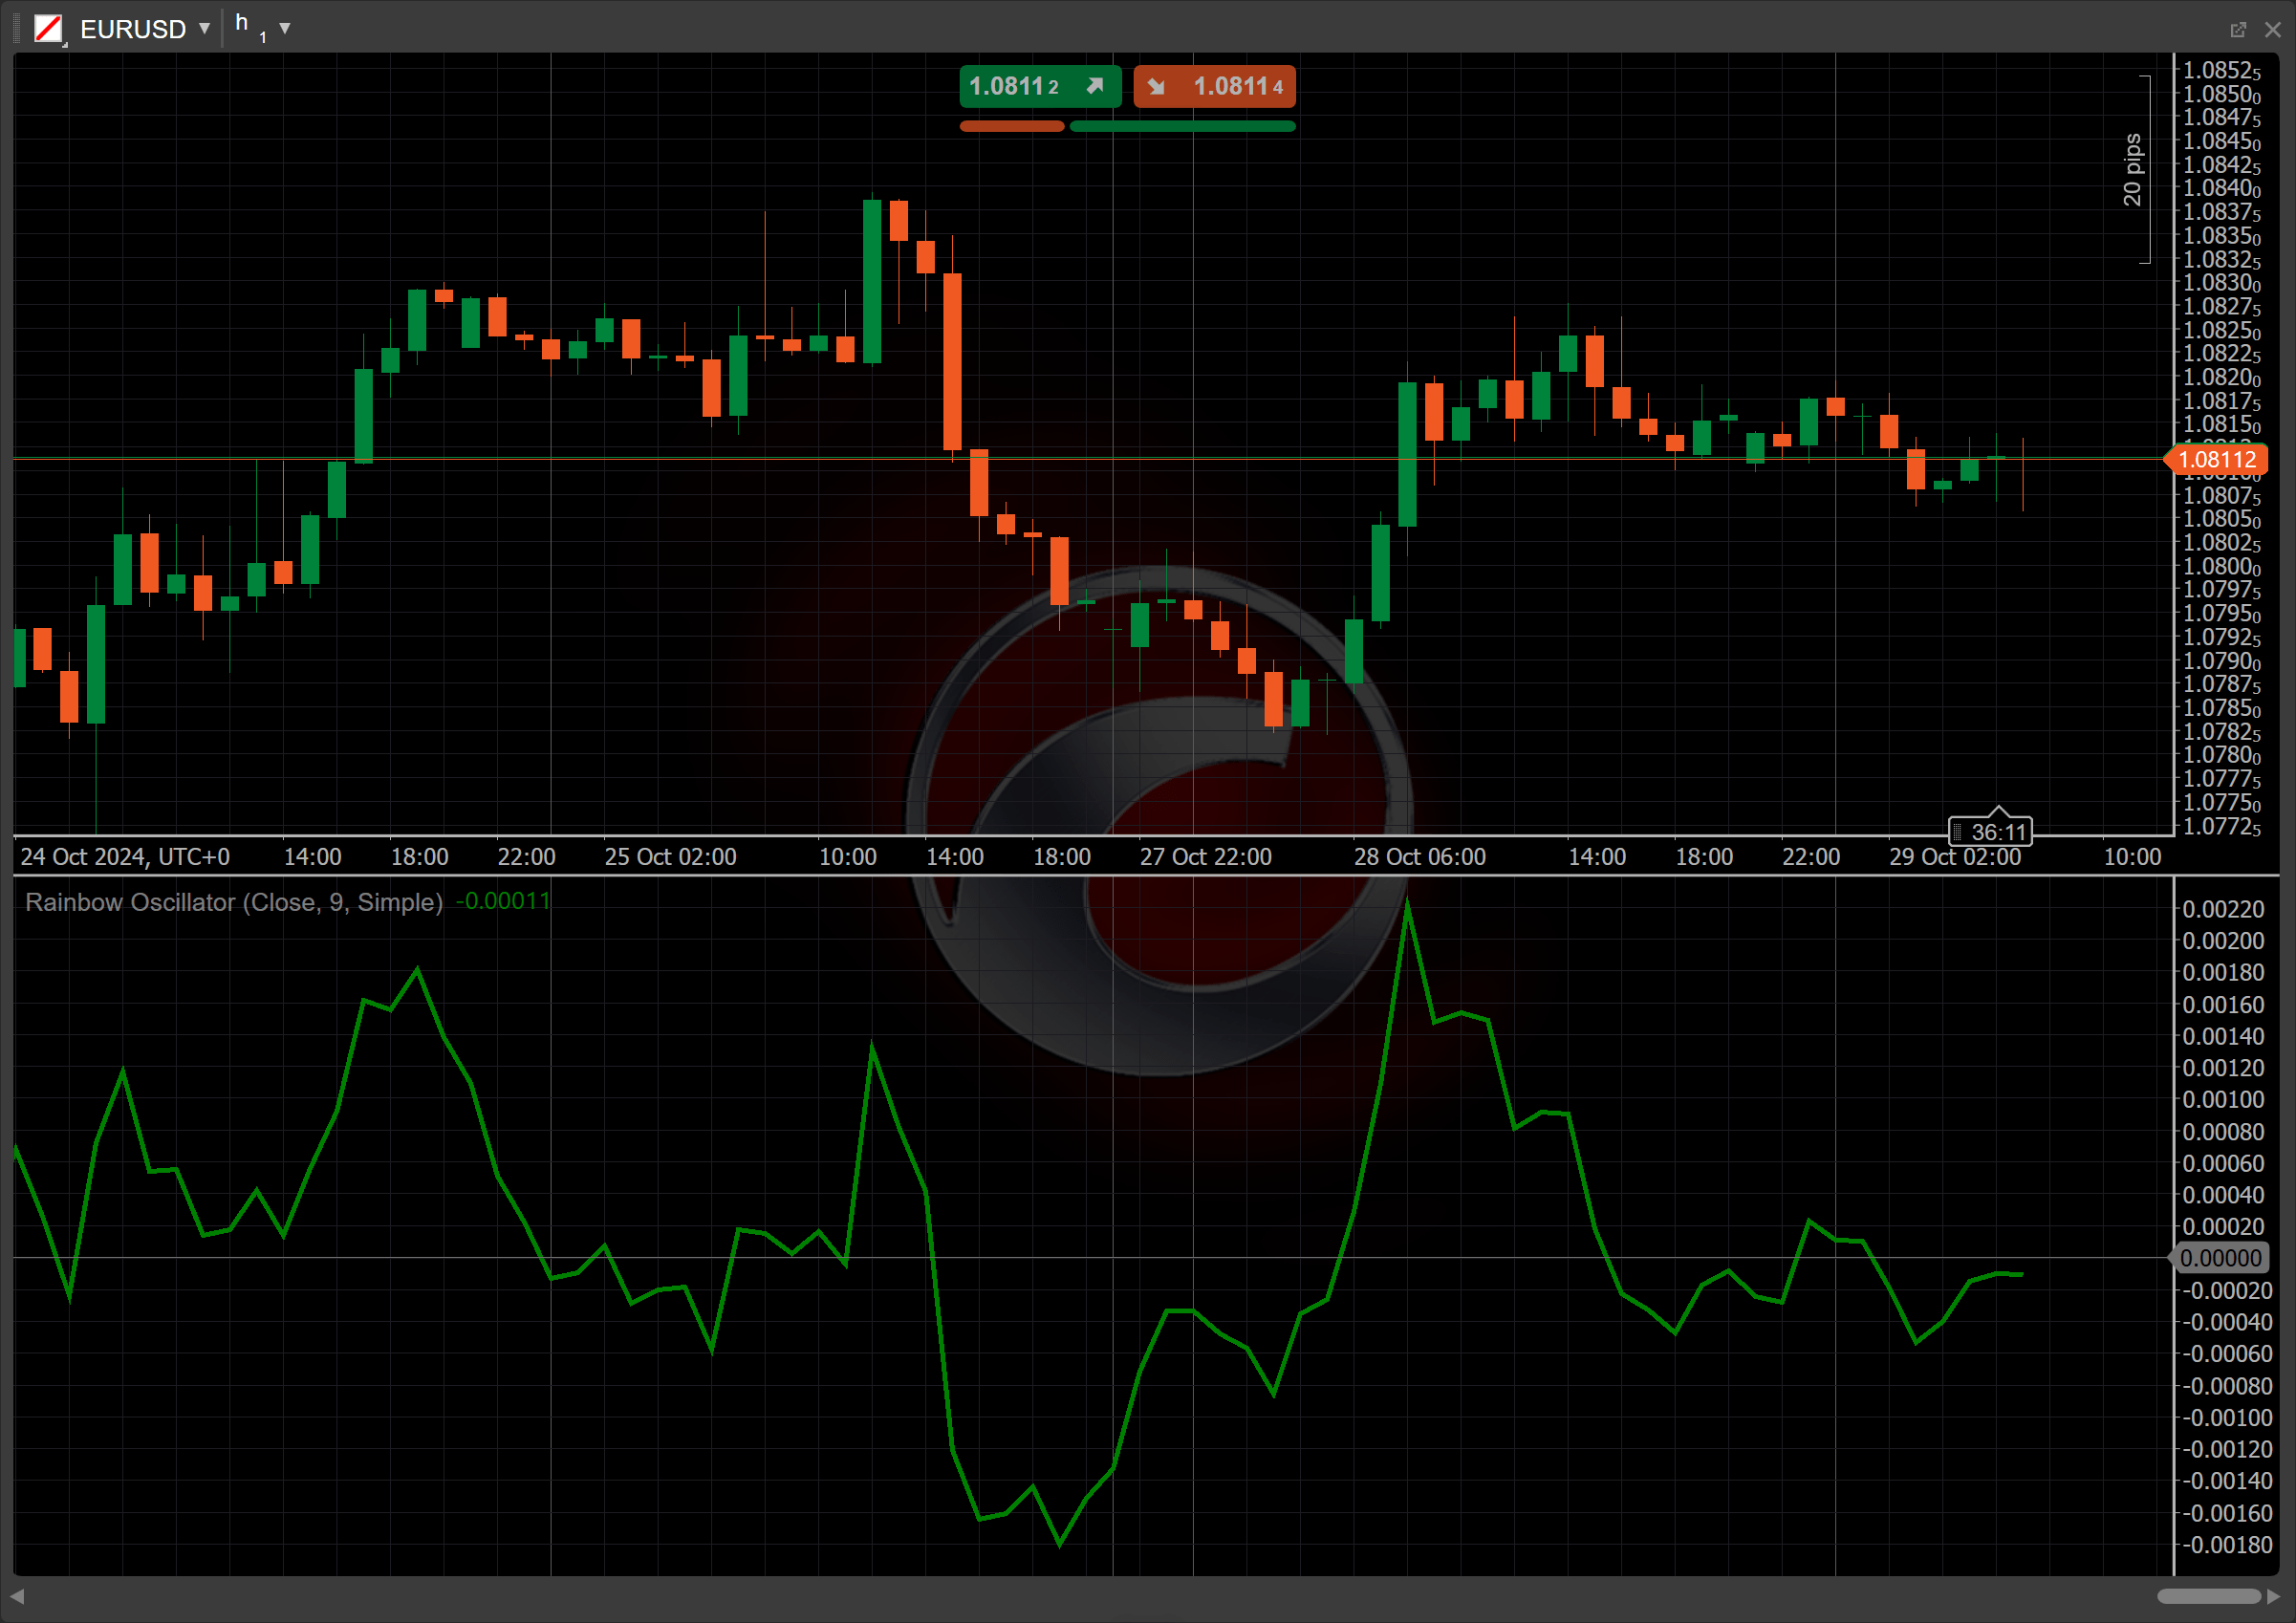
The Rainbow Oscillator (RO) is a technical indicator that smooths price data using multiple moving averages, typically applied to closing prices. It visualises market trends and identifies overbought or oversold conditions. Traders use it by observing crossovers between the oscillator and its moving average, signalling potential buy or sell opportunities based on price momentum shifts.


History
Mel Widner developed the RO indicator and described it in July 1997 in the issue of "Technical Analysis of Stocks and Commodities" magazine. The concept of the RO originates from the broader use of moving averages in technical analysis. It expands on the idea of smoothing out price data and identifying trends by incorporating multiple MAs, providing a more nuanced view of market momentum.
Calculations
The Rainbow Oscillator calculation formula looks like this:
\[ RO = { 1 \over N } { \sum_{i=1}^N { ( Source_i - MA_i )} } \]
\(N\) – the number of levels
\(Source_i\) – the source data for the \(i\) level, most often the price of a particular type
\(MA_i\) – the moving average applied to the price at the \(i\) level of the rainbow
Interpretation
The Simple Moving Average serves as the default type of moving average; however, traders can select a specific type from all the MA types available for analysis. In our particular case, the number of levels for RO is set to 9. The closing price is used as the source, but this is also customisable.
The following interpretations of the indicator are generally applicable:
-
Zero-line crossovers – when the RO crosses above the moving average, it signals a potential buy opportunity. Conversely, when the RO crosses below the moving average, it suggests a possible sell opportunity.
-
Rising and falling – a rising RO indicates increasing momentum and potential continuation of an uptrend. Conversely, a falling RO signals decreasing momentum and suggests a weakening trend or a potential downtrend.
-
Divergence – bullish divergence occurs when the price makes lower lows, but the RO forms higher lows, signalling potential reversal to the upside. Bearish divergence occurs when the price makes higher highs, but the RO forms lower highs, indicating a potential downside reversal.
-
Reversal points – the RO can help identify reversal points by showing extremes in the indicator values (overbought or oversold conditions). These levels suggest that the current trend might be losing steam and could reverse.
Application
-
Buy signal – when the RO crosses above its moving average and ideally when the oscillator is moving out of oversold territory, it signals a potential upward momentum shift and provides a buy opportunity.
-
Sell signal – when the RO crosses below its moving average, especially when it moves out of an overbought region, it indicates a potential downward momentum shift, signalling traders to consider selling positions.
-
Stop-loss placement – traders may place a stop loss just below the recent swing low for buy positions or just above the recent swing high for sell positions. This approach helps protect against adverse price movements while allowing for normal market fluctuations.
-
Exit strategies – exit strategies can include taking profits when the RO shows divergence with the price or when it crosses back below the moving average in a buy trade. For sell trades, exiting can occur when the oscillator shows bullish divergence or crosses back above the moving average.
-
Confirming trades – the RO can be effectively analysed through moving average crossovers, where a sell signal is indicated when the RO crosses below its moving average, and a buy signal occurs when it crosses above. This can be combined with other indicators like the Relative Strength Index (RSI) or the Moving Average Convergence Divergence (MACD) to confirm signals, enhancing accuracy and reducing false positives.
Note
You can take advantage of algo trading, with cBots executing trades based on the signals from this indicator, as shown in our examples. Learn more about how to use indicators in cBots.
Limitations
The Rainbow Oscillator has notable limitations. As a lagging indicator, it reflects past price action and may not accurately predict future movements, potentially leading to delayed signals. Traders should be cautious, as relying solely on the RO can result in missed opportunities or false signals during rapidly changing market conditions.
Summary
The Rainbow Oscillator is a technical indicator that forecasts trend changes by applying multiple levels of a specified moving average type. Developed with customisable levels and source data, the RO aggregates the difference between price and each moving average level, creating a normalised value. This helps traders identify overbought or oversold conditions and potential reversal points based on smoothed, multilevel analysis.