Stochastic Oscillator
Definition
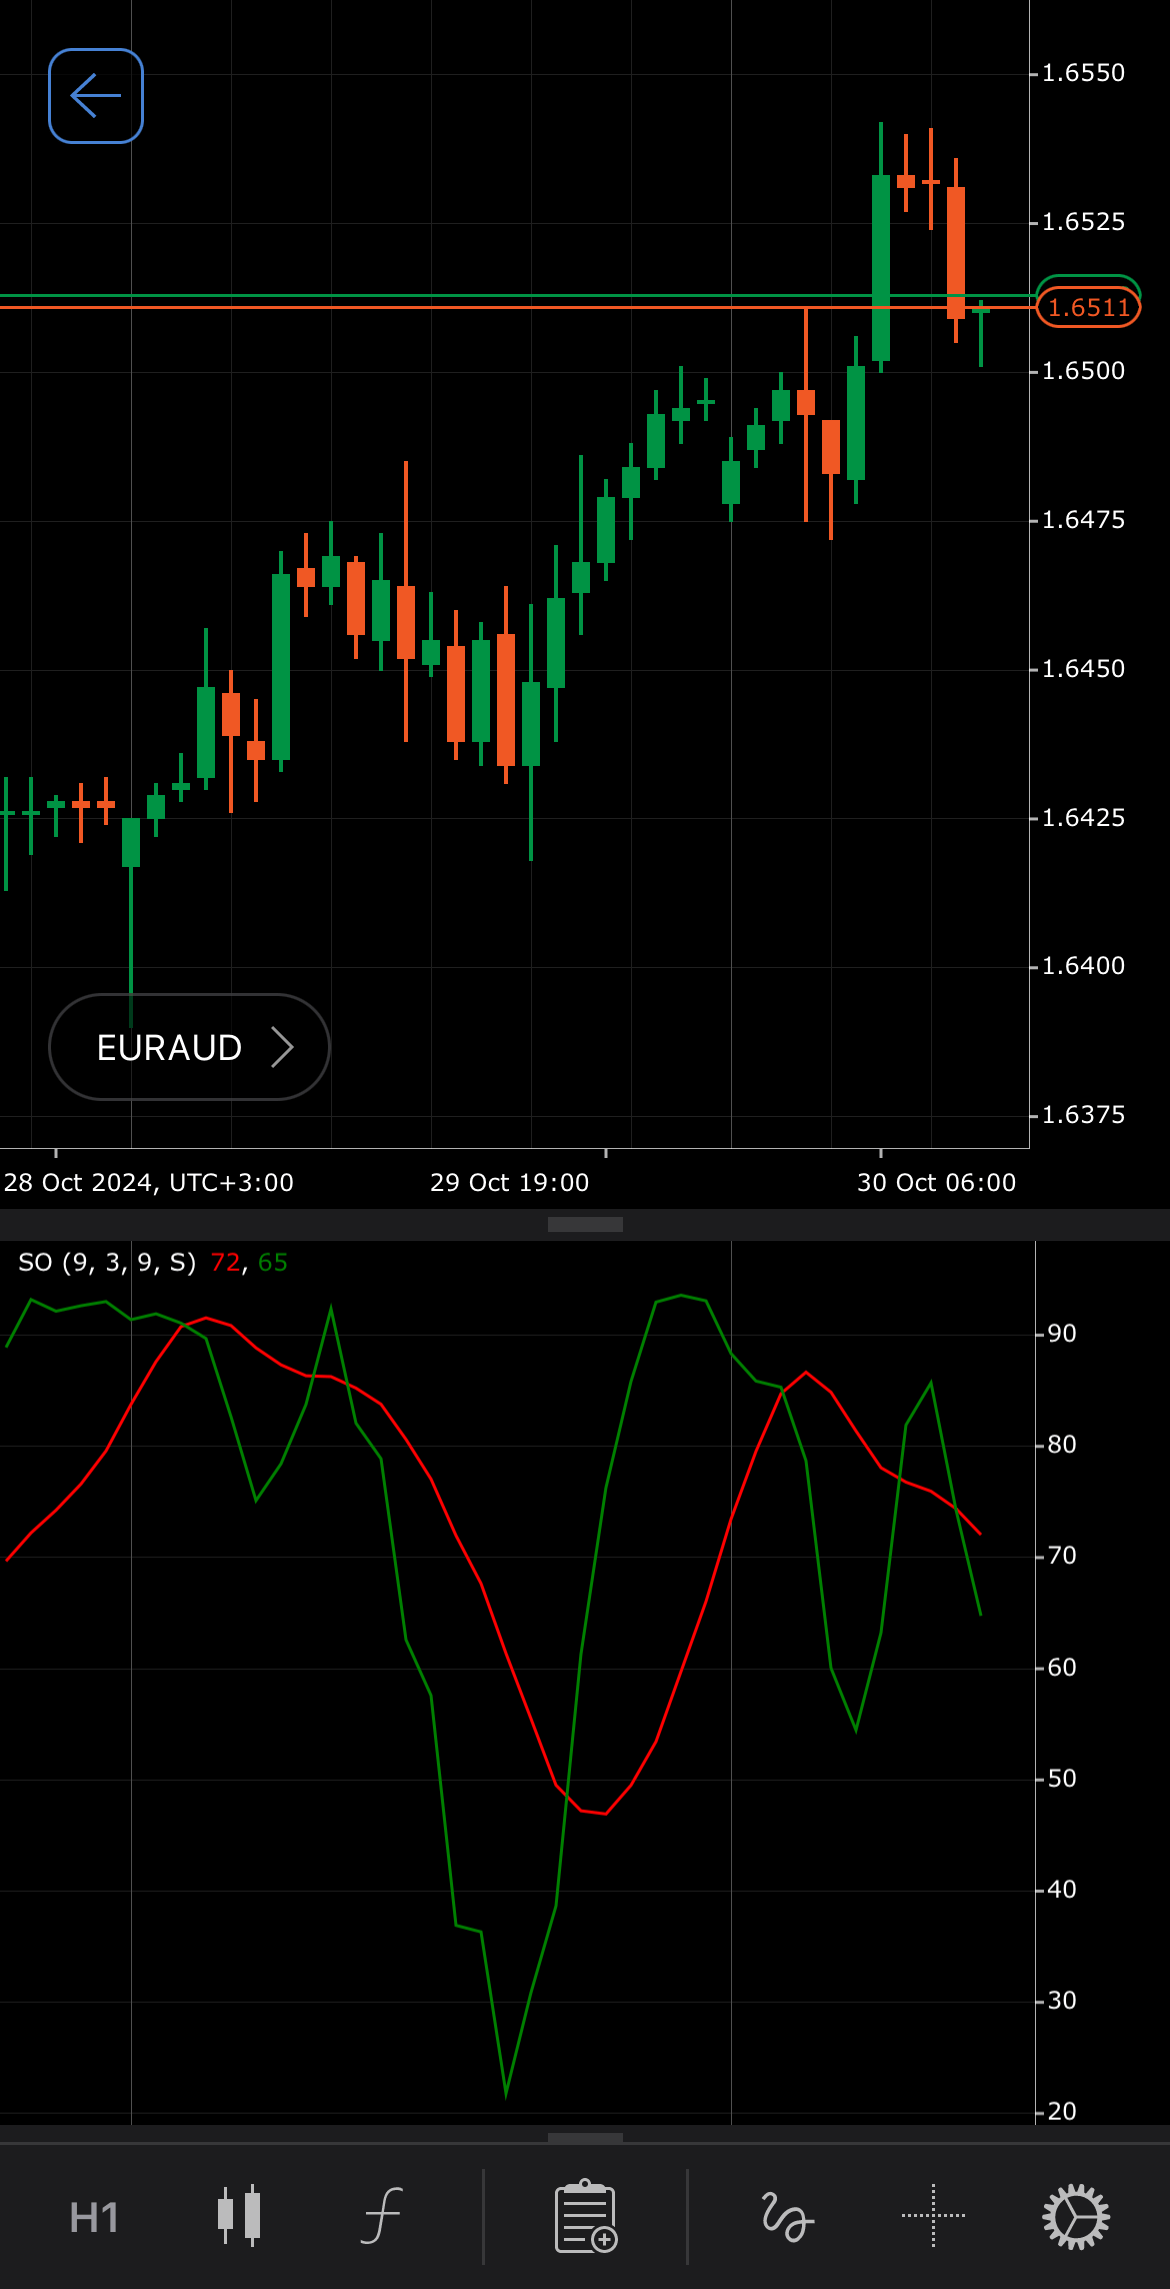
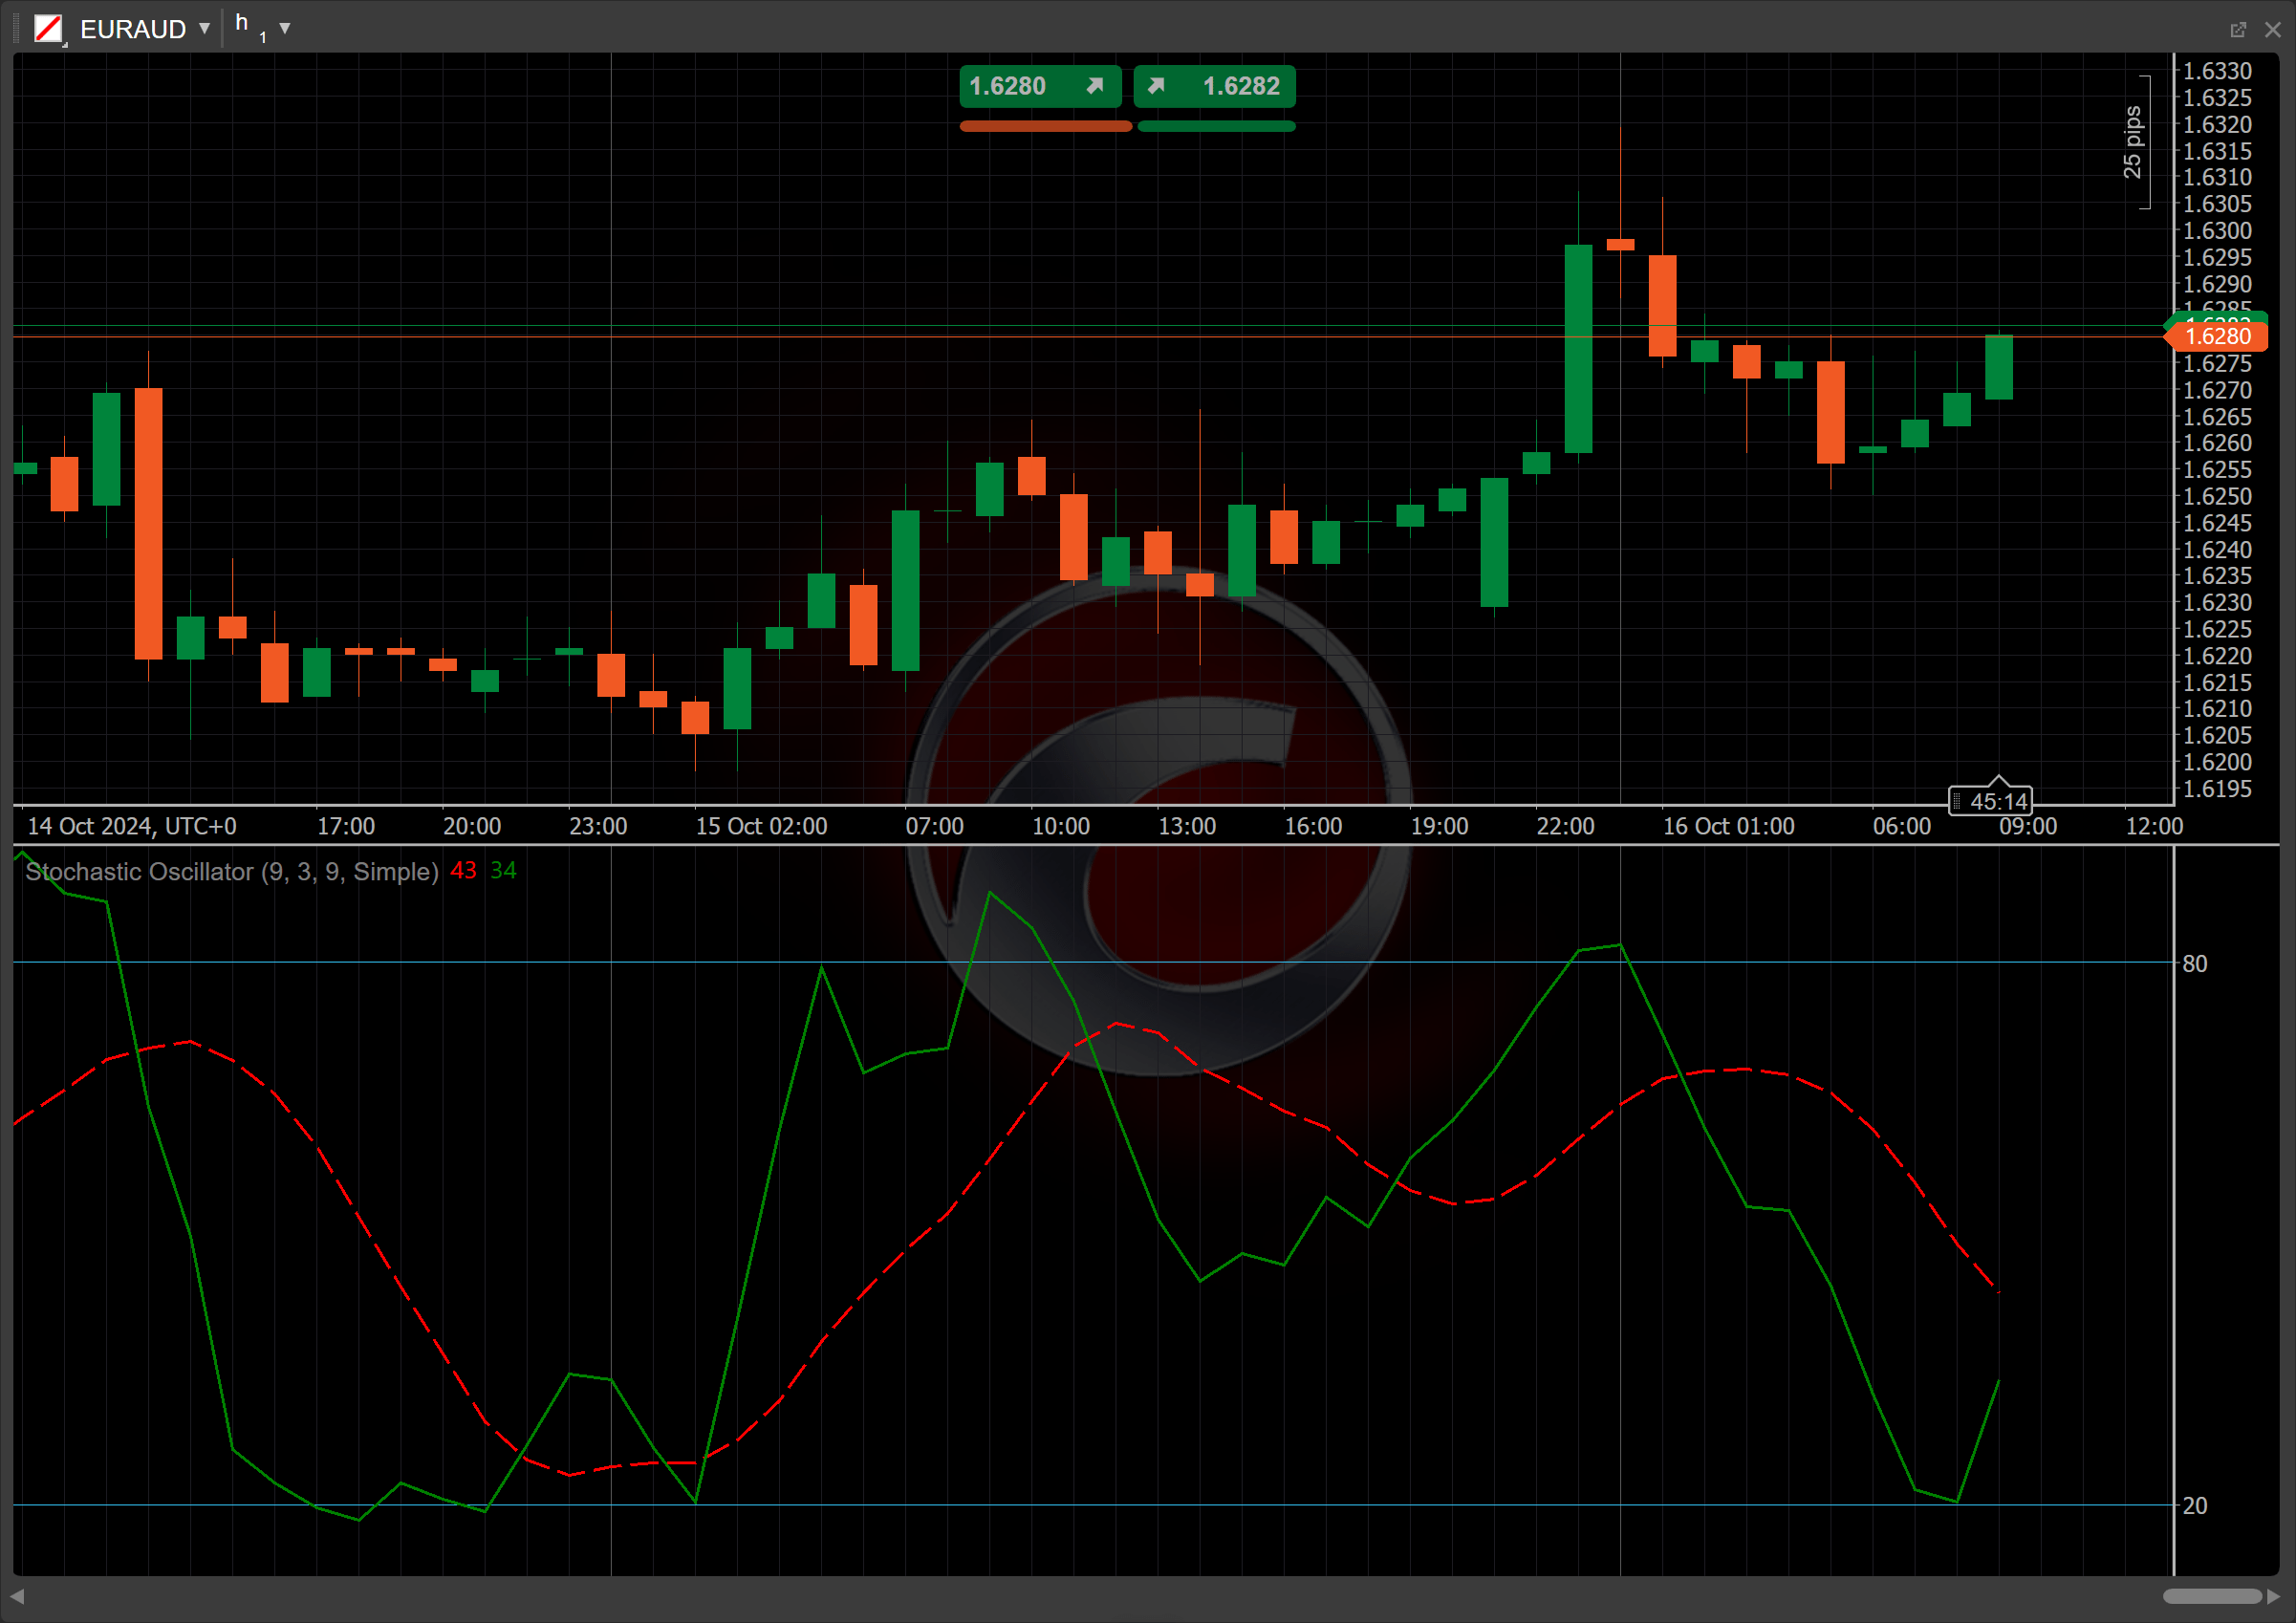
The Stochastic Oscillator (SO) is a technical indicator that measures the momentum of price movements by comparing the current closing price to its recent high-low range over a specified period. The oscillator ranges from 0 to 100, assisting traders in identifying key market conditions. It is frequently used to analyse the strength of price trends, optimise entry and exit points and provide valuable insights into market dynamics.


History
The Stochastic Oscillator was developed in the 1950s by George Lane, a technical analyst. Lane designed it to measure the momentum of price movements, observing that momentum changes often precede price reversals. Initially, it was used to identify overbought and oversold conditions in stocks. Over time, the oscillator became widely adopted in various financial markets due to its versatility in spotting potential reversals and trade signals.
Calculations
1. \(K\) is the current value of the Stochastic Oscillator, indicating how far the current closing price is from the lowest low over the last \(n\) periods, relative to the range between the highest high and the lowest low:
\[ K = { { {C - L_n} \over {H_n - L_n} } \times 100 } \]
\(C\) – the current closing price
\(L_n\) – the lowest low over the last \(n\) periods (\(K\) \(Periods\))
\(H_n\) – the highest high over the last \(n\) periods (\(K\) \(Periods\))
2. \(K\) \(Slow\) is a smoothed version of the \(K\) line, calculated as a moving average of \(K\) over \(K\) \(Slowing\) periods:
\[ K\ Slow = MA\ ( K, K\ Slowing) \]
3. \(D\) is a smoothed version of \(K\) \(Slow\), typically calculated a moving average of \(K\) \(Slow\) over \(D\) \(Periods\) periods:
\[ D = MA\ ( K\ Slow, D\ Periods) \]
Interpretation
In our particular case, the Stochastic Oscillator is initialised with the following values for the auxiliary parameters:
\[ K\ Periods = 9\ \ \ \ K\ Slowing = 3\ \ \ \ D\ Periods = 9 \]
The Simple Moving Average serves as the type of moving average; however, traders can select a specific type from all the MA types available for analysis.
The main patterns of the indicator behaviour can be interpreted as follows:
-
Crossovers – when K crosses above D, it is considered bullish momentum, especially if it occurs below the 20 level (oversold condition). Conversely, K crossing below D is bearish momentum, particularly if it occurs above the 80 level (overbought condition).
-
Rising and falling – rising K and D lines indicate increasing bullish momentum, suggesting that prices may continue to rise. Falling K and D lines indicate increasing bearish momentum, suggesting that prices may continue to decline.
-
Reversal points – when K or D is above 80, it suggests that the asset may be overbought, indicating a potential price reversal to the downside. When K or D is below 20, it suggests that the asset may be oversold, indicating a potential price reversal to the upside.
Application
-
Buy signal – when the K line crosses above the D line, especially below the 20 level (oversold condition), it suggests a potential price increase and may prompt traders to enter a long position.
-
Sell signal – when the K line crosses below the D line, particularly above the 80 level (overbought condition), it suggests a potential price decline and signals traders to consider entering a short position.
-
Stop-loss placement – for buy signals from the Stochastic Oscillator, place a stop loss below the recent swing low to protect against losses. For sell signals, set it above the recent swing high to manage risk.
-
Exit strategies – consider exiting long positions when K crosses below D or when the oscillator shows overbought conditions (above 80). Consider exiting short positions when K crosses above D or indicates oversold conditions (below 20).
-
Confirming trades – the Stochastic Oscillator can be combined with trend indicators like moving averages for confirmation. A buy signal is more reliable if it aligns with a bullish trend, and divergence between price action and the oscillator can also confirm potential reversals.
Note
You can take advantage of algo trading, with cBots executing trades based on the signals from this indicator, as shown in our examples. Learn more about how to use indicators in cBots.
Limitations
The Stochastic Oscillator may produce false signals in sideways or volatile markets, leading to premature entries or exits. During strong trends, it can remain in overbought or oversold areas for extended periods, limiting its effectiveness. It works best when combined with trend-following indicators to confirm signals and filter out noise, helping traders avoid misleading signals in unstable market conditions.
Summary
The Stochastic Oscillator is a momentum indicator that measures the position of the current closing price relative to its recent range, helping identify overbought and oversold conditions. It consists of two lines: K, the fast-moving line, and D, a smoothed version of K. The oscillator ranges between 0 and 100, with values above 80 indicating overbought conditions and below 20 suggesting oversold levels. It works best in range-bound markets, where it helps identify potential reversals or entry points at price extremes.