Triple Exponential Average
Definition
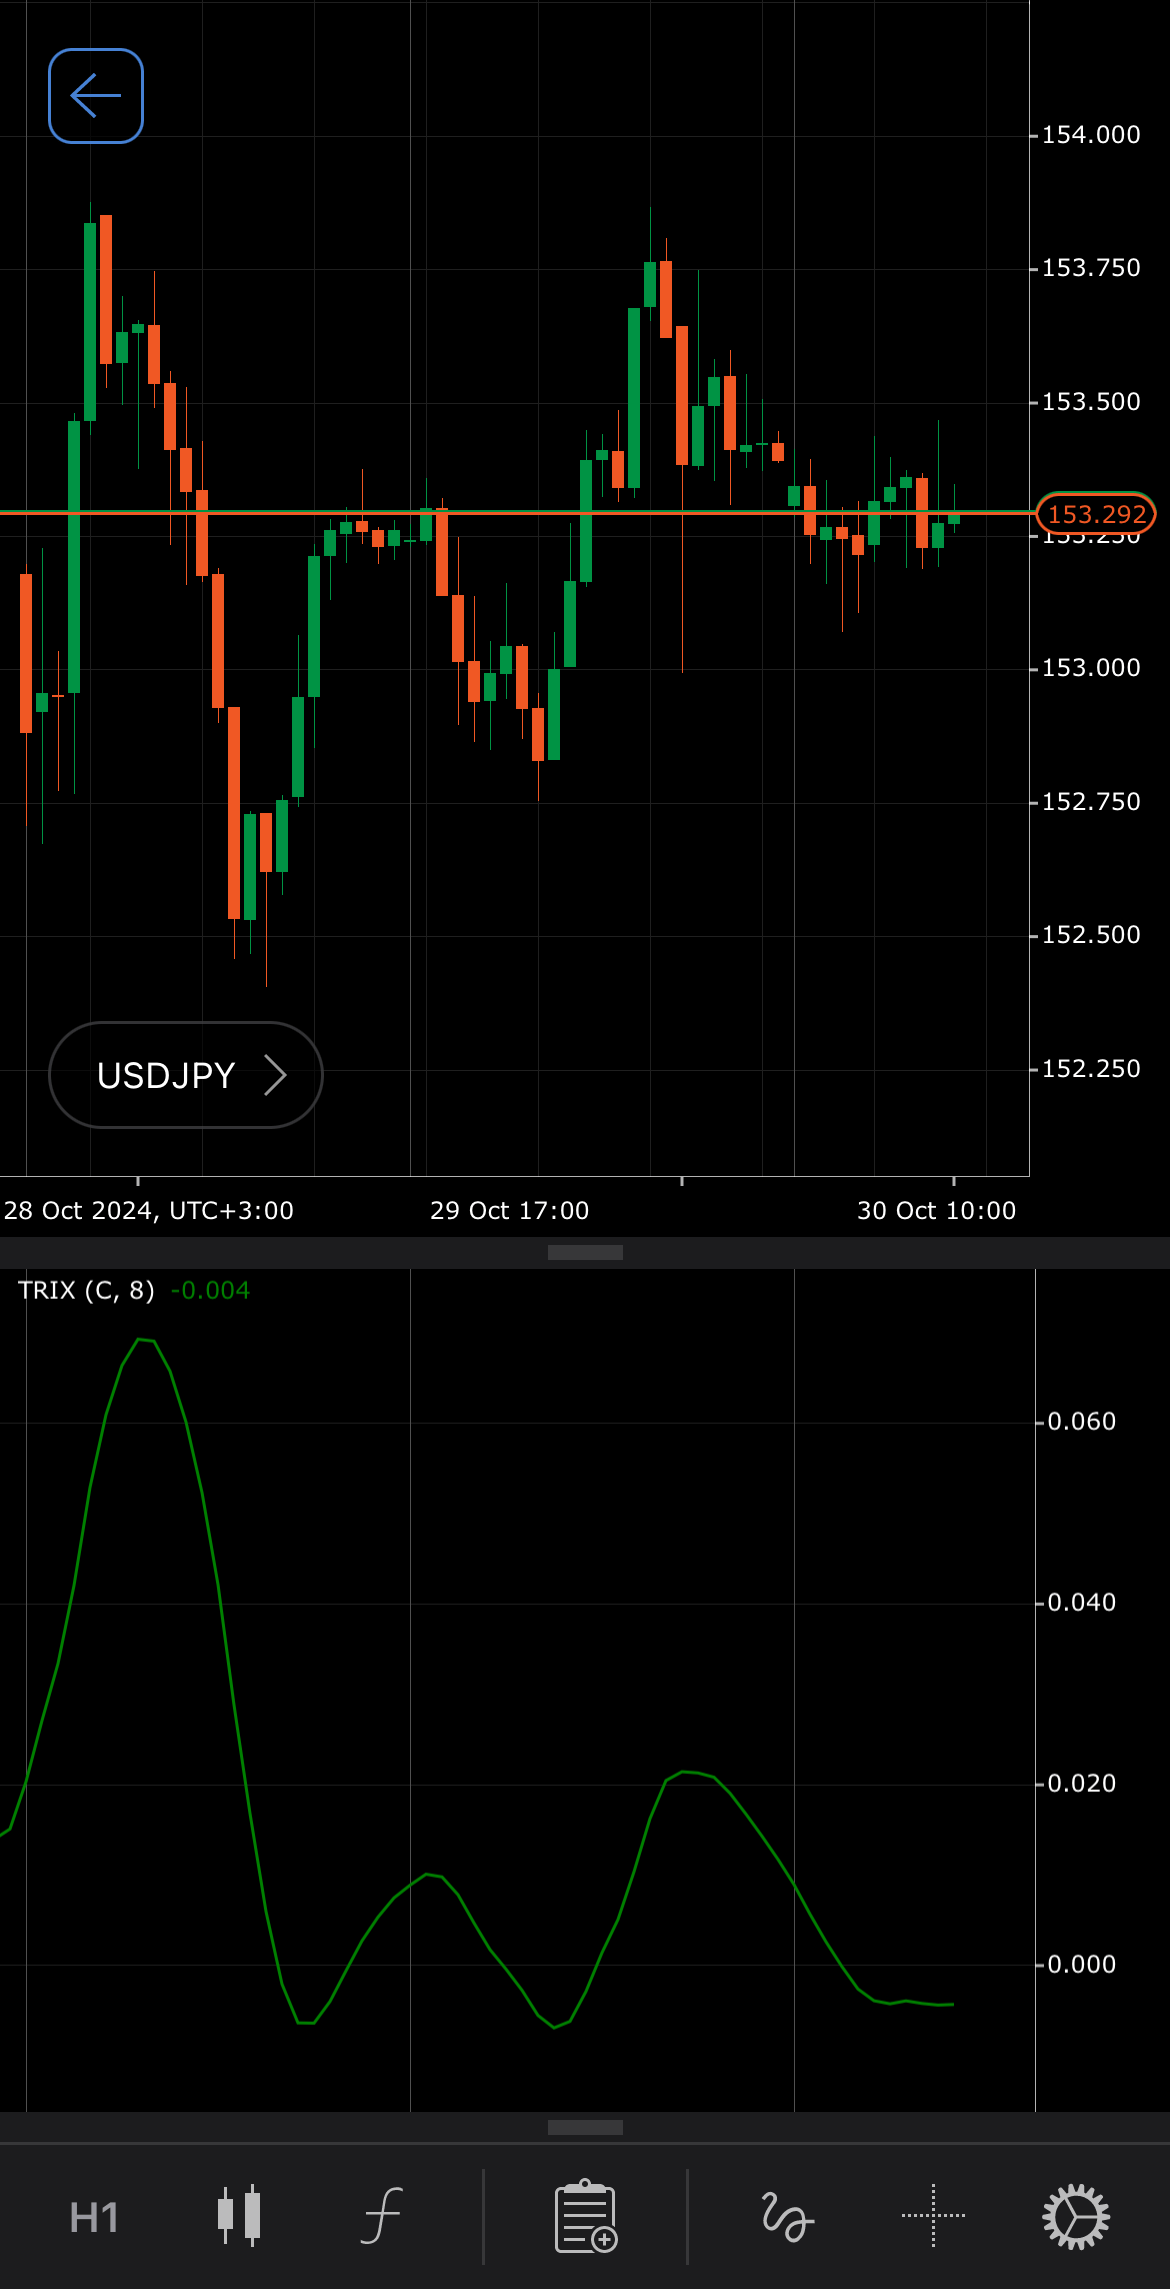
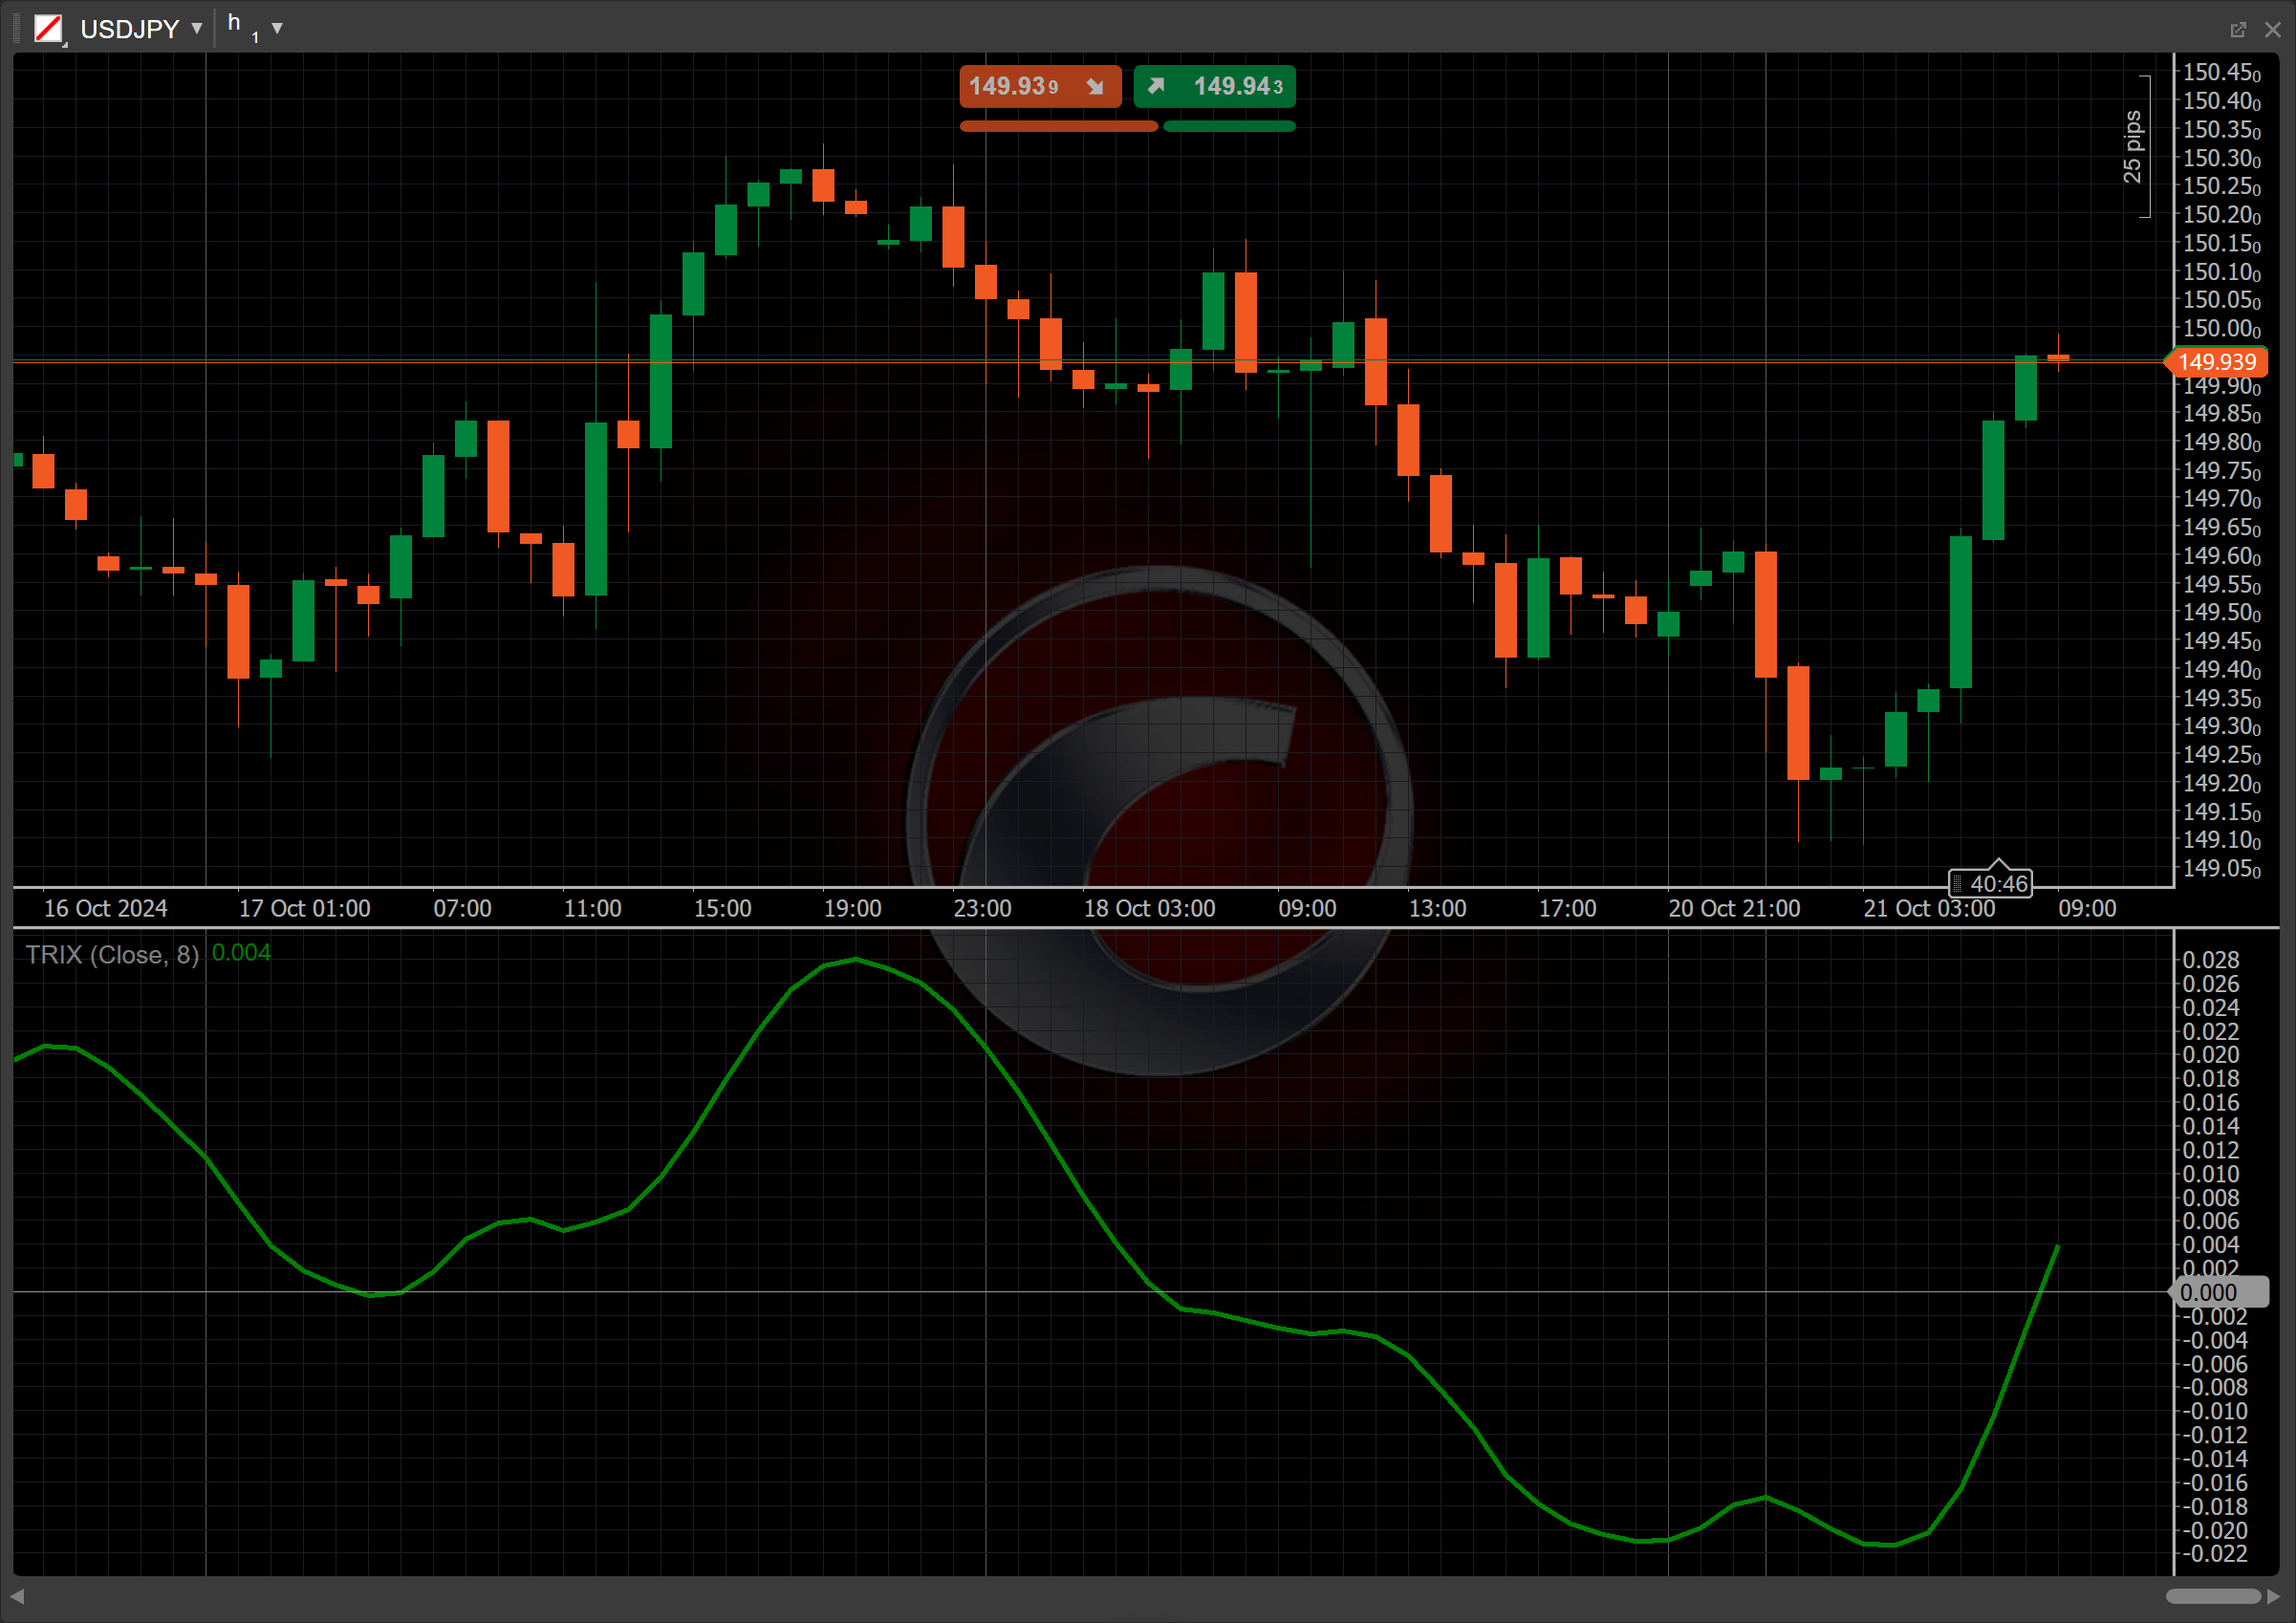
The Triple Exponential Average (TRIX) indicator is a momentum oscillator that displays the rate of change of a triple smoothed Exponential Moving Average (EMA) of a given price or data series. The purpose of TRIX is to filter out price movements that are considered insignificant or erratic by smoothing the data multiple times, which helps traders identify longer-term trends and potential reversal points. It is typically used to detect bullish or bearish market conditions based on the slope and crossovers of the TRIX line, providing signals for potential entry and exit points in trading.


History
The TRIX indicator was developed by Jack Hutson in the 1980s as a tool for technical analysis, aiming to identify trends by smoothing price data multiple times. Over the years, TRIX has gained popularity among traders for its effectiveness in spotting potential reversal points.
Calculations
The TRIX value is calculated using the following steps:
1. Single Smoothed EMA
\[ EMA_1 = { EMA\ (Close, Periods) } \]
2. Double Smoothed EMA
\[ EMA_2 = { EMA\ (EMA_1, Periods) } \]
3. Triple Smoothed EMA
\[ EMA_3 = { EMA\ (EMA_2, Periods) } \]
4. Triple Smoothed EMA
\[ TRIX = { { {EMA_3\ (current) - EMA_3\ (previous)} \over {EMA_3\ (previous)} } \times 100 } \]
\(Close\) – the closing prices over specified periods
\(Periods\) – the number of periods for the EMAs calculation
\(EMA\) \((current)\) – the EMA value for the current period
\(EMA\) \((previous)\) – the EMA value from the previous period
Interpretation
The TRIX value is calculated using an 8-period lookback by default, but other periods can be adjusted based on the strategy.
The main patterns of the indicator behaviour can be interpreted as follows:
-
Zero-line crossover – a crossover above the zero line indicates a bullish signal, suggesting that the momentum is shifting to the upside. Conversely, a crossover below the zero line signals a bearish trend, indicating potential downward momentum.
-
Crossovers – when the TRIX line crosses above its signal line (often a smoothed version of TRIX), it may indicate a buy signal. A crossover below the signal line suggests a sell signal.
-
Rising and falling – a rising TRIX line suggests increasing bullish momentum, while a falling line indicates increasing bearish momentum. The slope of TRIX can provide insights into the strength of the trend.
-
Divergence – bullish divergence occurs when prices make lower lows while TRIX makes higher lows, suggesting a potential reversal to the upside. Bearish divergence happens when prices make higher highs while TRIX makes lower highs, indicating a potential reversal to the downside.
-
Reversal points – traders often look for the TRIX turning points near zero or when it diverges from price action as potential signals for market reversals.
Application
-
Buy signal – when the TRIX line crosses above the zero line or its signal line, indicating a shift in momentum toward bullish conditions, it may be a good time to enter a long position.
-
Sell signal – when the TRIX line crosses below the zero line or its signal line, indicating a shift in momentum toward bearish conditions, it may be an opportune time to enter a short position.
-
Stop-loss placement – traders often place stop-loss orders below the most recent swing low when entering a buy position, or above the recent swing high when entering a sell position.
-
Exit strategies – an exit strategy can involve closing a position when the TRIX line crosses back below the signal line for a long position or crosses above the signal line for a short position. Additionally, traders may exit based on divergence signals or a significant change in the TRIX slope.
-
Confirming trades – traders might combine TRIX with moving averages, such as the Moving Average Convergence Divergence (MACD), to validate trends and reversals. For example, confirming a buy signal from TRIX with a bullish signal from another indicator can enhance confidence in the trade decision.
Note
You can take advantage of algo trading, with cBots executing trades based on the signals from this indicator, as shown in our examples. Learn more about how to use indicators in cBots.
Limitations
The TRIX reliance on historical data can lead to lagging signals, potentially causing late entries or exits. The indicator may also generate false signals during sideways or choppy markets, leading to whipsaws. Additionally, TRIX can be less effective in highly volatile conditions, where price movements may not correlate with the smoothed averages used in its calculation.
Summary
The Triple Exponential Average indicator is a momentum oscillator designed to identify trends and potential reversal points by analysing the rate of change of a triple smoothed exponential moving average. It provides buy and sell signals through zero line and signal line crossovers, making it valuable for traders seeking to gauge market momentum. Its ability to filter out noise through multiple smoothing techniques helps enhance trend identification, making it a popular choice among technical analysts.