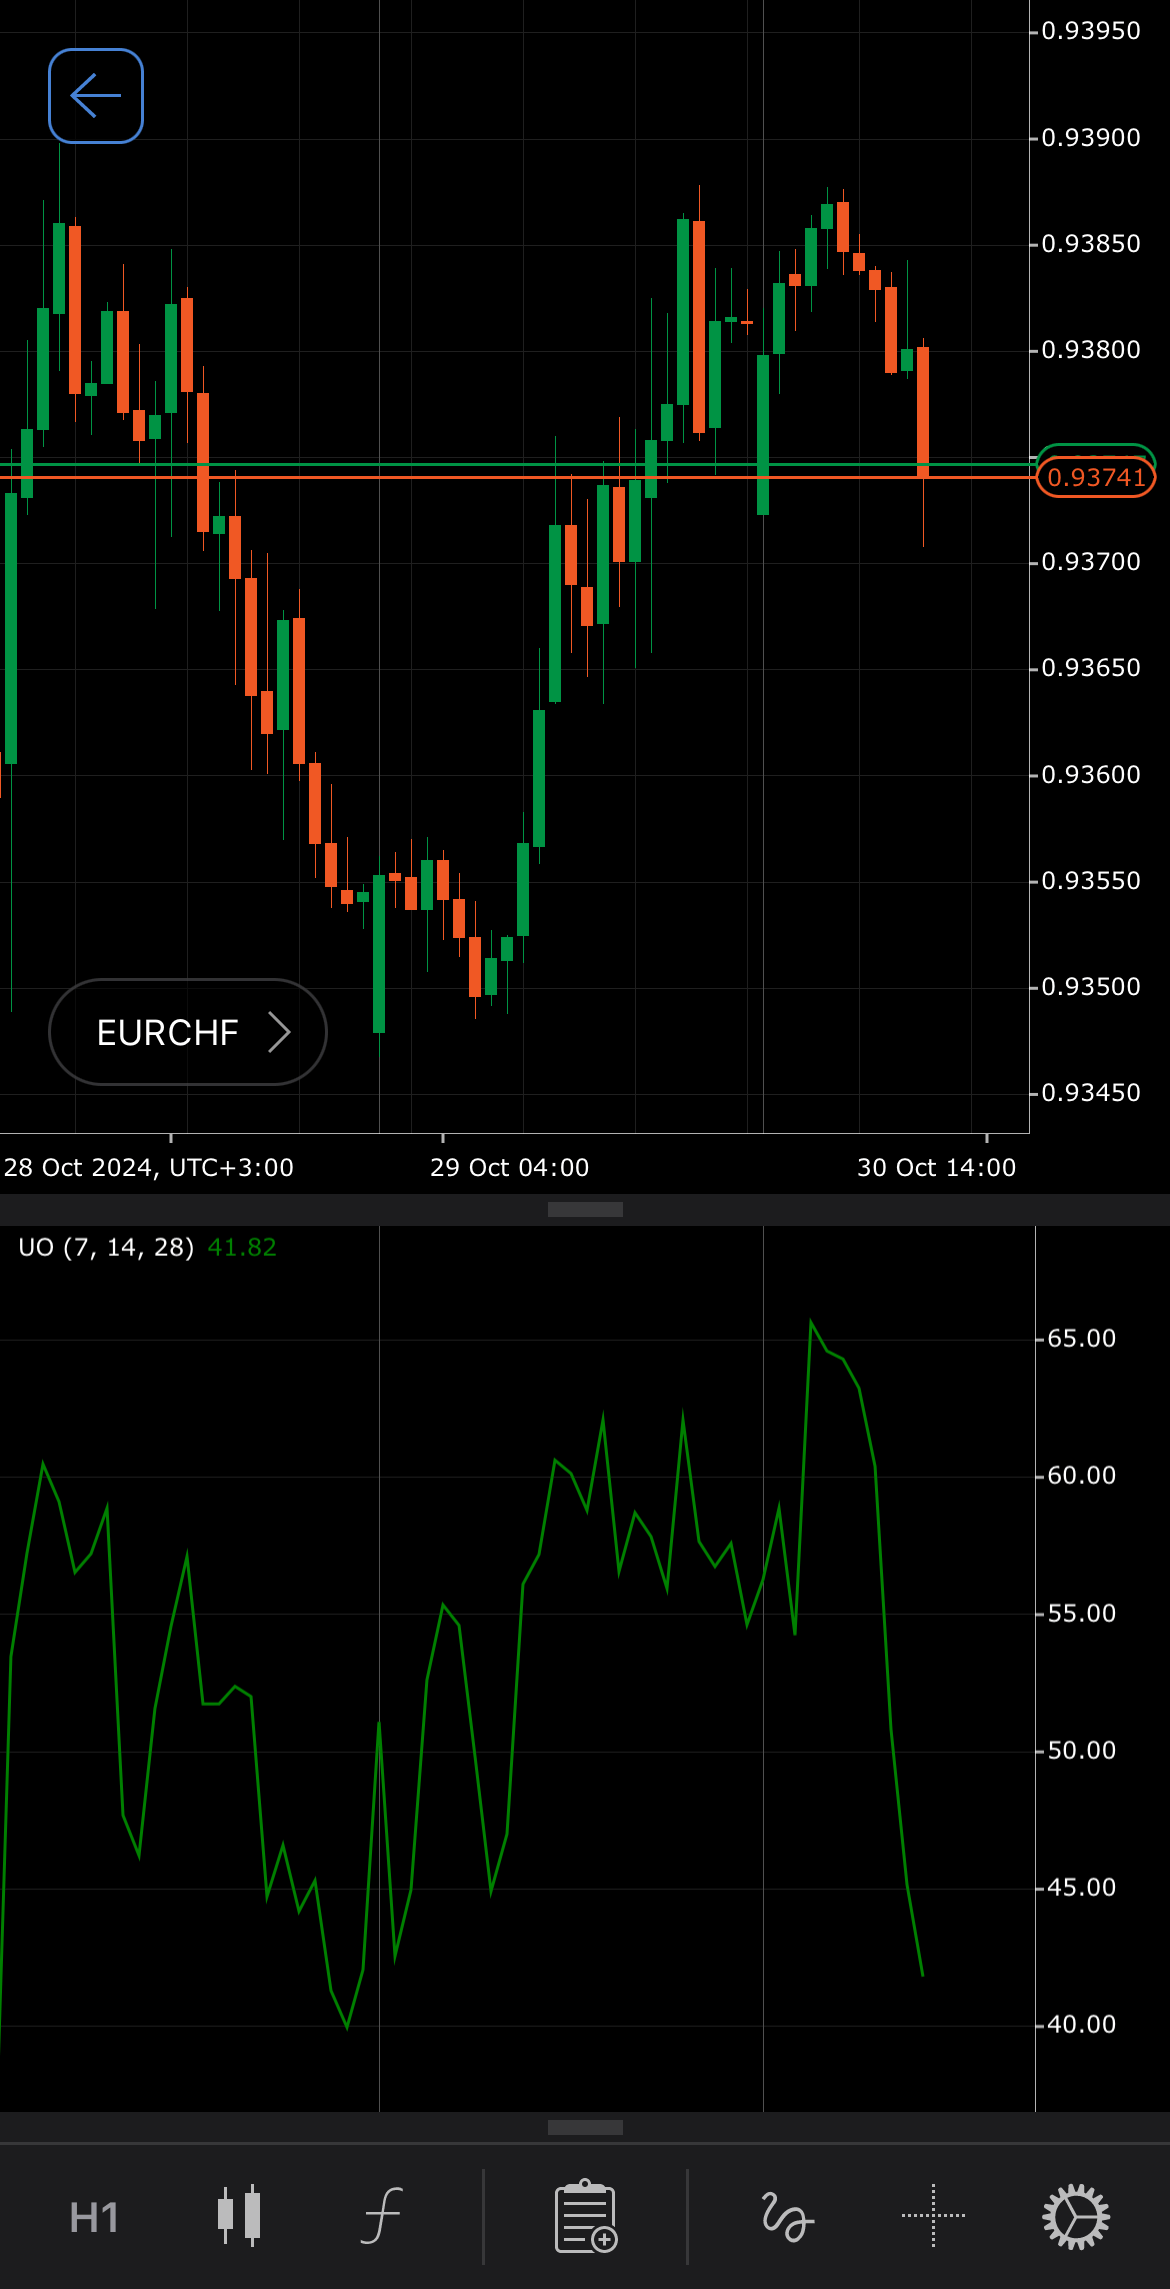
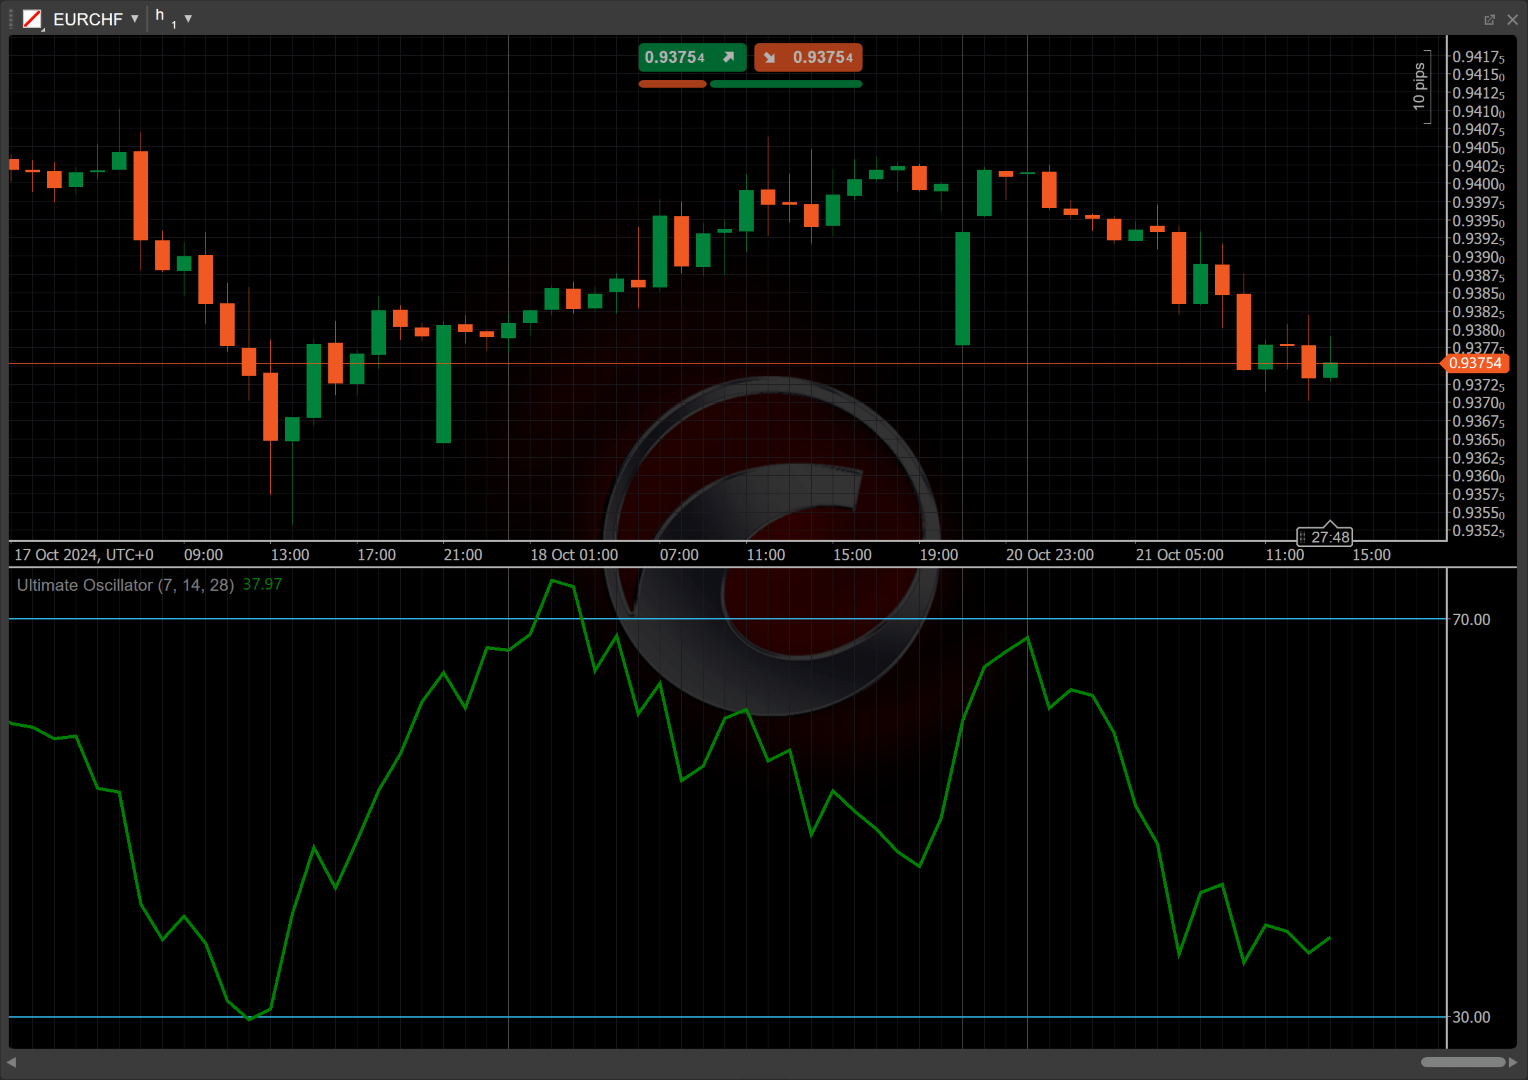
Ultimate Oscillator
Definition
The Ultimate Oscillator (UO) is a technical indicator that combines short, medium and long-term price action to measure momentum across multiple time frames. It calculates weighted averages of buying pressure relative to the true range over three different cycles. By using multiple periods, the UO reduces the noise of false divergences and provides more reliable signals for overbought and oversold conditions.


History
The Ultimate Oscillator was first described in 1976 by Larry Williams, a well-known trader and author, in his articles and trading literature. The aim of its creation was to reduce the frequency of false signals that often occurred with single-timeframe momentum oscillators. It became more widely recognised and adopted in trading strategies over the following years, especially in the 1980s. The UO multi-timeframe approach set it apart from other oscillators of its era.
Calculations
The Ultimate Oscillator is calculated using the following formula:
\[ UO = { { {4 \times A_7 + 2 \times A_{14} + A_{28}} \over { 4 + 2 +1 } } \times 100 } \]
\(A_n\) – average buying pressure, calculated as the quotient of the total buying pressure divided by the total true range over \(n\) periods (7, 14 and 28)
\[ A_n = { { \sum_{p=1}^n { BP } } \over { \sum_{p=1}^n { TR } } } \]
\(BP\) – buying pressure for each period, calculated as the current close price minus the lower of the current period low or the prior close
\[ BP = { Close - min\ (Low, Previous\ Close) } \]
\(TR\) – true range for each period, calculated as the higher of the current period high or the prior close, minus the lower of the current period low or the prior close
\[ TR = { max\ (High, Previous\ Close) - min\ (Low, Previous\ Close) } \]
Interpretation
-
Crossovers – the UO is often used with two key threshold levels: 70 and 30. When the UO moves above 70, it suggests that the symbol may be overbought, and a price decline could be expected. When the UO crosses below 30, it suggests the symbol might be oversold, signalling a potential buying opportunity or upward reversal.
-
Rising and falling – a rising UO indicates increasing buying pressure and suggests that bullish momentum is strengthening. A falling UO signals weakening buying pressure, indicating that bearish momentum may be increasing.
-
Divergence and convergence – when the UO forms higher lows while the price makes lower lows, it signals that selling pressure is weakening, and a price reversal to the upside could occur. Conversely, when the UO forms lower highs while the price forms higher highs, it signals that buying pressure is weakening, and a price decline may follow.
-
Reversal points – the UO can predict potential reversal points when it crosses the key levels of 30 or 70. A cross above 30 from below indicates a bullish reversal, while a cross below 70 from above suggests a bearish reversal.
Application
-
Buy signal – consider buying when the UO moves below the oversold level (typically 30) and then crosses back above it.
-
Sell signal – consider selling when the UO crosses above the overbought level (typically 70) and then moves back below it.
-
Stop-loss placement – a stop loss can be placed below the recent swing low when taking a long position based on a bullish signal from UO or above the recent swing high when entering a short position based on a bearish UO signal.
-
Exit strategies – traders can exit long positions when the UO reaches the overbought level (above 70) or short positions when the UO reaches the oversold level (below 30). Alternatively, exit can occur when there is a divergence between price and the UO, signalling potential reversals.
-
Confirming trades – the UO can be combined with Simple Moving Average (SMA) to confirm trends. For example, a buy signal from the UO can be confirmed if the price is above a rising SMA. Likewise, a sell signal can be confirmed if the price is below a falling SMA.
Note
You can take advantage of algo trading, with cBots executing trades based on the signals from this indicator, as shown in our examples. Learn more about how to use indicators in cBots.
Limitations
The Ultimate Oscillator can lag in strongly trending markets due to its multi-timeframe averaging, potentially missing early signals. It may also generate false signals during choppy or sideways markets. Additionally, using fixed overbought (70) and oversold (30) levels may not be suitable for all symbols, requiring adjustments based on market conditions.
Summary
The Ultimate Oscillator is a versatile momentum indicator that assesses market strength by combining price action from three distinct time frames. By calculating weighted averages of buying pressure and true range, the UO provides insights into overbought or oversold conditions, aiding traders in identifying potential entry and exit points. Its multi-period approach helps mitigate the impact of false signals, making it a valuable tool for trend analysis.