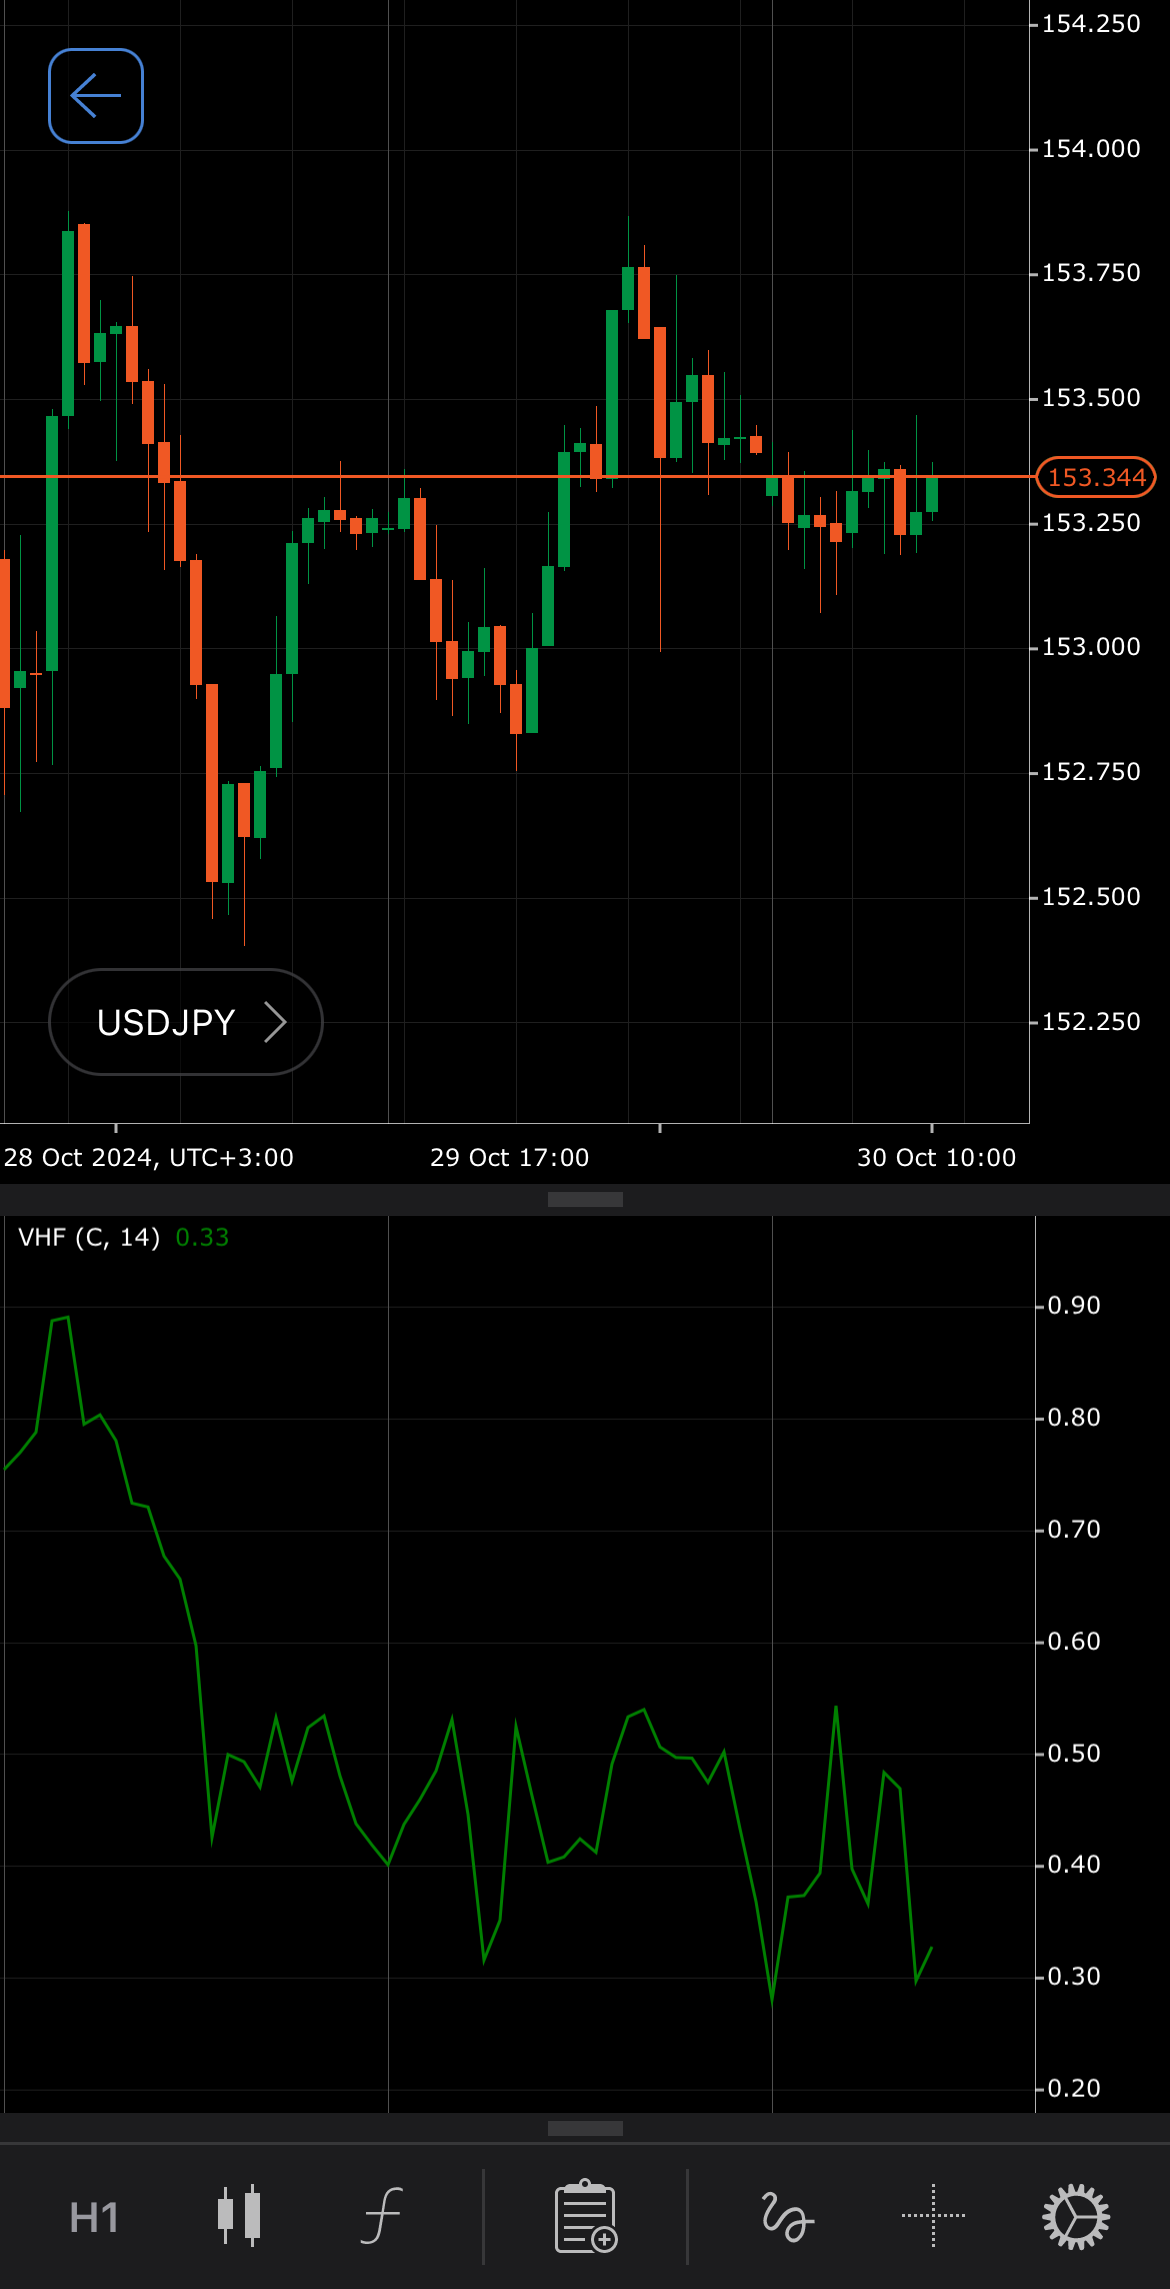
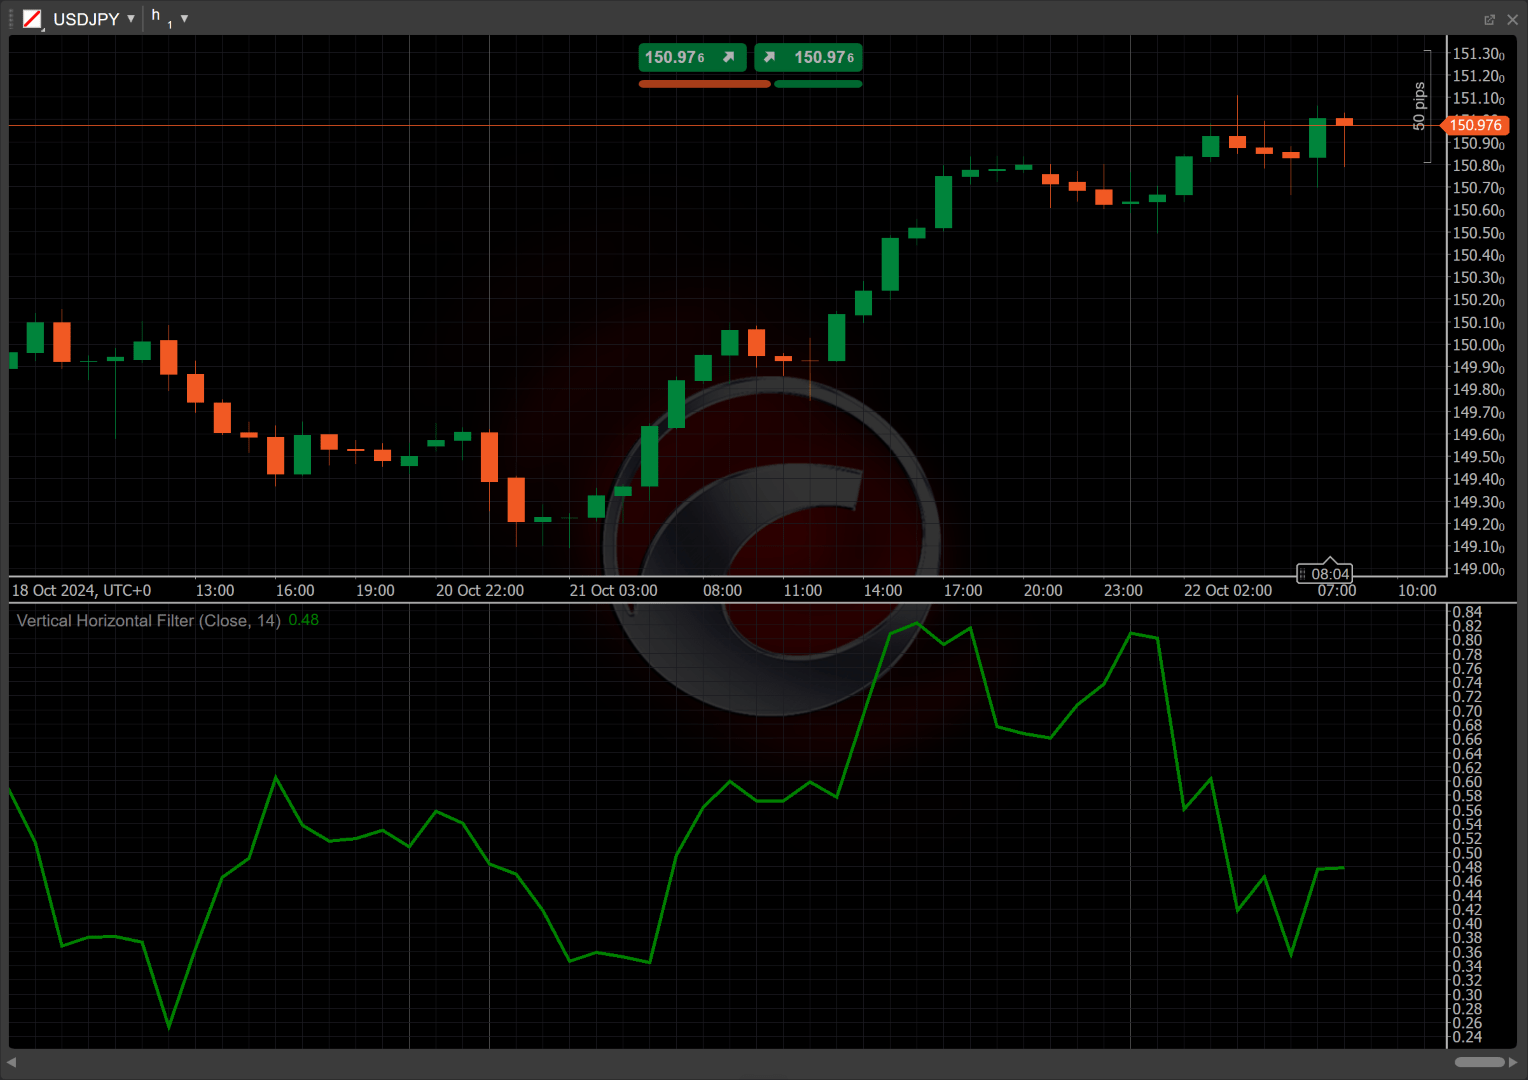
Vertical Horizontal Filter
Definition
The Vertical Horizontal Filter (VHF) is an indicator used in technical analysis to determine trend strength by comparing the price range to the sum of price changes over a specified period. The VHF is particularly useful for filtering out market noise and enhancing trade decisions by indicating periods of high volatility and potential trend reversals. It helps traders identify whether the market is trending or ranging, providing insight into the momentum of price movements.


History
The VHF indicator was developed by trader and author Tushar S. Chande and introduced in his book, "The New Technical Trader", published in 1998. Chande aimed to create an indicator that could effectively distinguish between trending and ranging markets, enhancing traders' ability to identify momentum. The VHF gained popularity among technical analysts for its simplicity and effectiveness in assessing market conditions.
Calculations
The Vertical Horizontal Filter value is calculated using the following formula:
\[ VHF = { { (Maximum\ Price - Minimum\ Price) } \over { \sum \vert{ Current\ Price - Previous\ Price }\vert } } \]
(\(Maximum\) \(Price\) − \(Minimum\) \(Price\)) – the price range, calculated as the difference between the highest and lowest prices over a specific period
\(\Sigma\) |\(Current\) \(Price\) − \(Previous\) \(Price\)| – the cumulative price movement, representing the sum of the absolute value of the price changes for each day within the same period
Interpretation
The 14-period and closing prices are used by default to calculate the VHF value.
The following interpretations of the indicator are generally applicable:
-
Rising and falling – a rising VHF value indicates increasing trend strength and potential market momentum. This suggests that prices are moving in a consistent direction, which can be interpreted as a bullish (if rising) or bearish (if falling) trend. Conversely, a falling VHF value may signal weakening trend strength, suggesting the market could be transitioning to a ranging phase.
-
Divergence and convergence – if prices are making new highs while the VHF is declining, it may suggest weakening momentum and a potential trend reversal. If prices are making new lows and the VHF is rising, it could indicate a potential bullish reversal.
-
Breakouts – when the VHF rises above 1, it typically indicates a strong breakout, suggesting that the market is trending decisively in one direction. If the VHF drops below 0.5, it can signal that the market is entering a ranging phase, indicating a potential breakout opportunity when the VHF starts to rise again.
Application
-
Buy signal – a potential buying opportunity occurs when the VHF rises above 1, indicating a strong upward trend. Traders may enter a long position, especially if the price is also above a key moving average, signalling bullish momentum.
-
Sell signal – a potential selling opportunity arises when the VHF falls below 0.5, suggesting a potential trend reversal or a ranging market. Traders may consider entering short positions if the price is below a moving average, indicating bearish momentum.
-
Stop-loss placement – for long positions, a stop loss can be placed below the most recent swing low or a significant support level, considering the VHF indicator to assess the trend strength. For short positions, a stop loss should be placed above the most recent swing high or resistance level, using the VHF to gauge whether the market may reverse.
-
Exit strategies – traders may exit long positions when the VHF begins to fall significantly (below 1), indicating a weakening trend. For short positions, exiting can occur when the VHF rises significantly (above 0.5), suggesting a potential bullish reversal.
-
Confirming trades – the VHF can be combined with indicators like the Simple Moving Average (SMA) or the Relative Strength Index (RSI) for enhanced trading signals. For example, when the VHF is above its SMA, it confirms a strong trend, reinforcing long positions when the price crosses above the SMA. Conversely, a price crossover below the SMA with a declining VHF signals a sell, improving trade reliability.
Note
You can take advantage of algo trading, with cBots executing trades based on the signals from this indicator, as shown in our examples. Learn more about how to use indicators in cBots.
Limitations
The VHF may produce false signals in choppy or low-volatility markets, leading to premature entries or exits. It also relies on historical price data, which can lag in rapidly changing conditions. Additionally, the VHF may not perform well in sideways markets, potentially providing limited insight into price direction during such phases.
Summary
The Vertical Horizontal Filter is a technical analysis indicator used to assess trend strength by comparing price range to price changes over a specified period. A rising VHF indicates strong momentum, while a declining value suggests market ranging. Traders can use the VHF to identify potential buy and sell signals, enhancing decision-making. It serves as a valuable tool for evaluating market conditions and improving trading strategies based on trend dynamics.