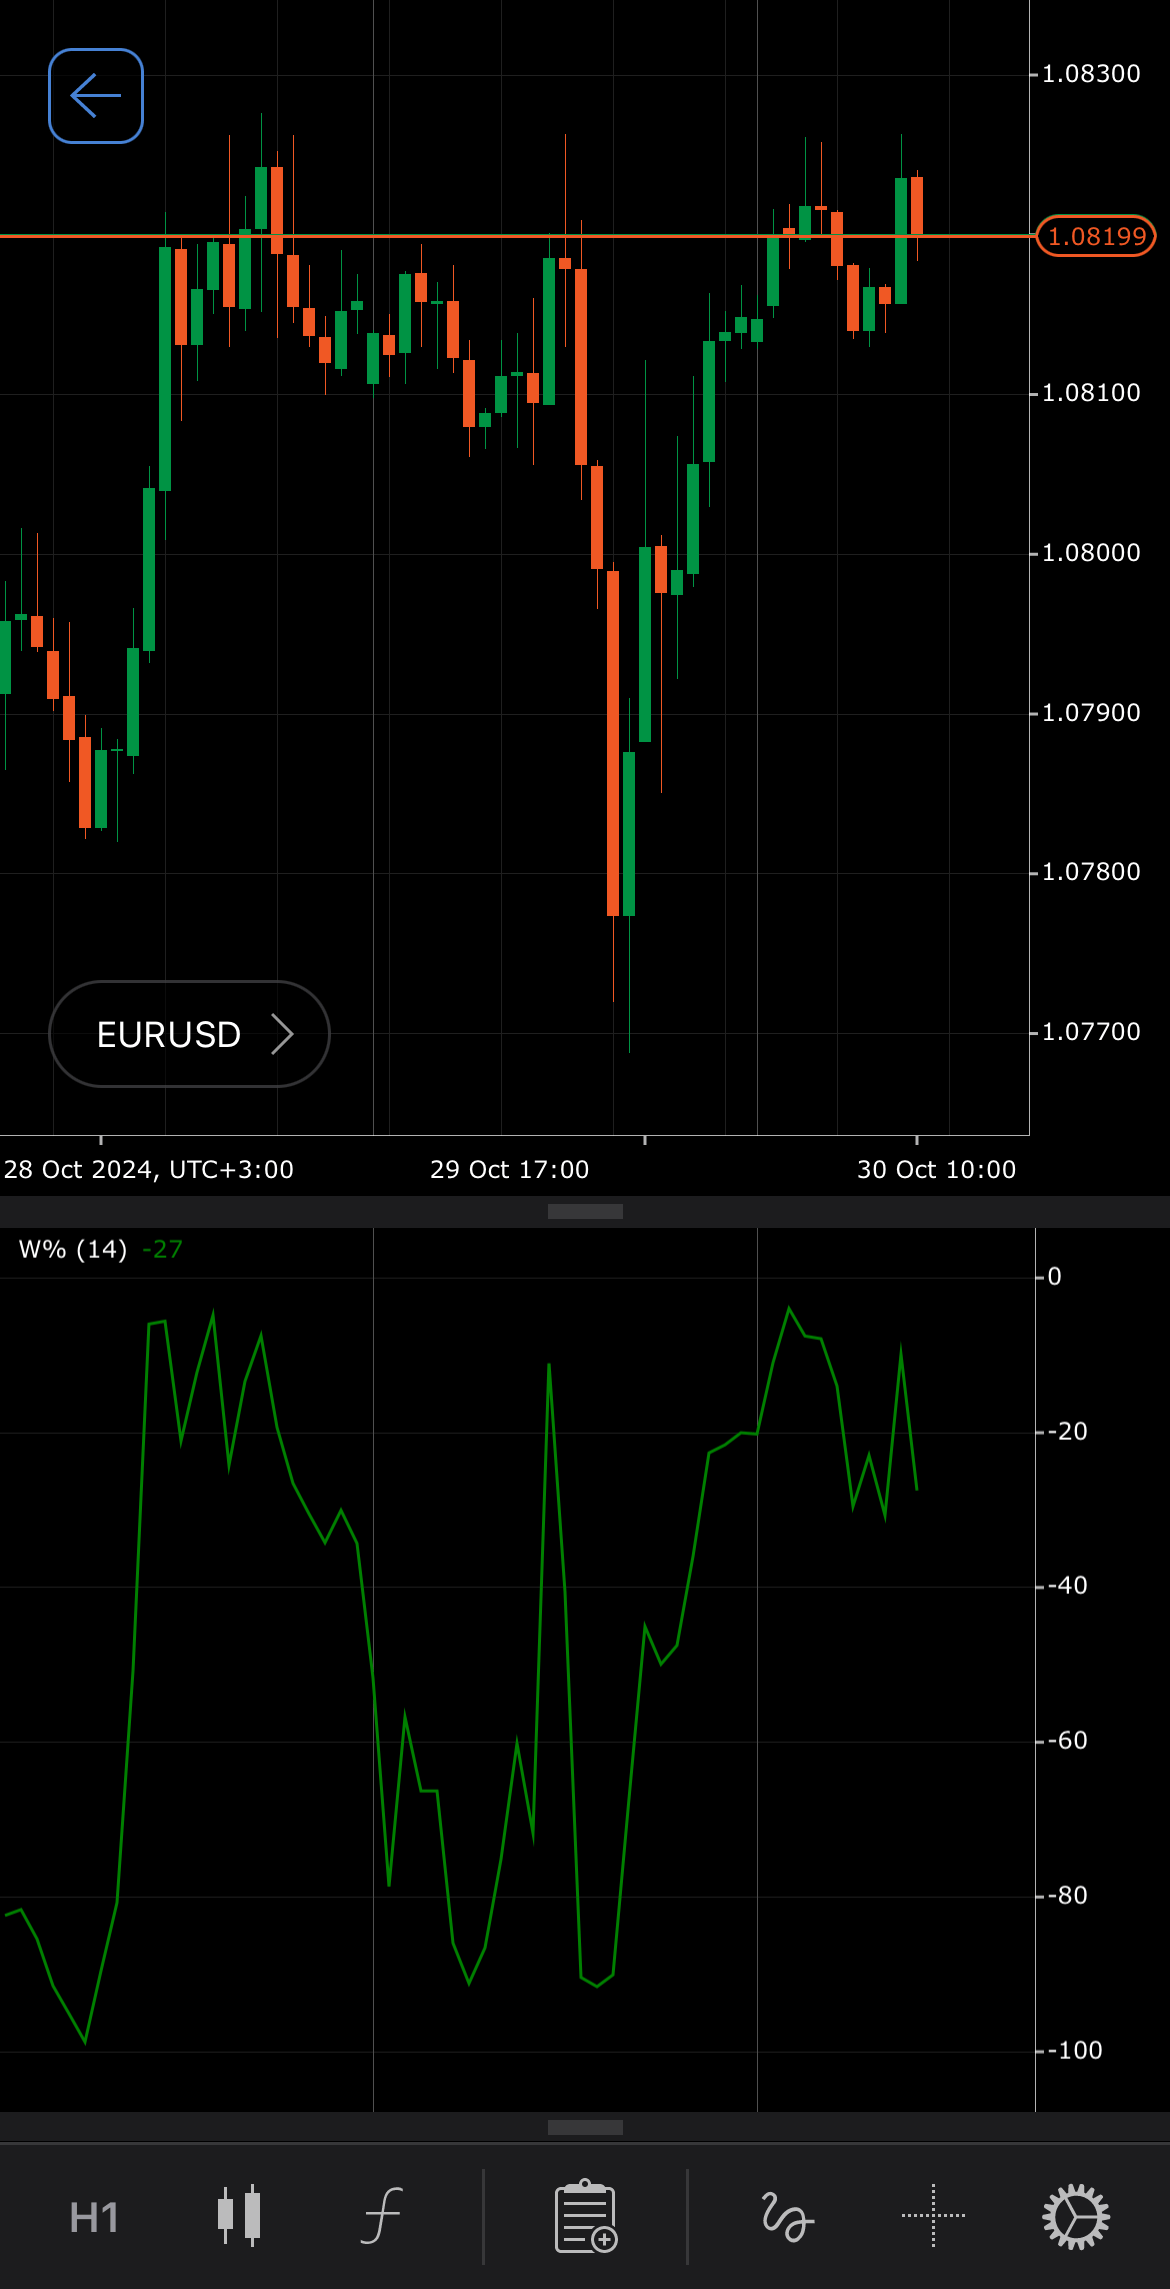
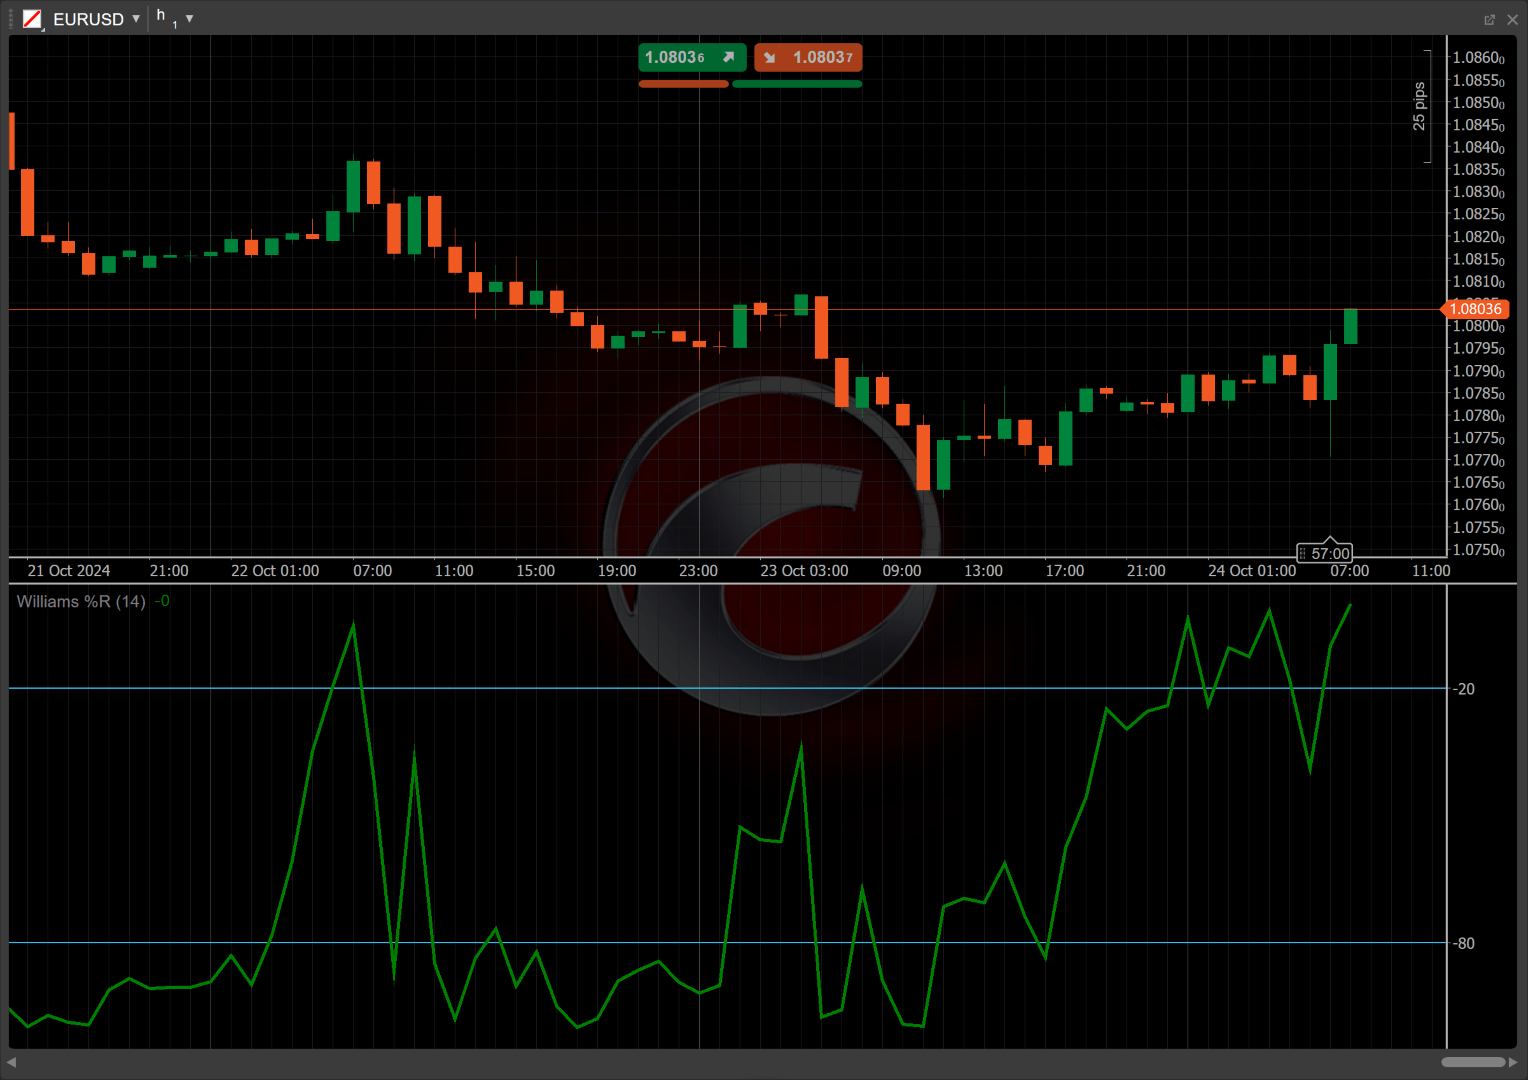
Williams PctR
Definition
The Williams %R is a momentum oscillator that measures overbought and oversold levels in the market. It ranges from -100 to 0, providing traders with insights into potential price reversals. A reading above -20 indicates overbought conditions, while a reading below -80 suggests oversold conditions. The indicator is particularly useful in identifying market momentum and potential entry and exit points based on price fluctuations relative to recent highs and lows.


History
The Williams %R indicator was developed by Larry Williams in the 1970s. Williams introduced this oscillator in his book "How I Made One Million Dollars Trading Commodities" published in 1973. The indicator has since gained popularity among traders for its simplicity and effectiveness in identifying market trends and reversals.
Calculations
The Williams %R is calculated using the following formula:
\[ Williams\ PctR = { ( { { Highest\ High - Current\ Close } \over { Highest\ High - Lowest\ Low } } ) \times -100 } \]
\(Highest\) \(High\) – the highest price over the lookback period
\(Lowest\) \(Low\) – the lowest price over the lookback period
\(Current\) \(Close\) – the closing price of the current period
Interpretation
By default, the Williams %R is calculated with a 14-period lookback.
The main patterns of the indicator behaviour can be interpreted as follows:
-
Crossovers – the Williams %R oscillates between -100 and 0. A crossover above -20 can indicate a potential trend reversal from bearish to bullish, suggesting overbought conditions. Conversely, crossing below -80 may indicate a reversal from bullish to bearish, suggesting oversold conditions.
-
Rising and falling – a rising Williams %R indicates increasing momentum in the direction of the trend, suggesting a continuation of the bullish trend. Conversely, a falling Williams %R indicates increasing bearish momentum, suggesting a continuation of the bearish trend.
-
Divergence – when the price makes a new low, but the Williams %R makes a higher low, it indicates weakening bearish momentum and potential for a price reversal upward. When the price makes a new high while the Williams %R makes a lower high, it signals weakening bullish momentum and potential for a price reversal downward.
-
Reversal points – the Williams %R can indicate potential reversal points when it reaches extreme levels (-20 or -80). A move back towards the midpoint can signal a reversal in price direction.
-
Breakouts – if the Williams %R approaches -20 during a consolidation phase, it may signal a breakout to the upside. If it approaches -80, it may indicate a breakout to the downside.
Application
-
Buy signal – when the Williams %R crosses above -80 from below, indicating that the market may be oversold and due for a reversal, it can be interpreted as a possibility to enter a long position.
-
Sell signal – when the Williams %R crosses below -20 from above, suggesting that the market may be overbought and due for a decline, it can be interpreted as a possibility to enter a short position.
-
Stop-loss placement – traders can place a stop loss just above the most recent swing high for buy orders or below the most recent swing low for sell orders.
-
Exit strategies – an effective exit strategy might involve closing a buy position when the Williams %R crosses below -20, indicating potential overbought conditions. For sell positions, closing them when the indicator crosses above -80 suggests a possible market reversal to the upside.
-
Confirming trades – traders often use the Williams %R alongside moving averages or Relative Strength Index (RSI) to confirm signals. For instance, a bullish crossover in the Williams %R alongside a bullish crossover in the RSI can strengthen the case for a buy signal, while the opposite applies for sell signals.
Note
You can take advantage of algo trading, with cBots executing trades based on the signals from this indicator, as shown in our examples. Learn more about how to use indicators in cBots.
Limitations
Despite its popularity, the Williams %R indicator can produce false signals during strong trends, leading to potential losses. Additionally, it may lag in rapidly changing market conditions, resulting in delayed reactions to price movements. Traders should use the indicator in conjunction with other tools and analysis methods for improved accuracy and reliability.
Summary
The Williams %R indicator serves as a valuable tool for traders, offering insights into overbought and oversold conditions in the market. It helps identify potential reversal points and can indicate market momentum. Its versatility allows it to be applied across various financial assets and time frames, making it suitable for different trading strategies. While effective, traders should remain cautious of its limitations, particularly in trending markets, and consider combining it with other indicators to enhance trading decisions.