Center of Gravity
Definition
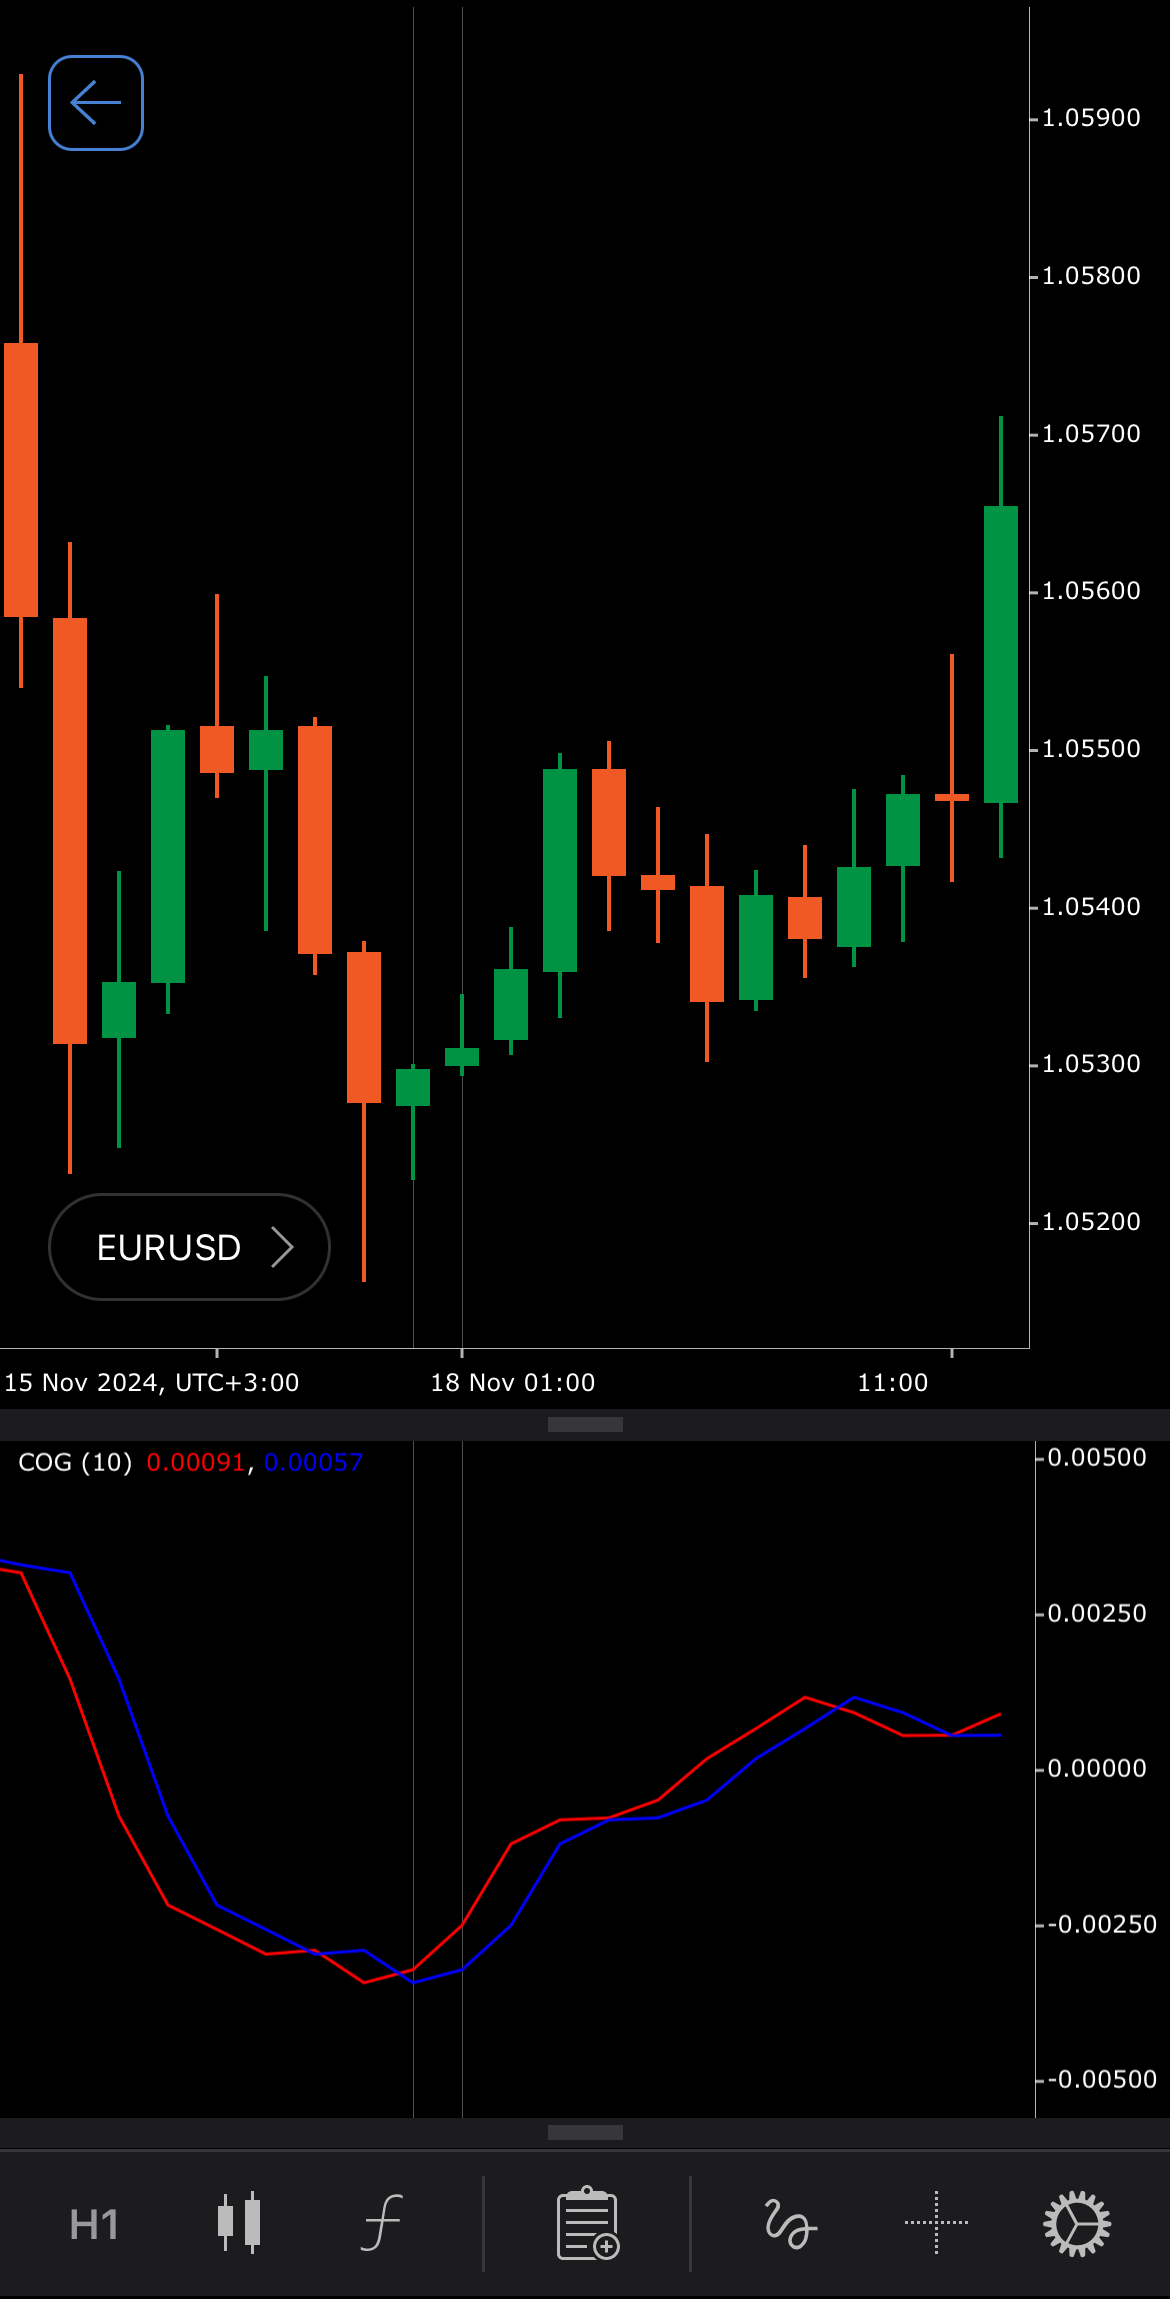
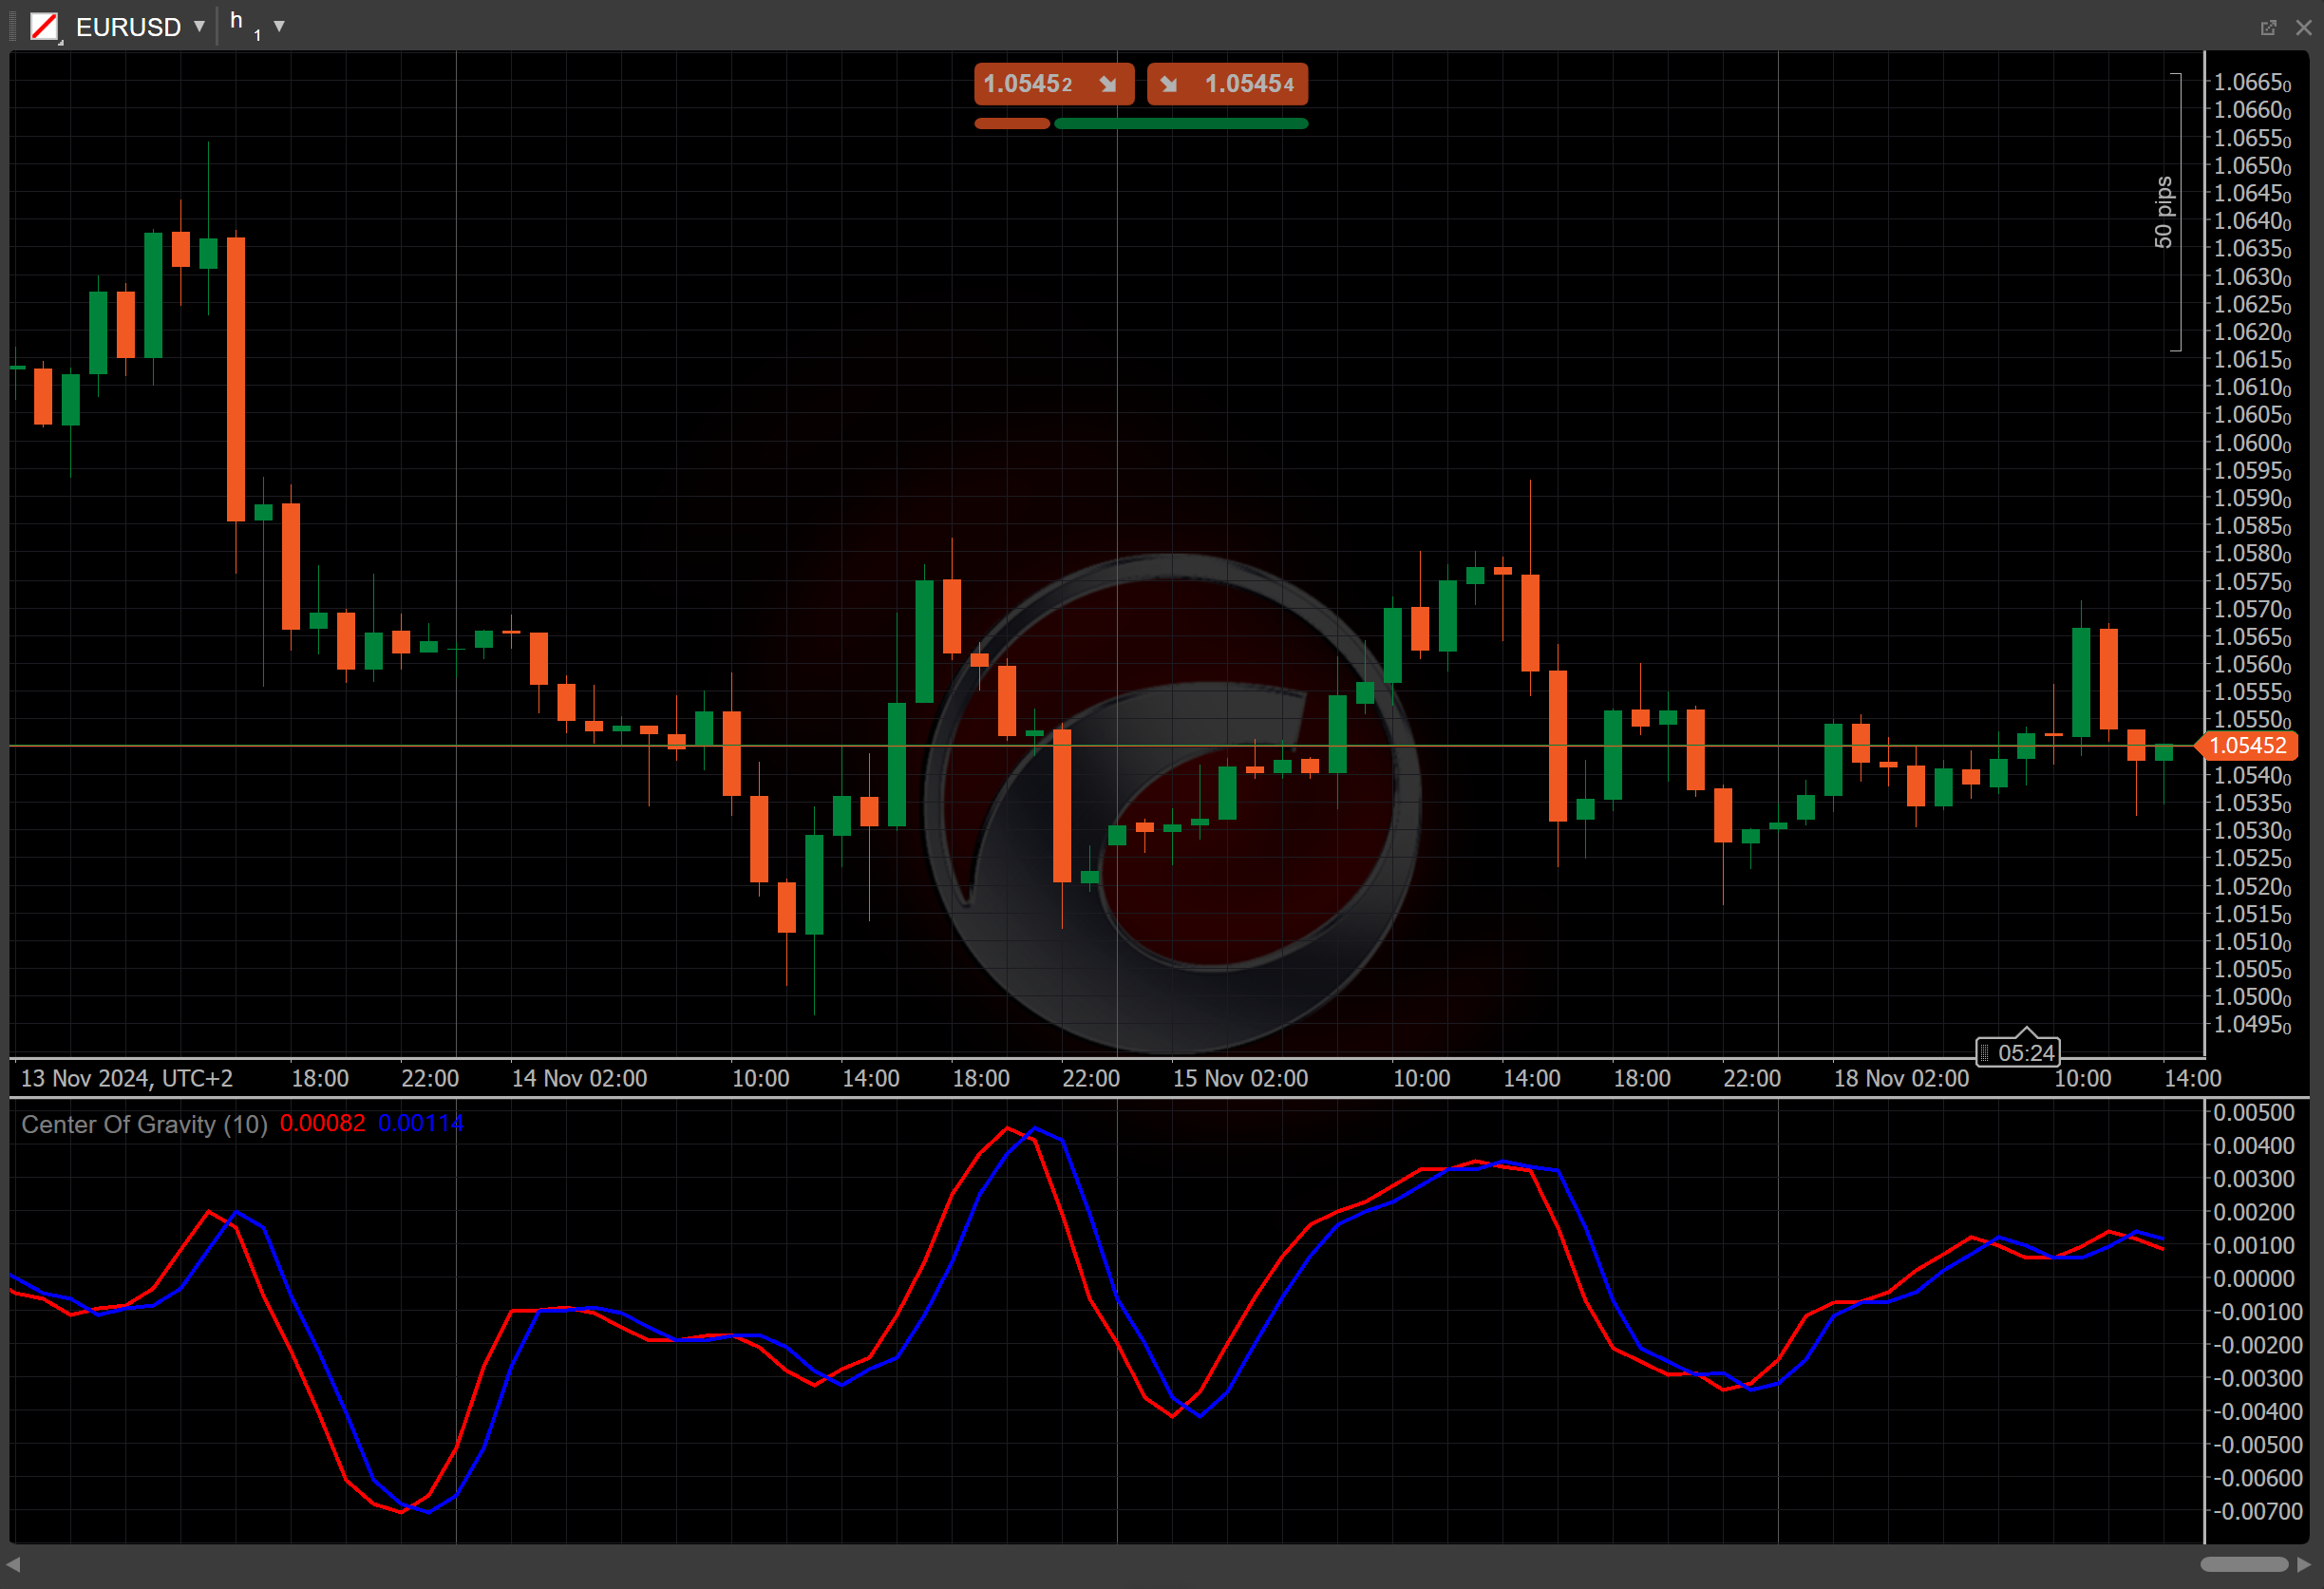
The Center of Gravity (CoG) is a technical analysis tool used to identify potential price reversals. The CoG specialises in pinpointing instances where price reversals are expected. The indicator borrows its name from the physics concept which represents the balance point of a distribution of mass.
History
The CoG was developed by John Ehlers, a notable figure in technical analysis. Ehlers introduced the CoG in his book "Rocket Science for Traders", published in 2001, aiming to create a more effective indicator for identifying price reversals.
Calculations
The Center of Gravity is calculated by dividing the weighted sum of prices over a defined period by the sum of the weights, similar to finding the center of mass. The formula’s negative sign simply orients the CoG in a way that aligns with trading conventions, giving the CoG line its shape.
\[ CoG = { - { { \sum_{i=0}^{Length-1} { (1 + i) \cdot Median\ Price_{t-i} } } \over { \sum_{i=0}^{Length-1} { Median\ Price_{t-i} } } } + { {Length + 1} \over 2 } } \]
\(Median\) \(Price_{t-i}\) – the Median Price at index \(t-i\)
\(Length\) – the number of periods used in the calculation, default is 10
\(t\) – the specific period index, from 0 to \( ( Length - 1 ) \), relative to the current period
\(i\) – the loop index used to calculate the weighted sum over those periods
The lag represents the previous value of the CoG, essentially acting as a shifted version of the CoG line. It helps to visualise the previous value of the Center of Gravity, offering a comparison to the current CoG value. This comparison can help in identifying trends and potential reversals in price movement.
\[ Lag = CoG_{t-1} \]
Interpretation
-
Crossovers – a price crossing above the CoG suggests bullish momentum while crossing below indicates bearish momentum.
-
Reversal points – a price approaching the CoG from above may act as support, whereas approaches from below may serve as resistance.
-
Divergence – divergences between the price action and the CoG line may signal potential trend reversals.
Application
-
Buy signal – traders may consider buying when the price crosses above the CoG line, as this can indicate bullish momentum.
-
Sell signal – a sell signal may occur when the price crosses below the CoG line, suggesting potential bearish momentum.
-
Stop-loss placement – traders might set a stop loss near the CoG level to manage risk, as the indicator often acts as a dynamic support or resistance level.
-
Exit strategies – divergences between the price and the CoG line can act as signals for exiting positions, as these divergences often precede reversals.
Note
You can take advantage of algo trading, with cBots executing trades based on the signals from this indicator, as shown in our examples. Learn more about how to use indicators in cBots.
Limitations
The Center of Gravity relies on historical price data, which can cause signal delays, especially in fast-moving markets. Its effectiveness may also vary significantly depending on the selected calculation period, leading to false signals in volatile conditions.
Summary
The Center of Gravity is used to identify potential price reversals by calculating a weighted average of past price data. It serves as a dynamic support or resistance level, helping traders assess market conditions. Values above the CoG indicate bullish sentiment, while values below suggest bearish sentiment. The indicator is heavily inspired by the physics-based understanding of gravity.