Skip to content

Swing Index

Definition

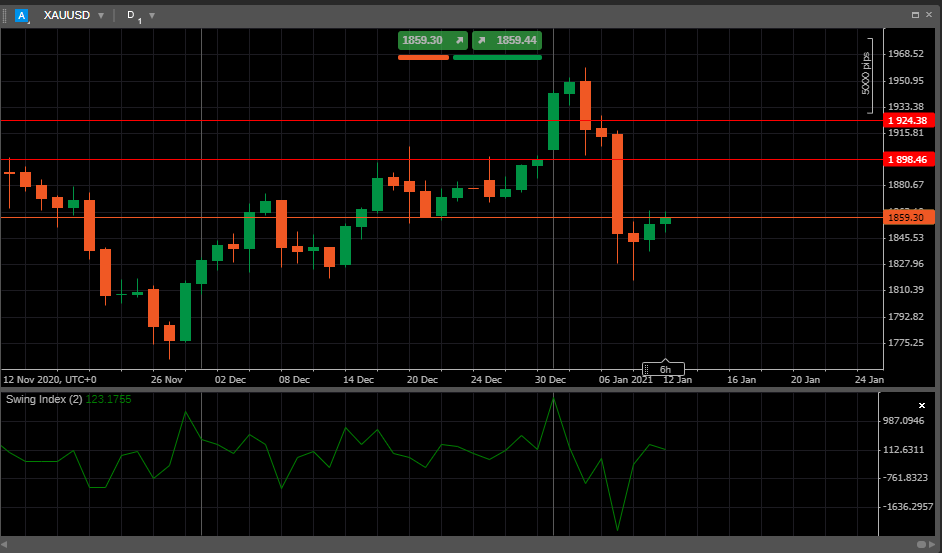
The Swing Index (SI) is a technical indicator designed to measure the strength and direction of price movements by comparing the relationships between the open, high, low, and close prices across consecutive periods. It evaluates the significance of these price swings and identifies potential trend reversals or breakouts. The SI outputs values that help traders assess trend momentum and understand how recent price action fits within the broader market context.

Download cTrader

History

The Swing Index indicator was developed by J. Welles Wilder, a renowned technical analyst, and introduced in his 1978 book ‘New Concepts in Technical Trading Systems’. Wilder believed that by quantifying price swings across consecutive periods, traders could better anticipate trend shifts and breakout points. While originally applied to commodities, the SI has since been adopted across various financial markets due to its effectiveness in analysing trend strength and detecting market reversals.

Calculations

The Swing Index value is calculated by the following formula:

\[ SI = { 50 \times { { (C_y - C) + {\frac{1}{2}} (C_y - O_y) + {\frac{1}{4}} (C - O) } \over R } \times {K \over T} } \]

\(C\) and \(C_y\) – Today and yesterday closing prices

\(O\) and \(O_y\) – Today and yesterday opening price

\(H\) and \(H_y\) – Today and yesterday highest price

\(L\) and \(L_y\) – Today and yesterday lowest price

\(R\) – determined by the largest of the following:

  • if \((H - C_y)\) is the largest, then \( R = { H - C_y - {\frac{1}{2}} (L - C_y) + {\frac{1}{4}} (C_y - O_y) } \)

  • if \((L - C_y)\) is the largest, then \( R = { L - C_y - {\frac{1}{2}} (H - C_y) + {\frac{1}{4}} (C_y - O_y) } \)

  • if \((H - L)\) is the largest, then \( R = { H - L + {\frac{1}{4}} (C_y - O_y) } \)

\(K\) – the largest of \((H_y - C)\) and \((L_y - C)\)

\(T\) – Limit Move Value, a trader-defined value of a limit move in one direction

Interpretation

By default, the Swing Index value is calculated using a Limit Move Value equal to 12.

The main patterns of the indicator behaviour can be interpreted as follows:

  • Zero-line crossover. The SI line crossing above the zero line suggests that the market might be shifting into a bullish phase or gaining upward momentum. A crossover below the zero line indicates increasing bearish sentiment or a possible downward trend.

  • Rising/falling. A rising SI indicates increasing momentum in the direction of the current trend, suggesting that the price movement is gaining strength. A falling SI reflects weakening momentum, signalling that the trend may be losing strength or preparing for a potential reversal.

  • Divergence/convergence. When the SI moves in the opposite direction of the price, it signals potential trend reversals. When the SI aligns with price action, it confirms the current trend strength.

  • Reversal points. Significant swings in the SI, particularly after extended upward or downward movements, can act as early warnings of trend reversals. If the SI peaks or bottoms while price trends persist, it may indicate the market is overextended and due for a reversal.

  • Breakouts. Large, sudden moves in the SI values suggest the market might be experiencing a breakout from a consolidation phase or significant price level. This indicates a shift in market sentiment, often leading to new trends.

Application

  • Buy signal. A possibility to enter a long position occurs when the SI rises sharply after crossing above the zero line. Traders might also enter long positions when the SI signals a reversal from a recent low.

  • Sell signal. A possibility to enter a short position occurs when the SI drops below the zero line or shows a sharp decline from recent highs. It may also signal an opportunity to sell if a divergence occurs between the SI and the price, suggesting a weakening trend.

  • Stop-loss placement. Traders can place stop loss just below recent swing lows (in case of a long trade) or above recent swing highs (in case of a short trade) to protect against adverse price movements.

  • Exit strategies. Consider exiting positions when the SI shows a reversal, such as a sharp decline after being in positive territory for a long position or a rise after being negative for a short position. Additionally, divergence between the SI and the price may signal the right time to exit.

  • Confirming trades. The SI is often used in combination with trend-following indicators (e.g., Moving Averages) or momentum oscillators (such as Relative Strength Index (RSI)) to confirm trade signals. For example, a buy signal from the SI can be more reliable when aligned with the RSI moving out of oversold territory.

Note

You can take advantage of algo trading, with cBots executing trades based on the signals from this indicator, as shown in our examples. Learn more about how to use indicators in cBots.

Limitations

The Swing Index can generate false signals in choppy or sideways markets, leading to potential losses. It may lag during rapid price movements, causing missed opportunities. Additionally, its effectiveness can be influenced by the chosen Limit Move Value, which may require optimization for different market conditions.

Summary

The Swing Index is a valuable technical indicator that measures the strength and direction of price movements by analysing the relationships between opening, high, low and closing prices. It helps traders identify potential trend reversals and assess market momentum. While useful for capturing significant price swings, the SI can be affected by market volatility and may require adjustments for optimal performance. Combining the SI with other indicators can enhance trading strategies and improve decision-making.

Download cTrader