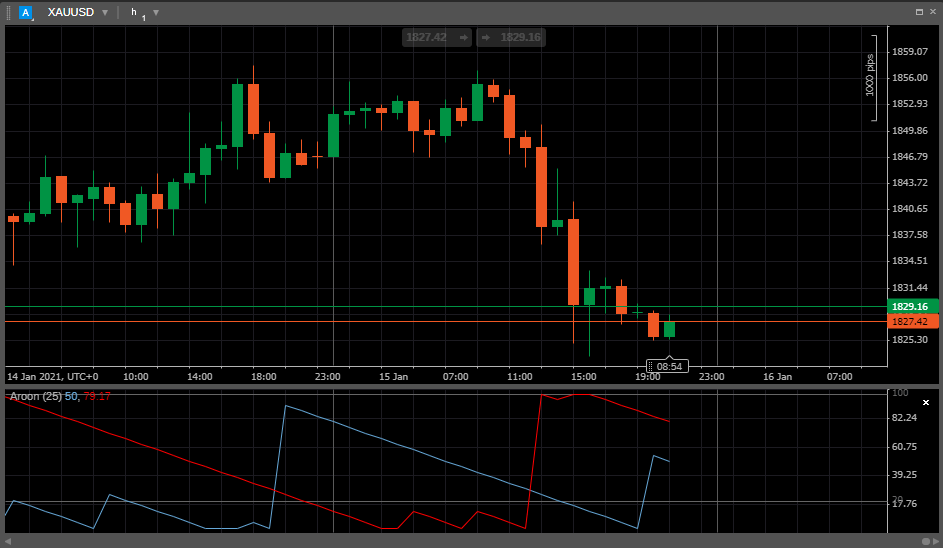
Aroon
The Aroon indicator is a technical tool for identifying the trend strength and changes in the symbol price.
It helps to indicate if a price is trending or is in a trading range. It can also reveal the beginning of a new trend and changes from trading ranges to trends.
In essence, Aroon measures the time between highs and the time between lows over a specific time period.
The idea is that strong uptrends regularly meet new highs, and strong downtrends regularly meet new lows, and the Aroon indicator signals when this is happening, and when it isn't.

The Aroon indicator consists of two lines - the Aroon Up and Aroon Down - that measure the strength of the uptrend and the downtrend respectively.
The Aroon Up and the Aroon Down lines fluctuate between zero and 100, with values close to 100 indicating a strong trend and values near zero indicating a weak trend.
The lower the Aroon Up, the weaker the uptrend and the stronger the downtrend, and vice versa. The main assumption underlying this indicator is that a symbol's price will close regularly at new highs during an uptrend, and regularly make new lows in a downtrend.
The Aroon Up and Aroon Down lines can be calculated with the following formula:
1 | |
According to this formula, the Aroon Up line measures the time interval since the prices have recorded a new high within the specified period.
If the current bar's high is the highest, then the Aroon Up value is 100, or it is a new high for the period. Otherwise, it returns a percent value indicating the time since a new high occurred for the specified period.
1 | |
The Aroon Down line measures the time interval since prices have recorded a new low within the specified period.
If the current bar's low is the lowest, then the Aroon Down value is 100, or it is a new low for that period. Otherwise, it returns a percent value indicating the time since the new low occurred for the specified period.
When both indicators are below 50 it can signal that the price is consolidating. New highs or lows are not being created. Traders can watch for breakouts as well as the next Aroon crossover to signal which direction price is going.
Usage
If the Aroon Up crosses above the Aroon Down, then it means that a new uptrend may start soon. Conversely, if Aroon Down crosses above the Aroon Up, then a new downtrend may be expected.
When the Aroon Up reaches 100, then it means that a new uptrend may have begun. If it remains persistently between 70 and 100, and the Aroon Down remains between 0 and 30, then a new uptrend is underway.
When Aroon Down reaches 100, then it means that a new downtrend may have begun. If it remains persistently between 70 and 100, and the Aroon Up remains between 0 and 30, then a new downtrend is underway.
Therefore, crossovers may signal entry or exit points. Aroon Up crossing above Aroon Down can be a signal to buy, while Aroon Down crossing below Aroon Up may be a signal to sell.
When Aroon Up and Aroon Down move in parallel (horizontal, sloping up or down) with each other at roughly the same level, then price is range trading or consolidating.
Limitations
Sometimes the Aroon indicator may provide poor or false signals, for example after a substantial price move has already occurred.
This happens because the indicator is looking backwards, analyzing the past moves, and is not predictive actually.
The crossovers may look good on the indicator, but it doesn't mean the price will necessarily make a big move. Also, Aroon doesn't take into account the size of moves, it only considers the number of days since a high or low.
Even if the price is relatively flat, crossovers will still occur as a new high or low will be made within the last periods. Traders are advised to use price analysis, and other indicators along with Aroon, as relying on one indicator is not recommended.
In cTrader, you can find the Aroon indicator among the other built-in indicators. See the Indicators section to learn more about how to use them.